
Monitoring Releva elements in Google Analytics
Running an online store means that you must also be able to track and evaluate every sale and event occurring on your website. Releva was born in the data world and although we offer extensive monitoring on our Analytics menu → Dashboard, it is unthinkable not being able to track Releva’s performance in Google Analytics.
Below you will find instruction on how you can accurately monitor user behaviour and sales attribution in Google Analytics (GA4) for Releva, through the Exploration feature.
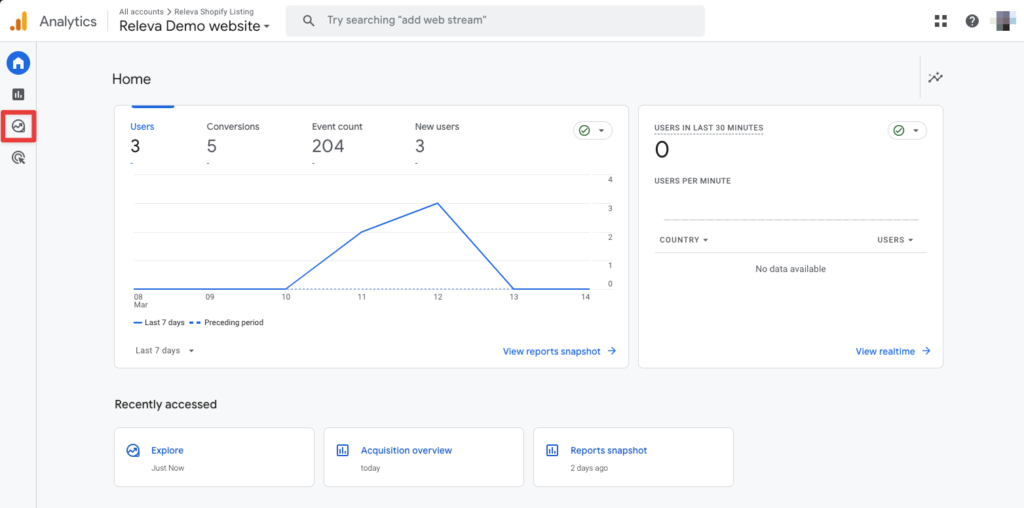
Open the Explore menu
After opening GA4, the first step would be to open the Explore menu located on the left side of your screen:
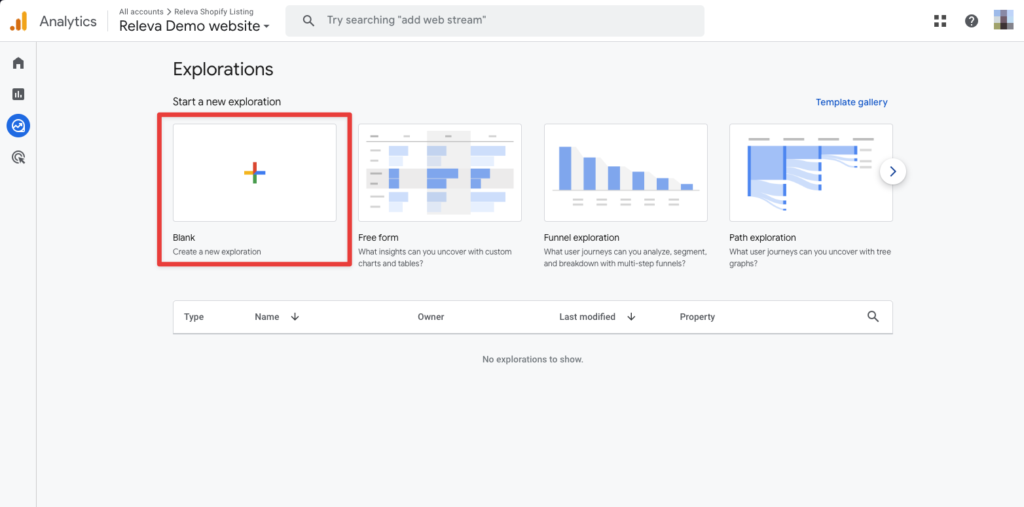
Create a new Exploration
Once you’ve opened the menu, click on the square with the + sign to create a new Blank exploration:
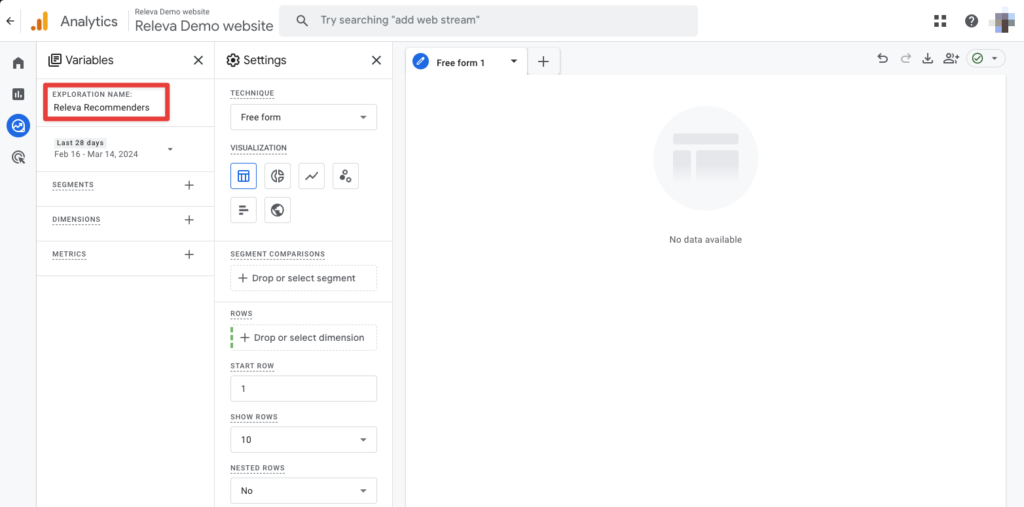
Write a unique name
Upon the new page loading, you will be greeted by a blank Exploration. We would advise you to write a name for the Exploration itself, so it would be easier to find it amongst your other Explorations later:
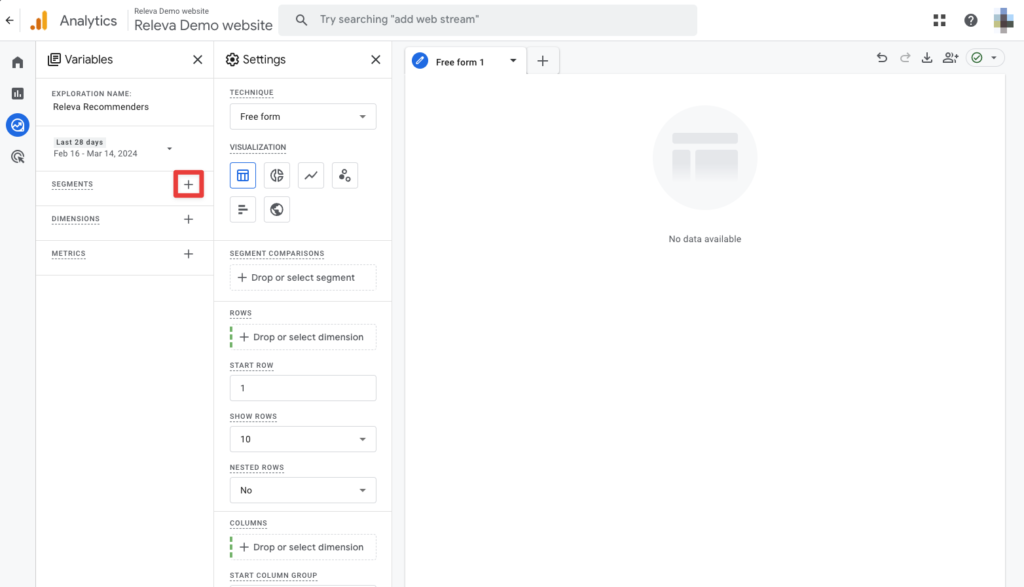
Segment creation
When ready, click on the plus (+) sign on the right side of the Segments section:
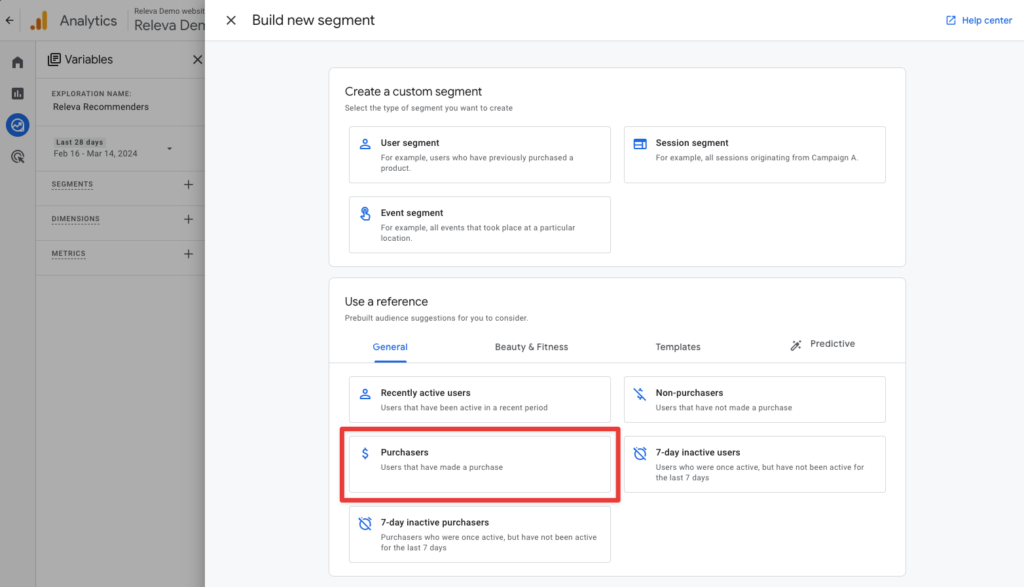
Once you do so, a side modal will open allowing you to choose from a number of options. For our case, choose Purchasers:
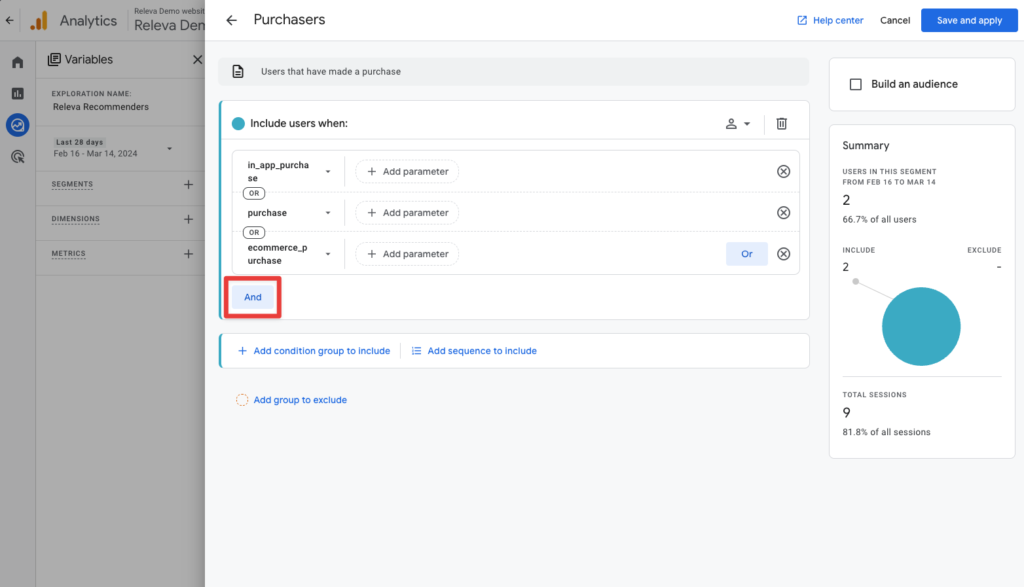
Doing so, you will be presented with the below filter pre-populated for you. What you will additionally need to do is click on the button “And“ below them:
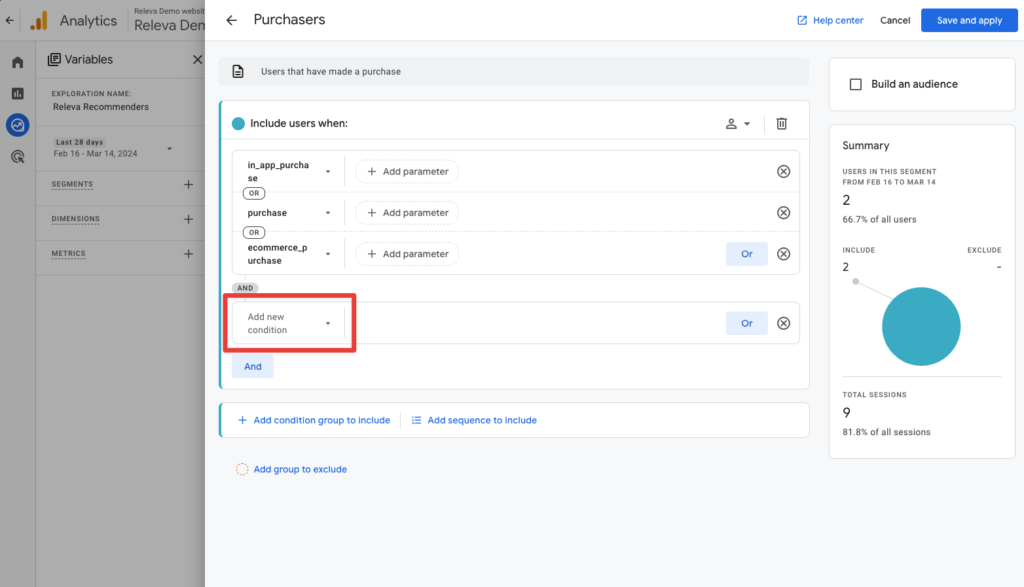
Click on the “Add new condition“ drop-down menu:
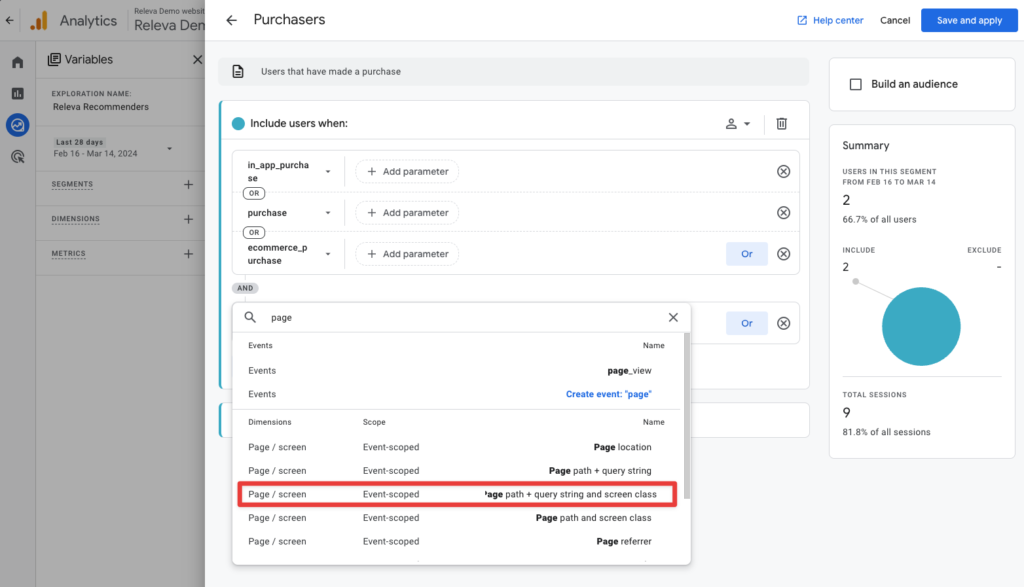
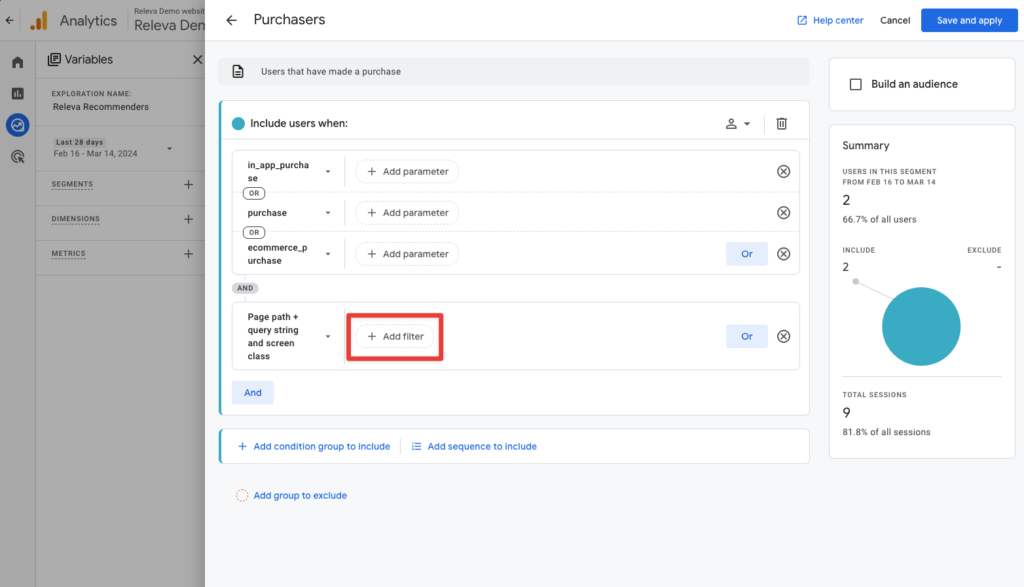
When the drop-down menu expands, type the keyword page as shown on the screen below and choose Page path + query string and screen class:
Afterwards, click on the + Add filter button located on the right:
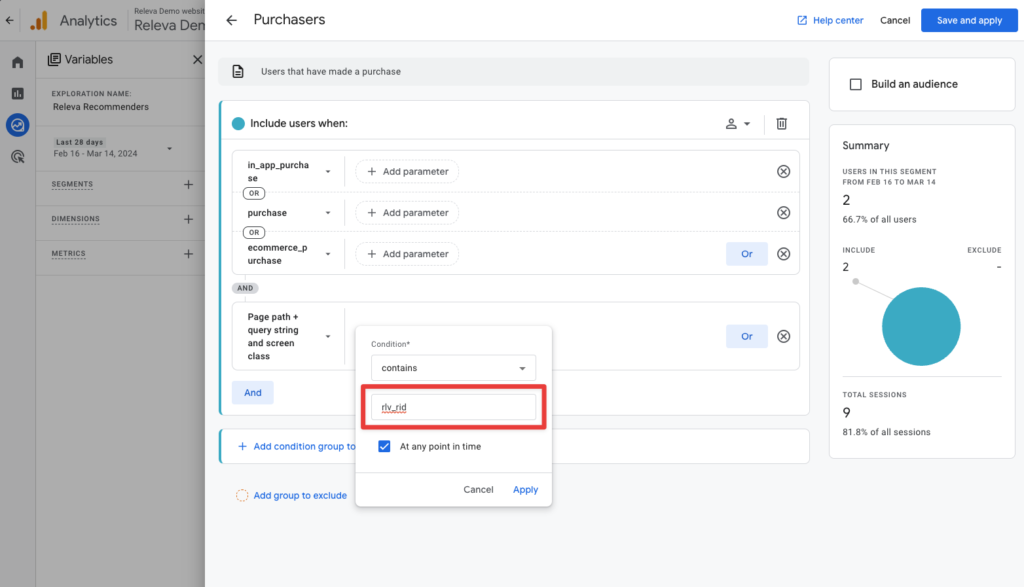
Leave the condition to be contains and at the bottom field, type one of the below values based on what you would like to track:
- Releva Recommenders – rlv_rid
- Releva Banners – rlv_bid
Once ready, click on the button Apply to save your selection and move to the next step.
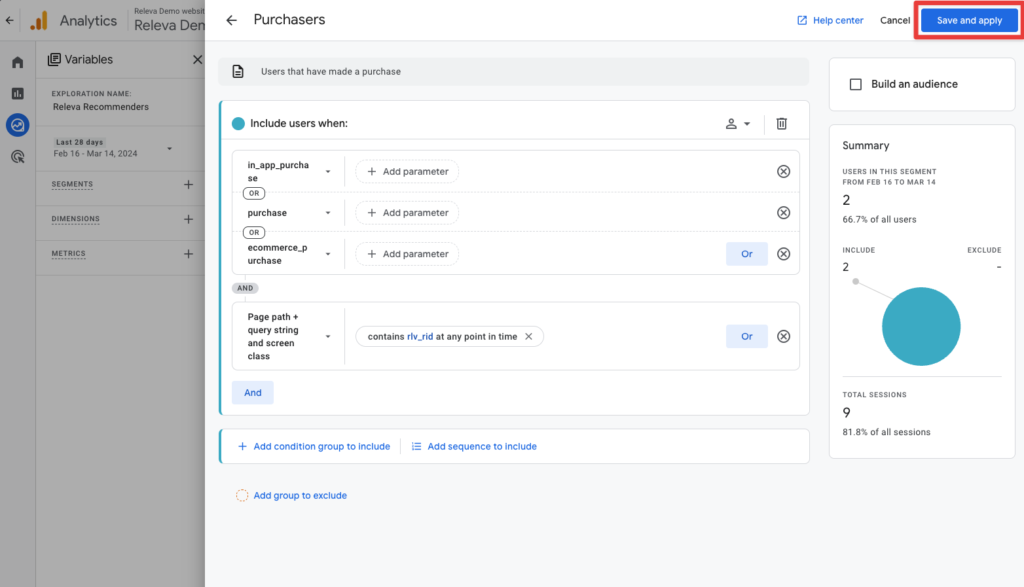
Your filters should look similar the ones below. If they do, click on the Save and apply button located at the top-right corner:
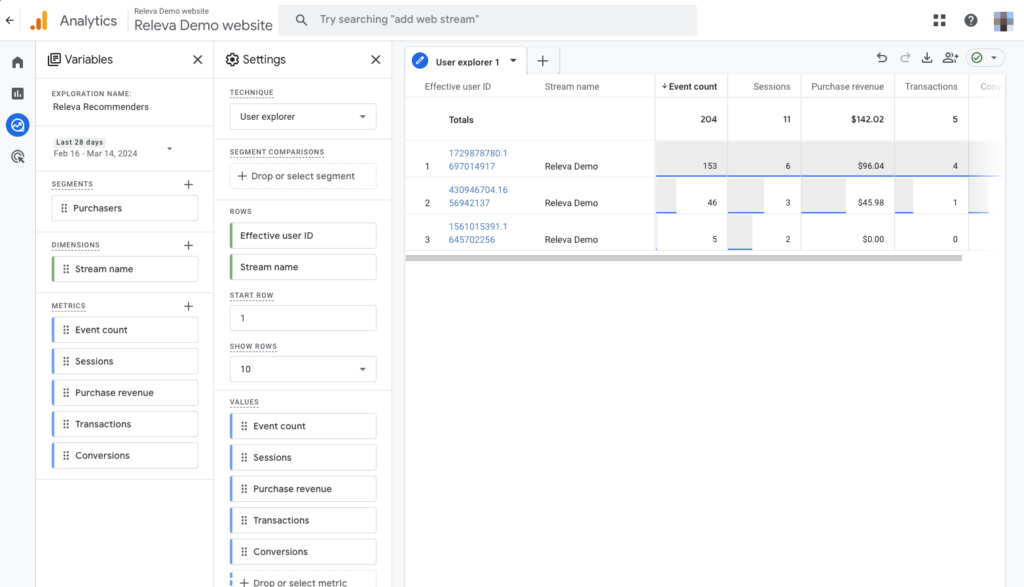
In the second row, you’ll find a menu called Technique which will allow you to visualise the data differently. We recommend you choose User Explorer as it will show you the information in a clear way:
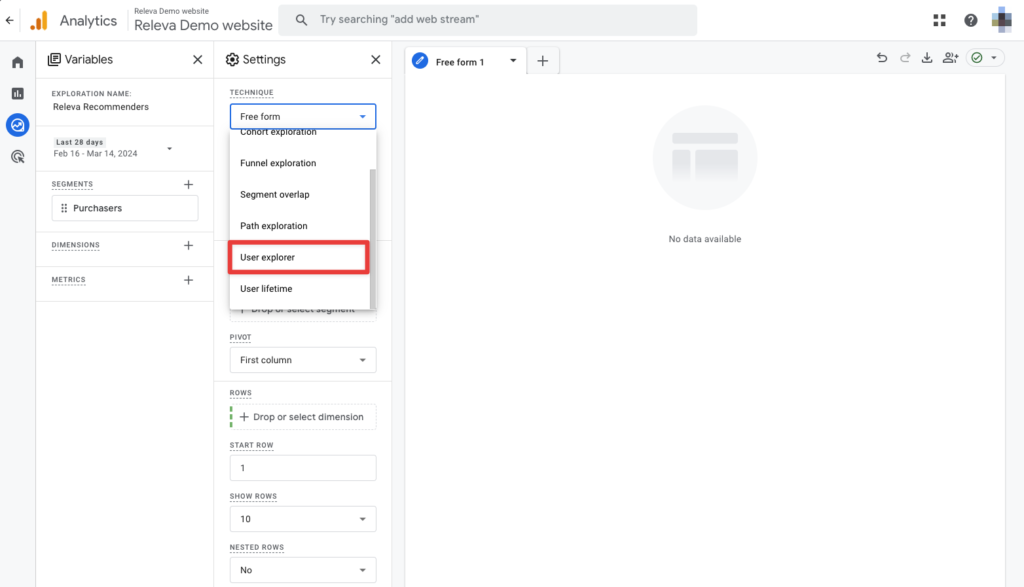
The end result should look similar to this (with different numbers and data of course):
Sharing your Explorations
Every Exploration you create will be personal to you and nobody will be able to view them at first. If you’d like to share any of them, you can do so by clicking on the three dots at the right side of the Exploration and choose Share:
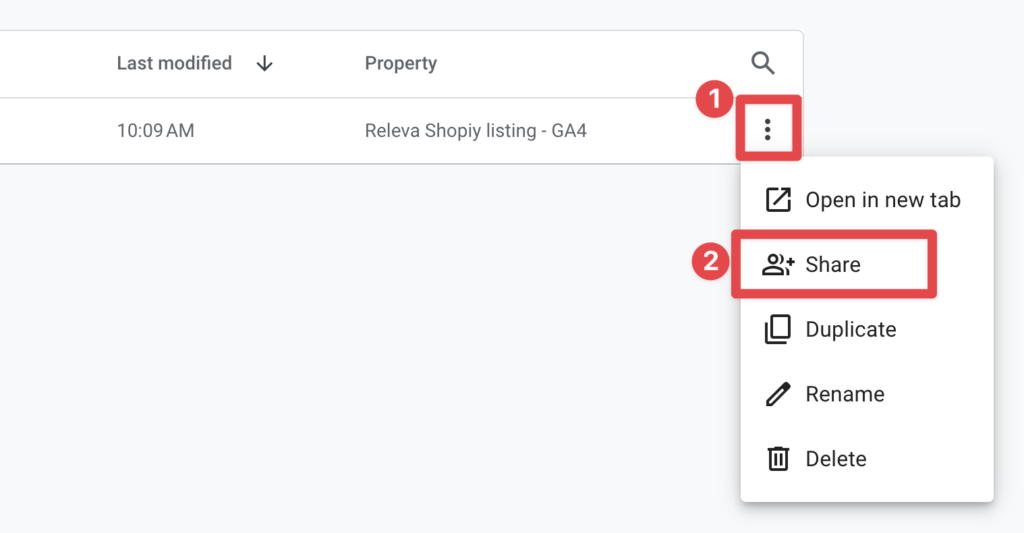
Please note, if you choose to Share a particular Exploration, it’ll be shared with everyone that has access to this Google Analytics property. The access itself will be in read-only mode so they won’t be able to make any changes to your settings.
You are all set! Once you have completed the above steps, you will now be able to monitor the traffic assisted by Releva in the respective Segments.
Feel free to share your feedback or let us know what else you would like to know about Releva at support@releva.ai!