

Check Releva on your site with debug mode
Debug mode shows you, on your own site, everything Releva would put on a page: product blocks, banners and stories, including the ones that are still switched off, out of schedule or limited to a segment. It also draws an outline around every product block so you can find it. Only your browser tab is affected; your shoppers see the site as usual.
Before you start
Section titled “Before you start”- The Releva snippet, plugin or app is installed on your site, otherwise the page cannot ask Releva for its blocks (Connect your custom website).
- At least one product block or banner block exists on a Personalization page that matches the page you will open, with a layout and a CSS Selector (Create a product block, Show a banner on your site). The block can be switched off.
- Use a desktop browser. You do not need to be logged in to Releva.
-
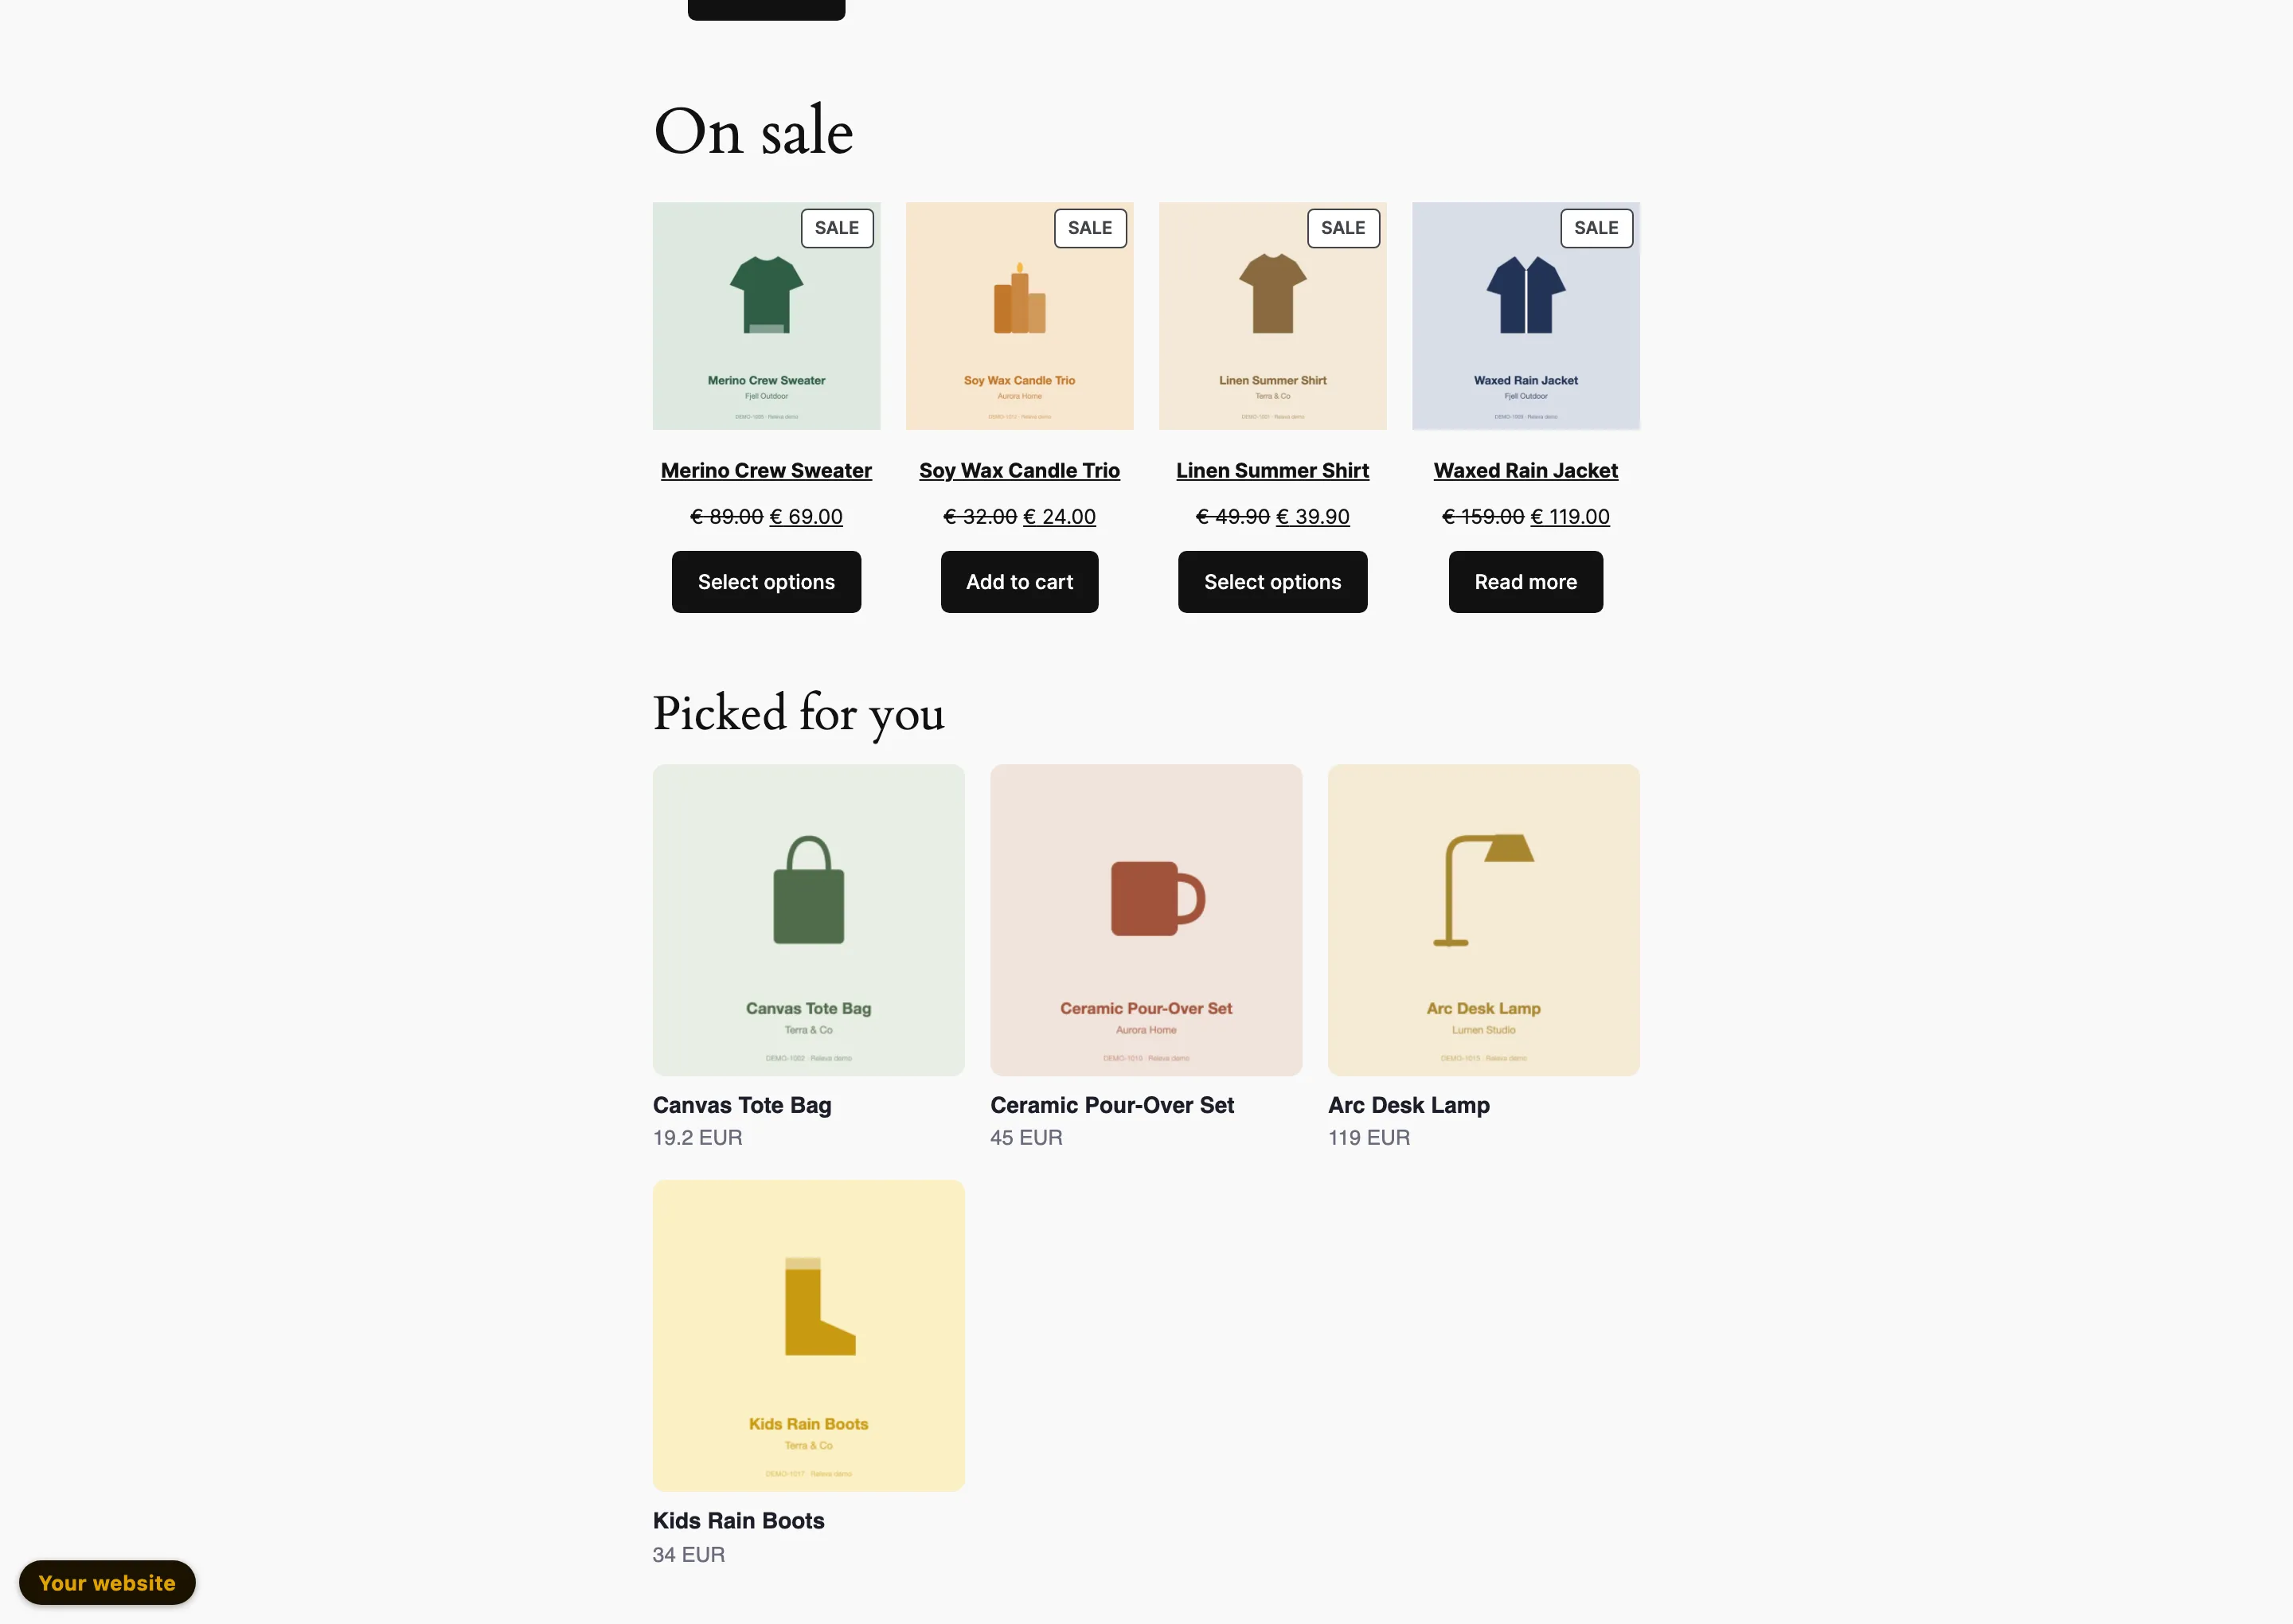
Open a page of your site in your browser, for example the home page. Without debug mode, a product block looks the way your shoppers see it, with no outline
-
In the address bar, add
?rlv_mode=debugto the end of the address and press Enter. If the address already contains a?, add&rlv_mode=debuginsteadFor example
https://www.example.com/?rlv_mode=debug. Releva now treats this tab as a debug session until you close it. -
Close any story or pop-up you do not need, and wait a few seconds
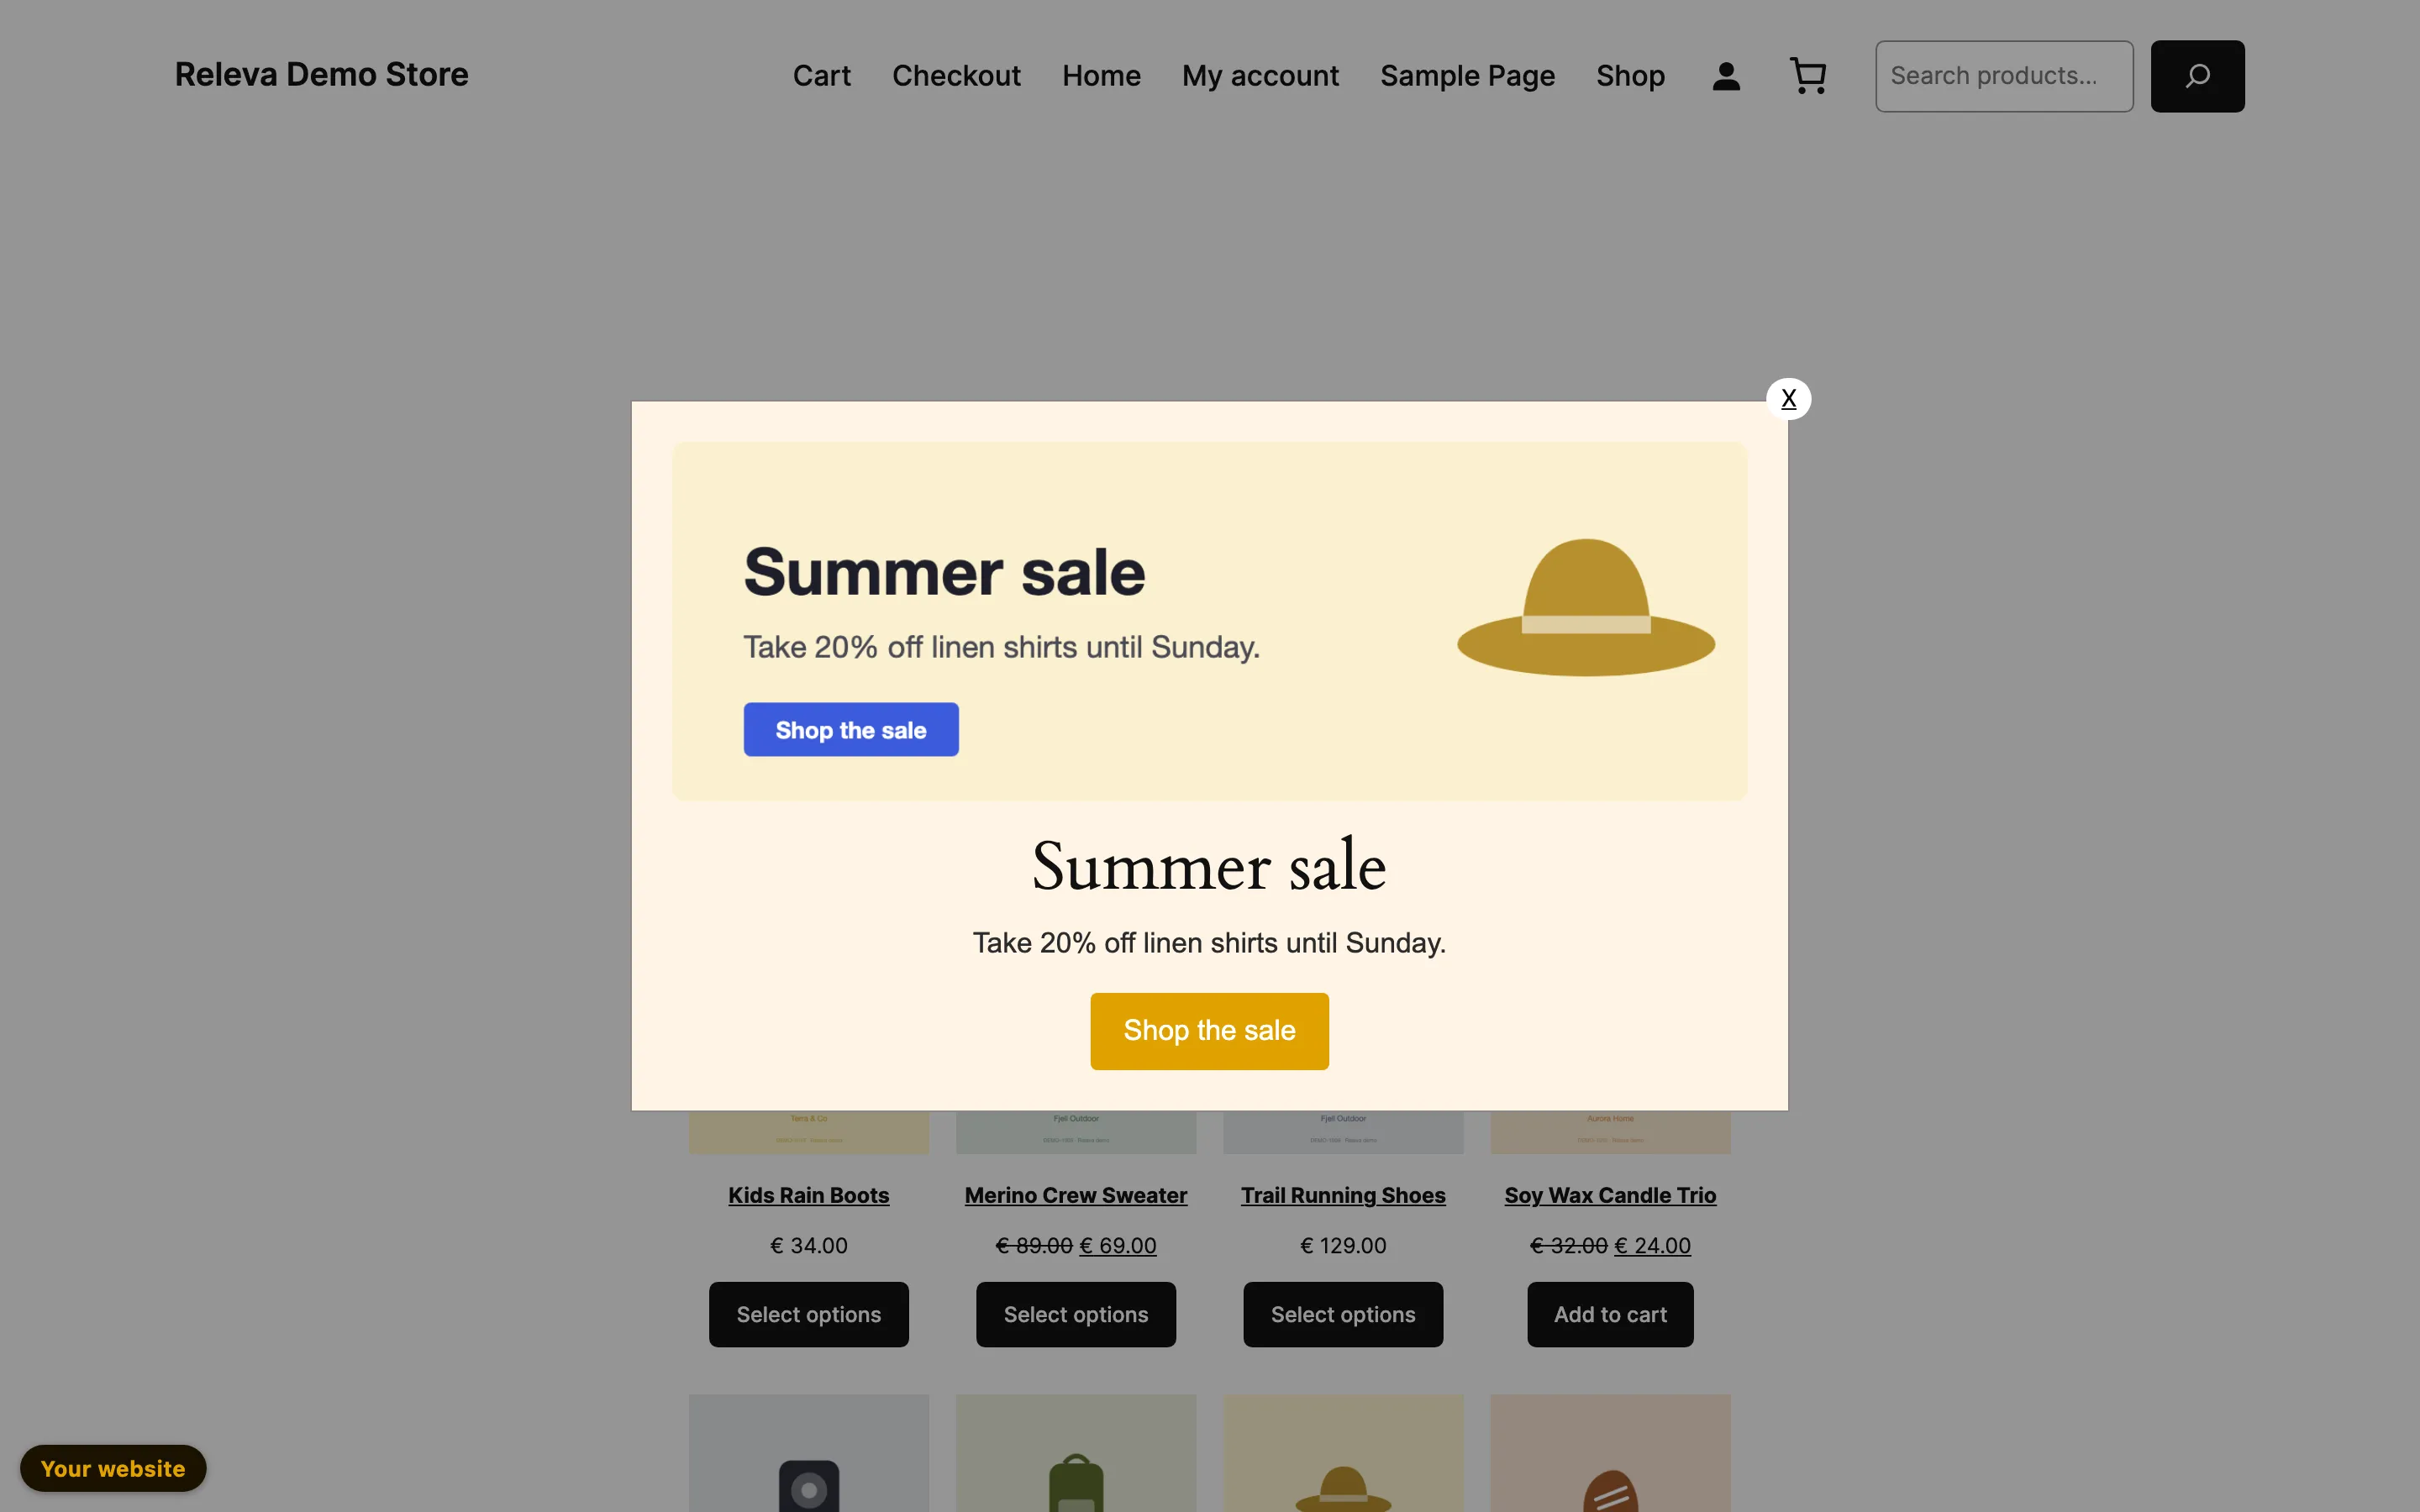
Debug mode shows banners that are switched off, but each banner still waits for its own trigger. The pop-up below is off in Releva and set to After N seconds on the page, so it opens five seconds after the page loads. A banner triggered by scrolling, by leaving the page or by a cart change appears when you do that.
-
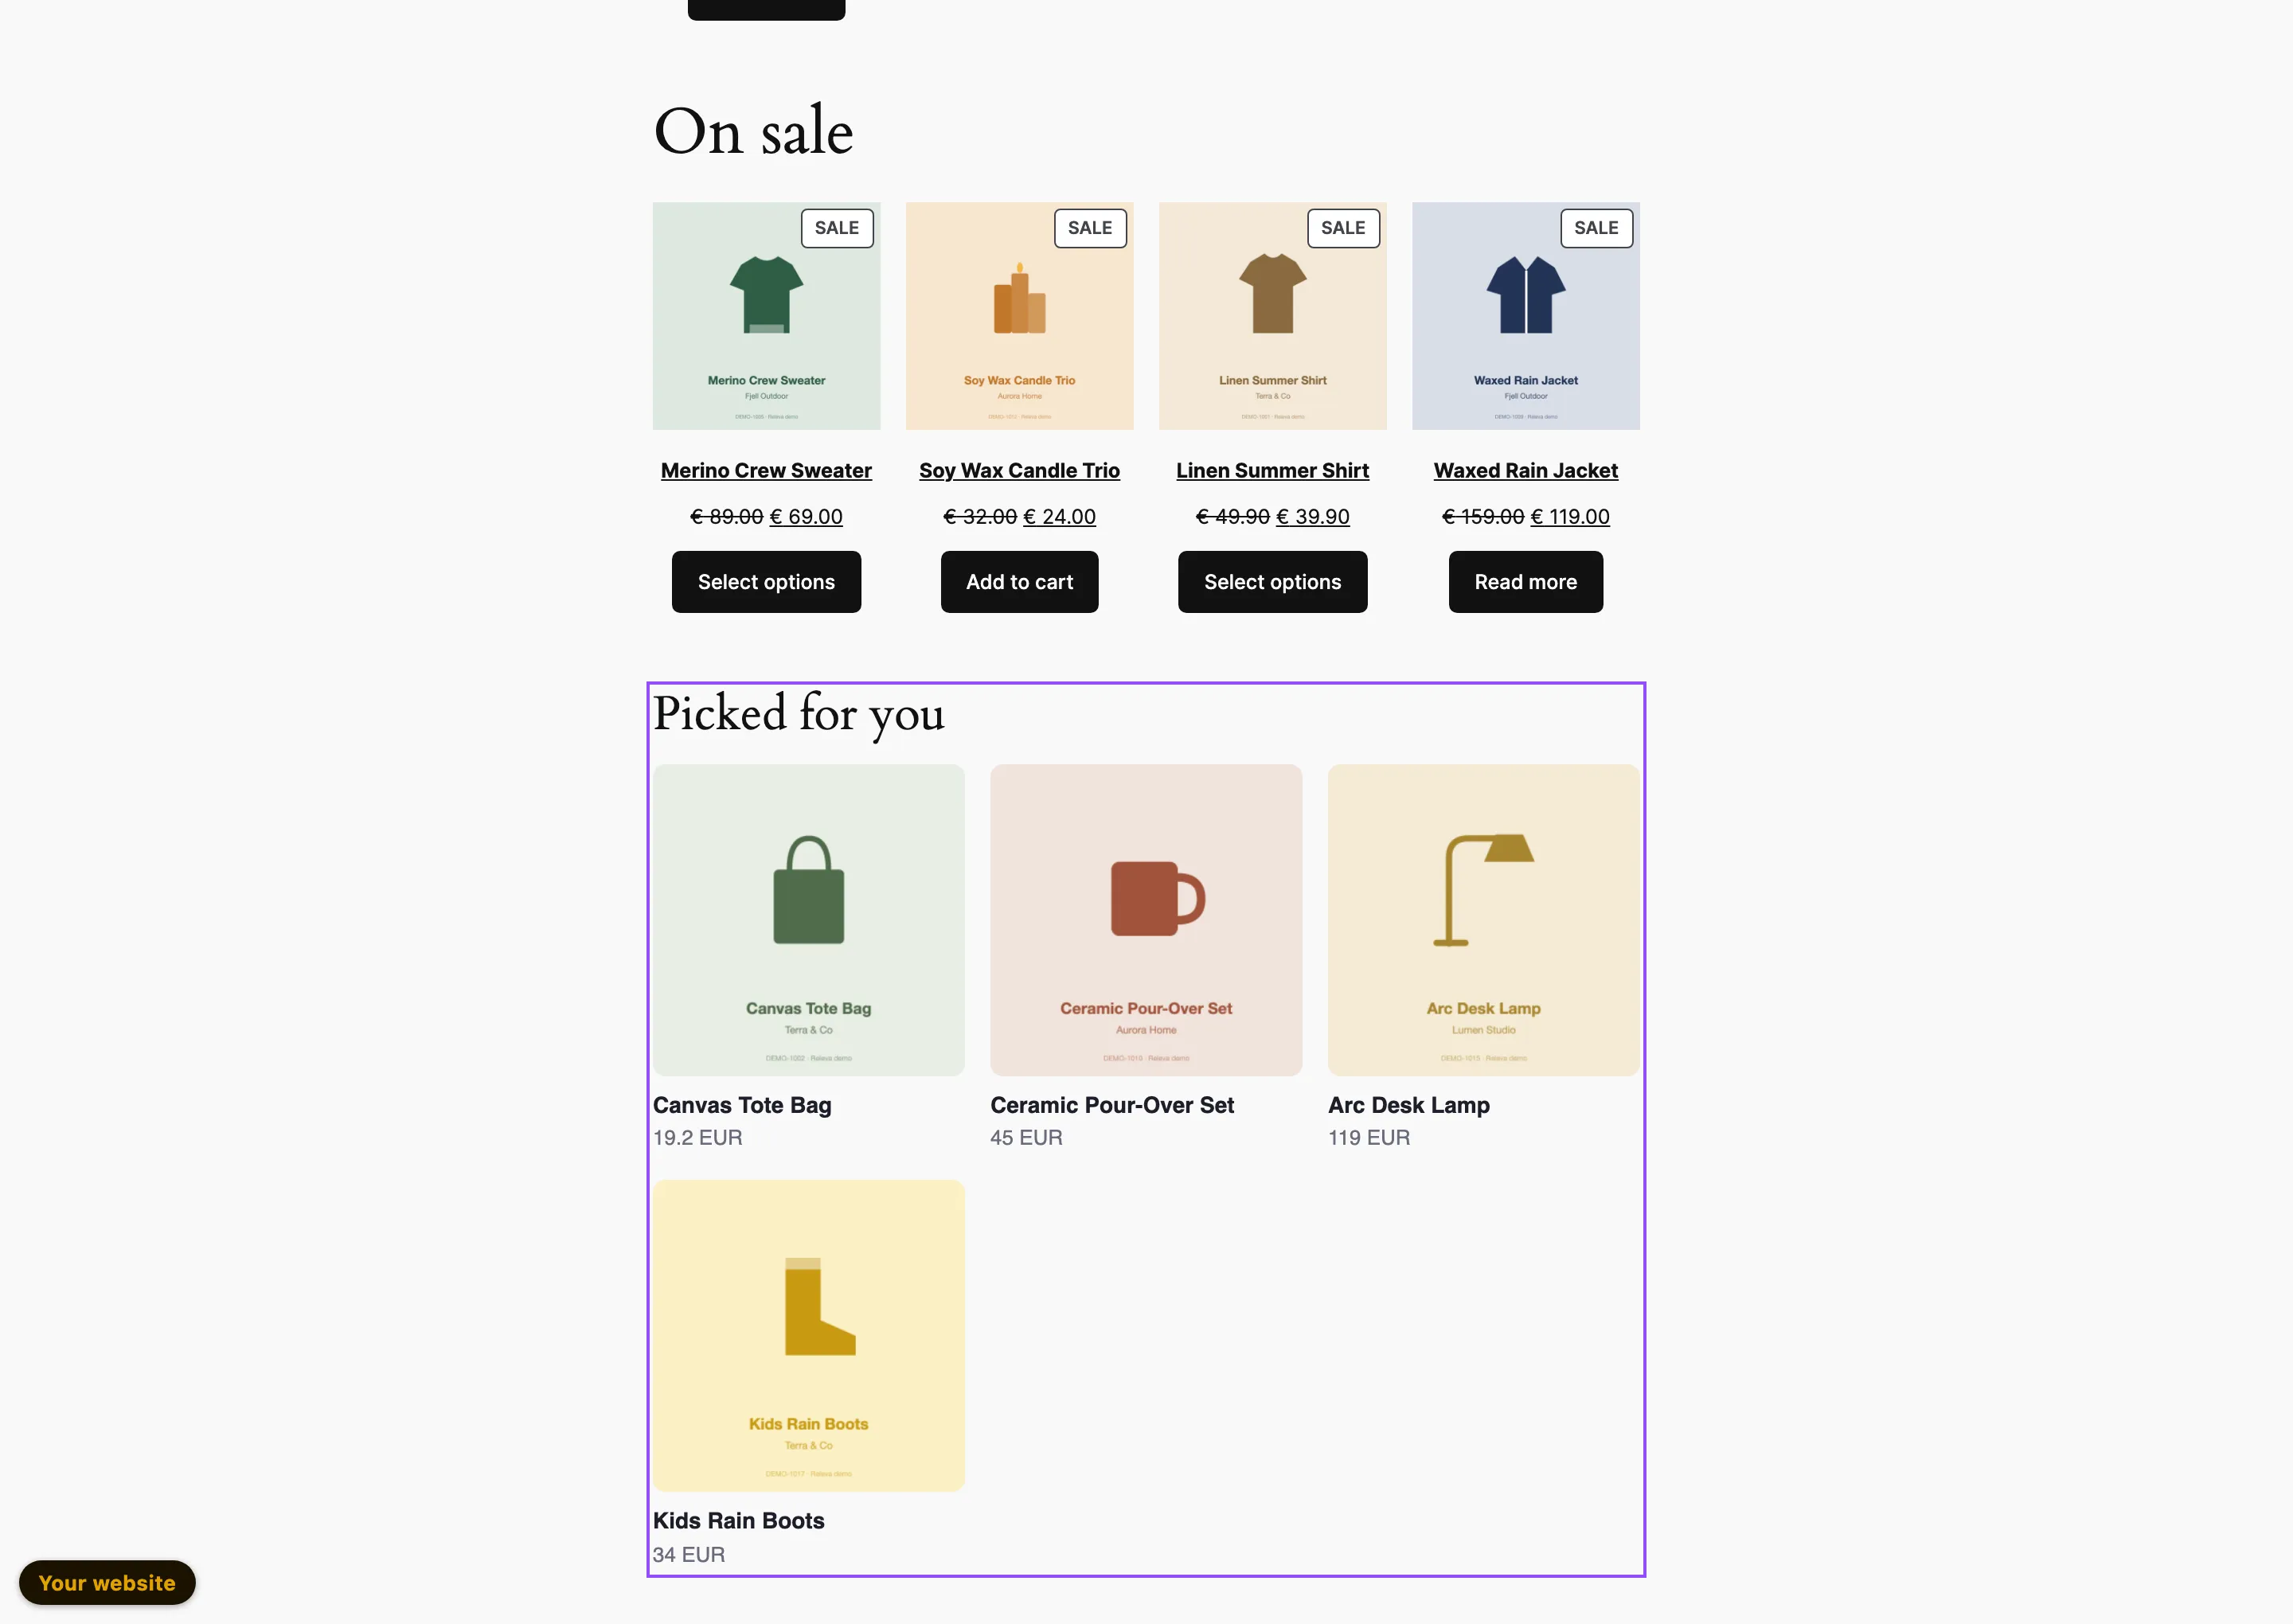
Scroll to your product blocks. Each one has a purple outline
The outline follows the block as you scroll or resize the window. Banners and stories get no outline.
-
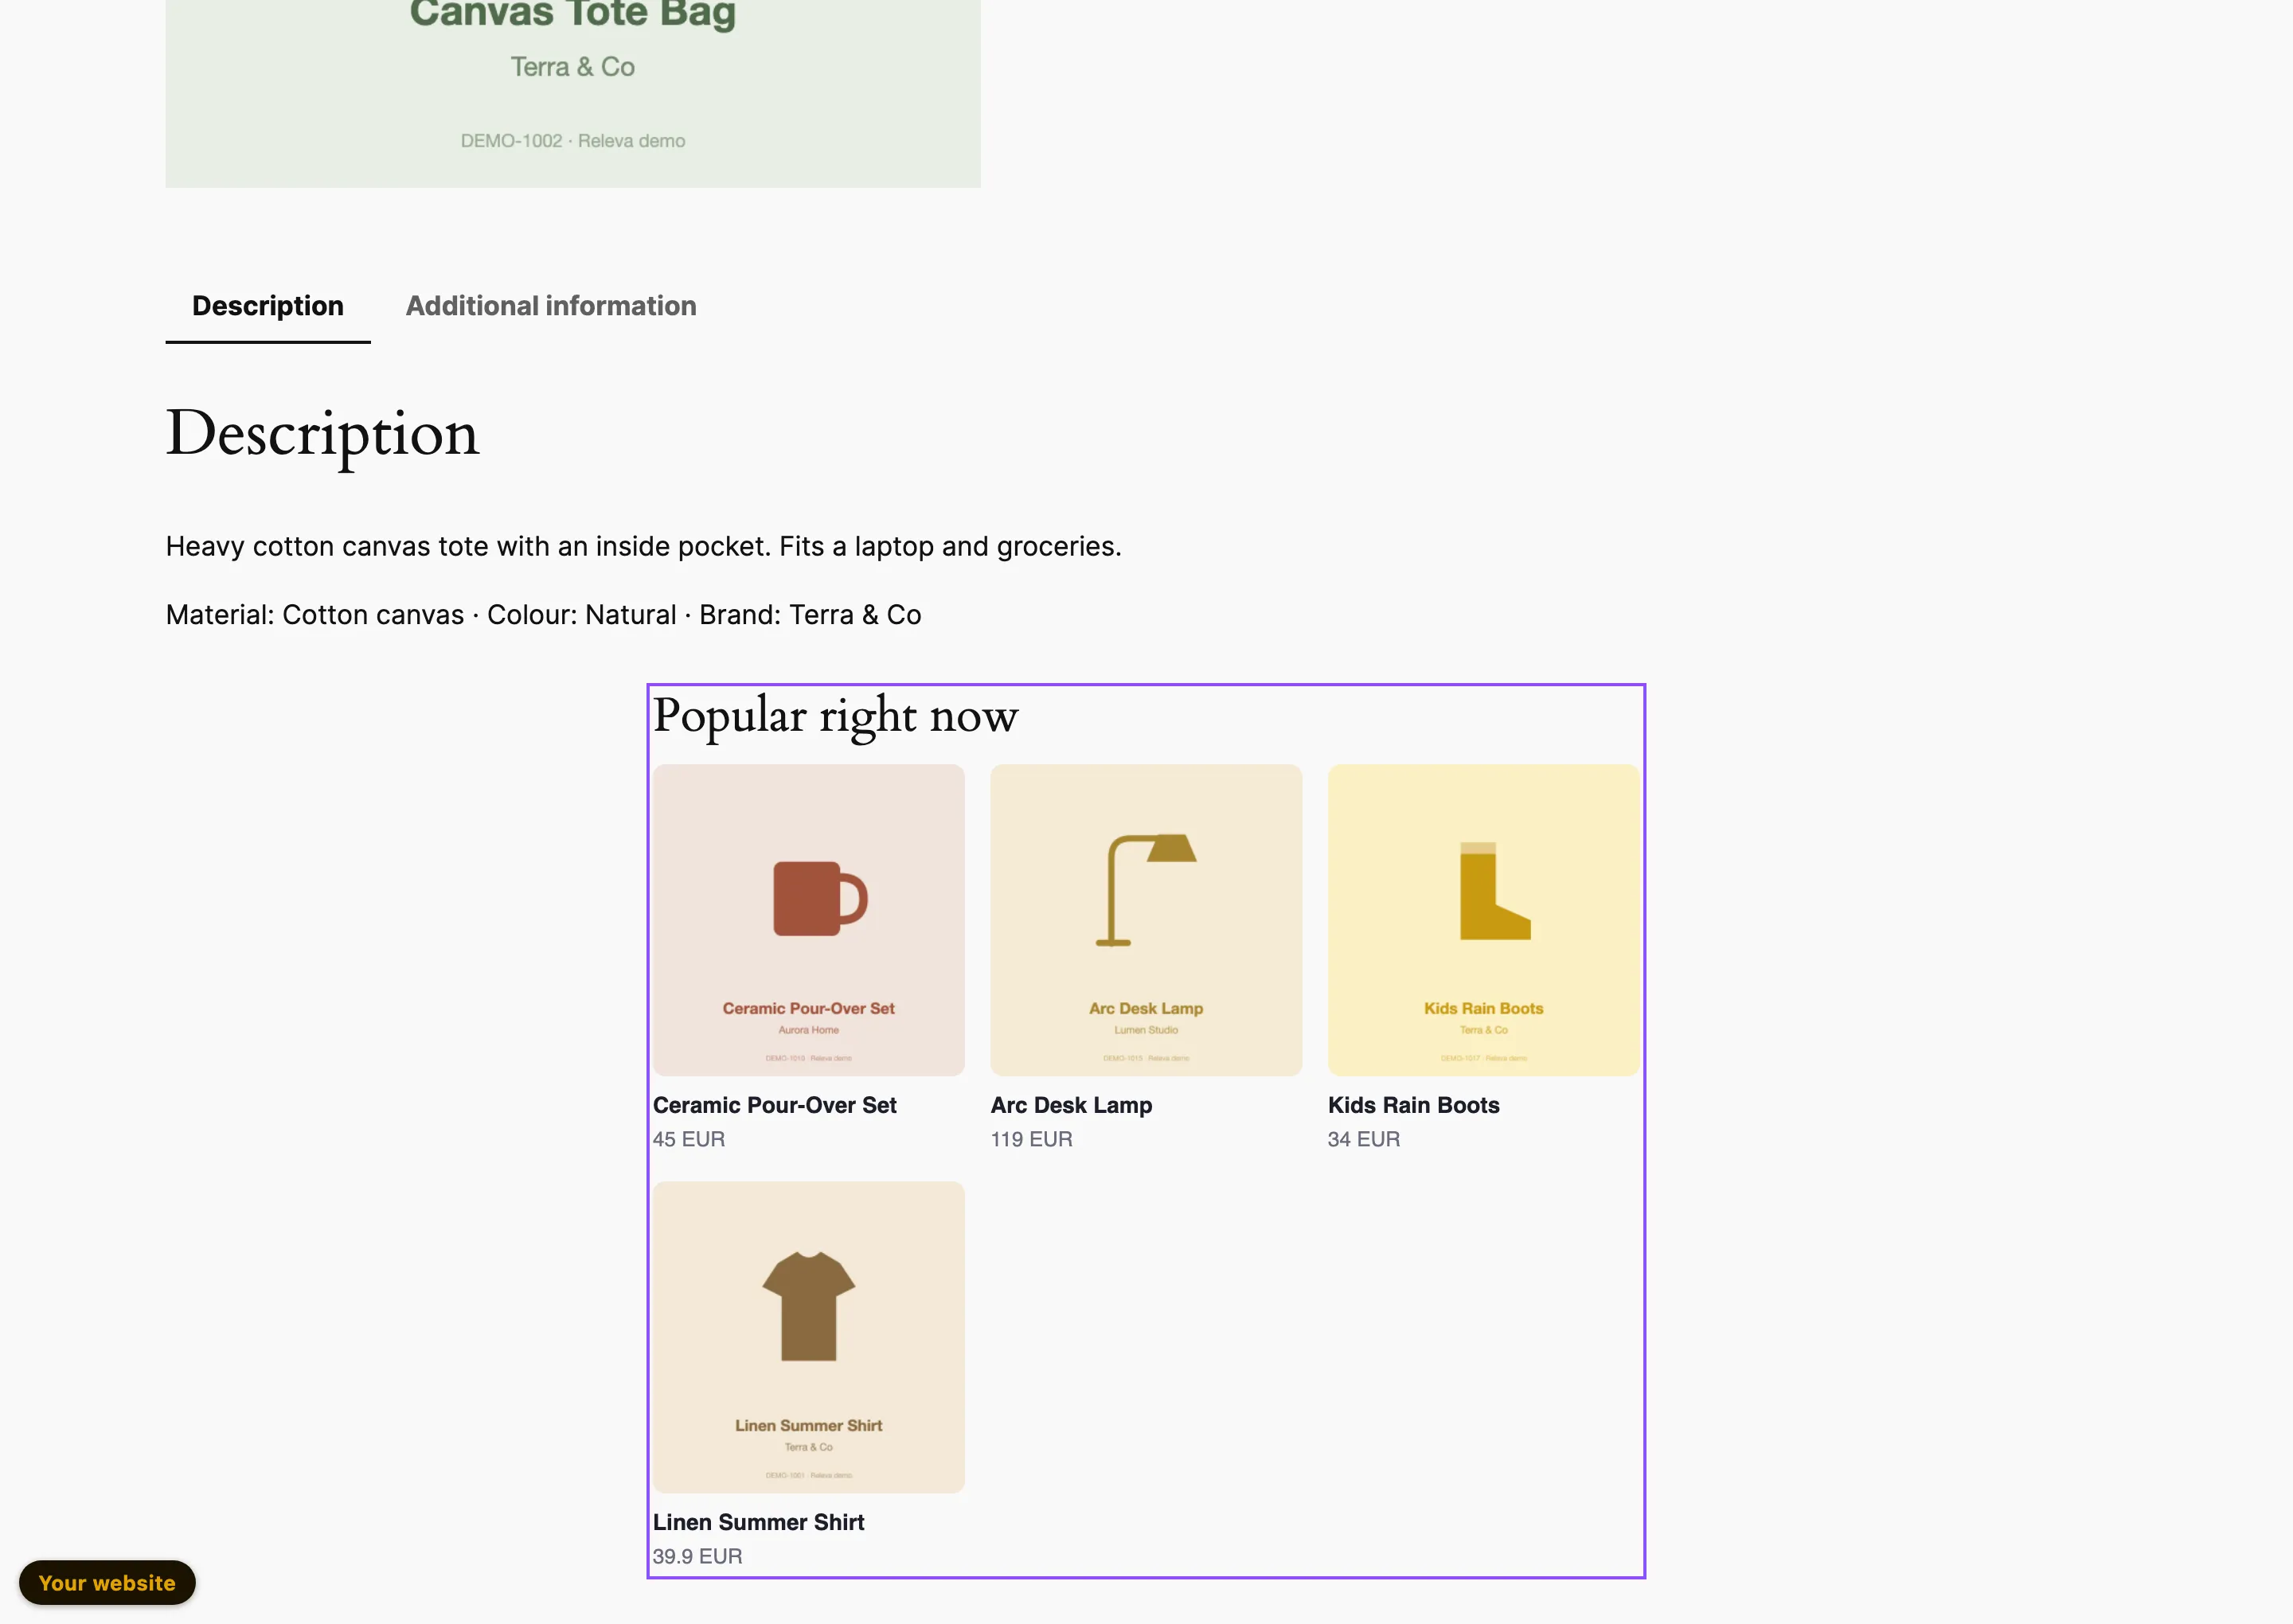
Open another page of your site in the same tab, for example a product page. Debug mode stays on: you do not need to add the parameter again
-
Optional, for developers: open your browser’s DevTools and select the Console tab. In debug mode the Releva SDK logs every request it sends as
[Releva <version>] Request to <url>:followed by the data it sent, and confirms stored impressions withimpressions tracked successfullyThe logged URLs contain your shop’s public access token. Share console output with your developer or with Releva support, not in public.
Check it worked
Section titled “Check it worked”- Every product block on the page has a purple outline, and a block that is switched off in Personalization › Product Blocks is shown with the products from its feed.
- A banner block that is switched off appears once its trigger fires.
- Moving to another page in the same tab keeps the outlines. A new tab, or a private window, that you open by typing the address is in normal mode and shows only what your shoppers see.
Leave debug mode
Section titled “Leave debug mode”Close the tab. Debug mode is stored for that tab only and ends with it. To switch it off without closing the tab, open any page of your site with ?rlv_mode=off at the end of the address: any value other than debug replaces the stored mode. A tab opened from a link inside the debug tab can inherit it, so to see the site as your shoppers do, open a new tab or a private window and type the address yourself.
What debug mode changes
Section titled “What debug mode changes”| Feature | Shown in debug mode |
|---|---|
| Product blocks | Also the blocks that are switched off or outside their Show when dates. The block’s audience, URL filter and Locales to Display are ignored too. Each block gets an outline. |
| Banner blocks | Also the blocks that are switched off. The banner’s audience, Show when dates, URL filter, Show until click, store language and Session Interval are ignored, so every banner on the page can appear. Display triggers still apply. A/B test control groups are bypassed. |
| Stories | Also the stories that are switched off. |
| Search as you type and the chat bot | Also when they are switched off, provided they are set up for the page. |
| Surveys | Also surveys in draft, and the schedule and frequency limits are ignored. A survey’s platform, segment and trigger still apply. |
Two things debug mode does not do:
- It does not test who sees a banner. Because every banner is forced on, debug mode cannot tell you whether a customer in a given segment would get it. Open a profile under Data Platform › Profiles and select Impersonate to browse the site as that customer instead (see Preview your site as a customer).
- It does not hide your visit from statistics. Page views, impressions and clicks in debug mode are tracked like any other visit. Use a page you do not report on, or keep your test visits short, when you check a block’s numbers.
Troubleshooting
Section titled “Troubleshooting”Nothing is outlined. The page has no product block that the SDK can draw: the block needs a layout and a CSS Selector that matches an element on this page, and the page’s Personalization page must match the URL you opened. A block without a layout is passed to your integration’s code and gets no outline. If the Releva snippet does not run at all, no block is shown in any mode: see the Verify section of Connect your custom website.
The pop-up never appears. The banner block waits for its trigger even in debug mode. Scroll, move the mouse out of the window, add a product to the cart, or wait the number of seconds set in the block’s Trigger.
A block I just saved does not show. Reload the page after a minute; the SDK and Releva cache a page’s blocks for a short time after a change.
A new tab is still in debug mode. You opened it from the debug tab, which can pass the mode on. Open the site in a new tab or a private window by typing the address, or open any page with ?rlv_mode=off.
I see debug mode on, but shoppers report the banner is missing. That is expected: debug mode ignores the banner’s audience, schedule and URL filter. Check those settings with Choose who sees a banner and the checklist in How banners work.