

Check how a story performs
Every story card on Personalization › Stories carries its numbers for the chosen period, and Statistics opens a day-by-day chart and the products bought after a story click. This guide reads both and explains what each number counts. For what a story is, read How stories work.
Before you start
Section titled “Before you start”- The story is switched on and has been shown to visitors. A story with no impressions shows zeros and an empty chart.
- Your shop sends story events through the Releva SDK. Without them nothing is counted.
- For Conversions, Purchases and Revenue, your shop also sends cart and order events to Releva.
-
Go to Personalization › Stories
-
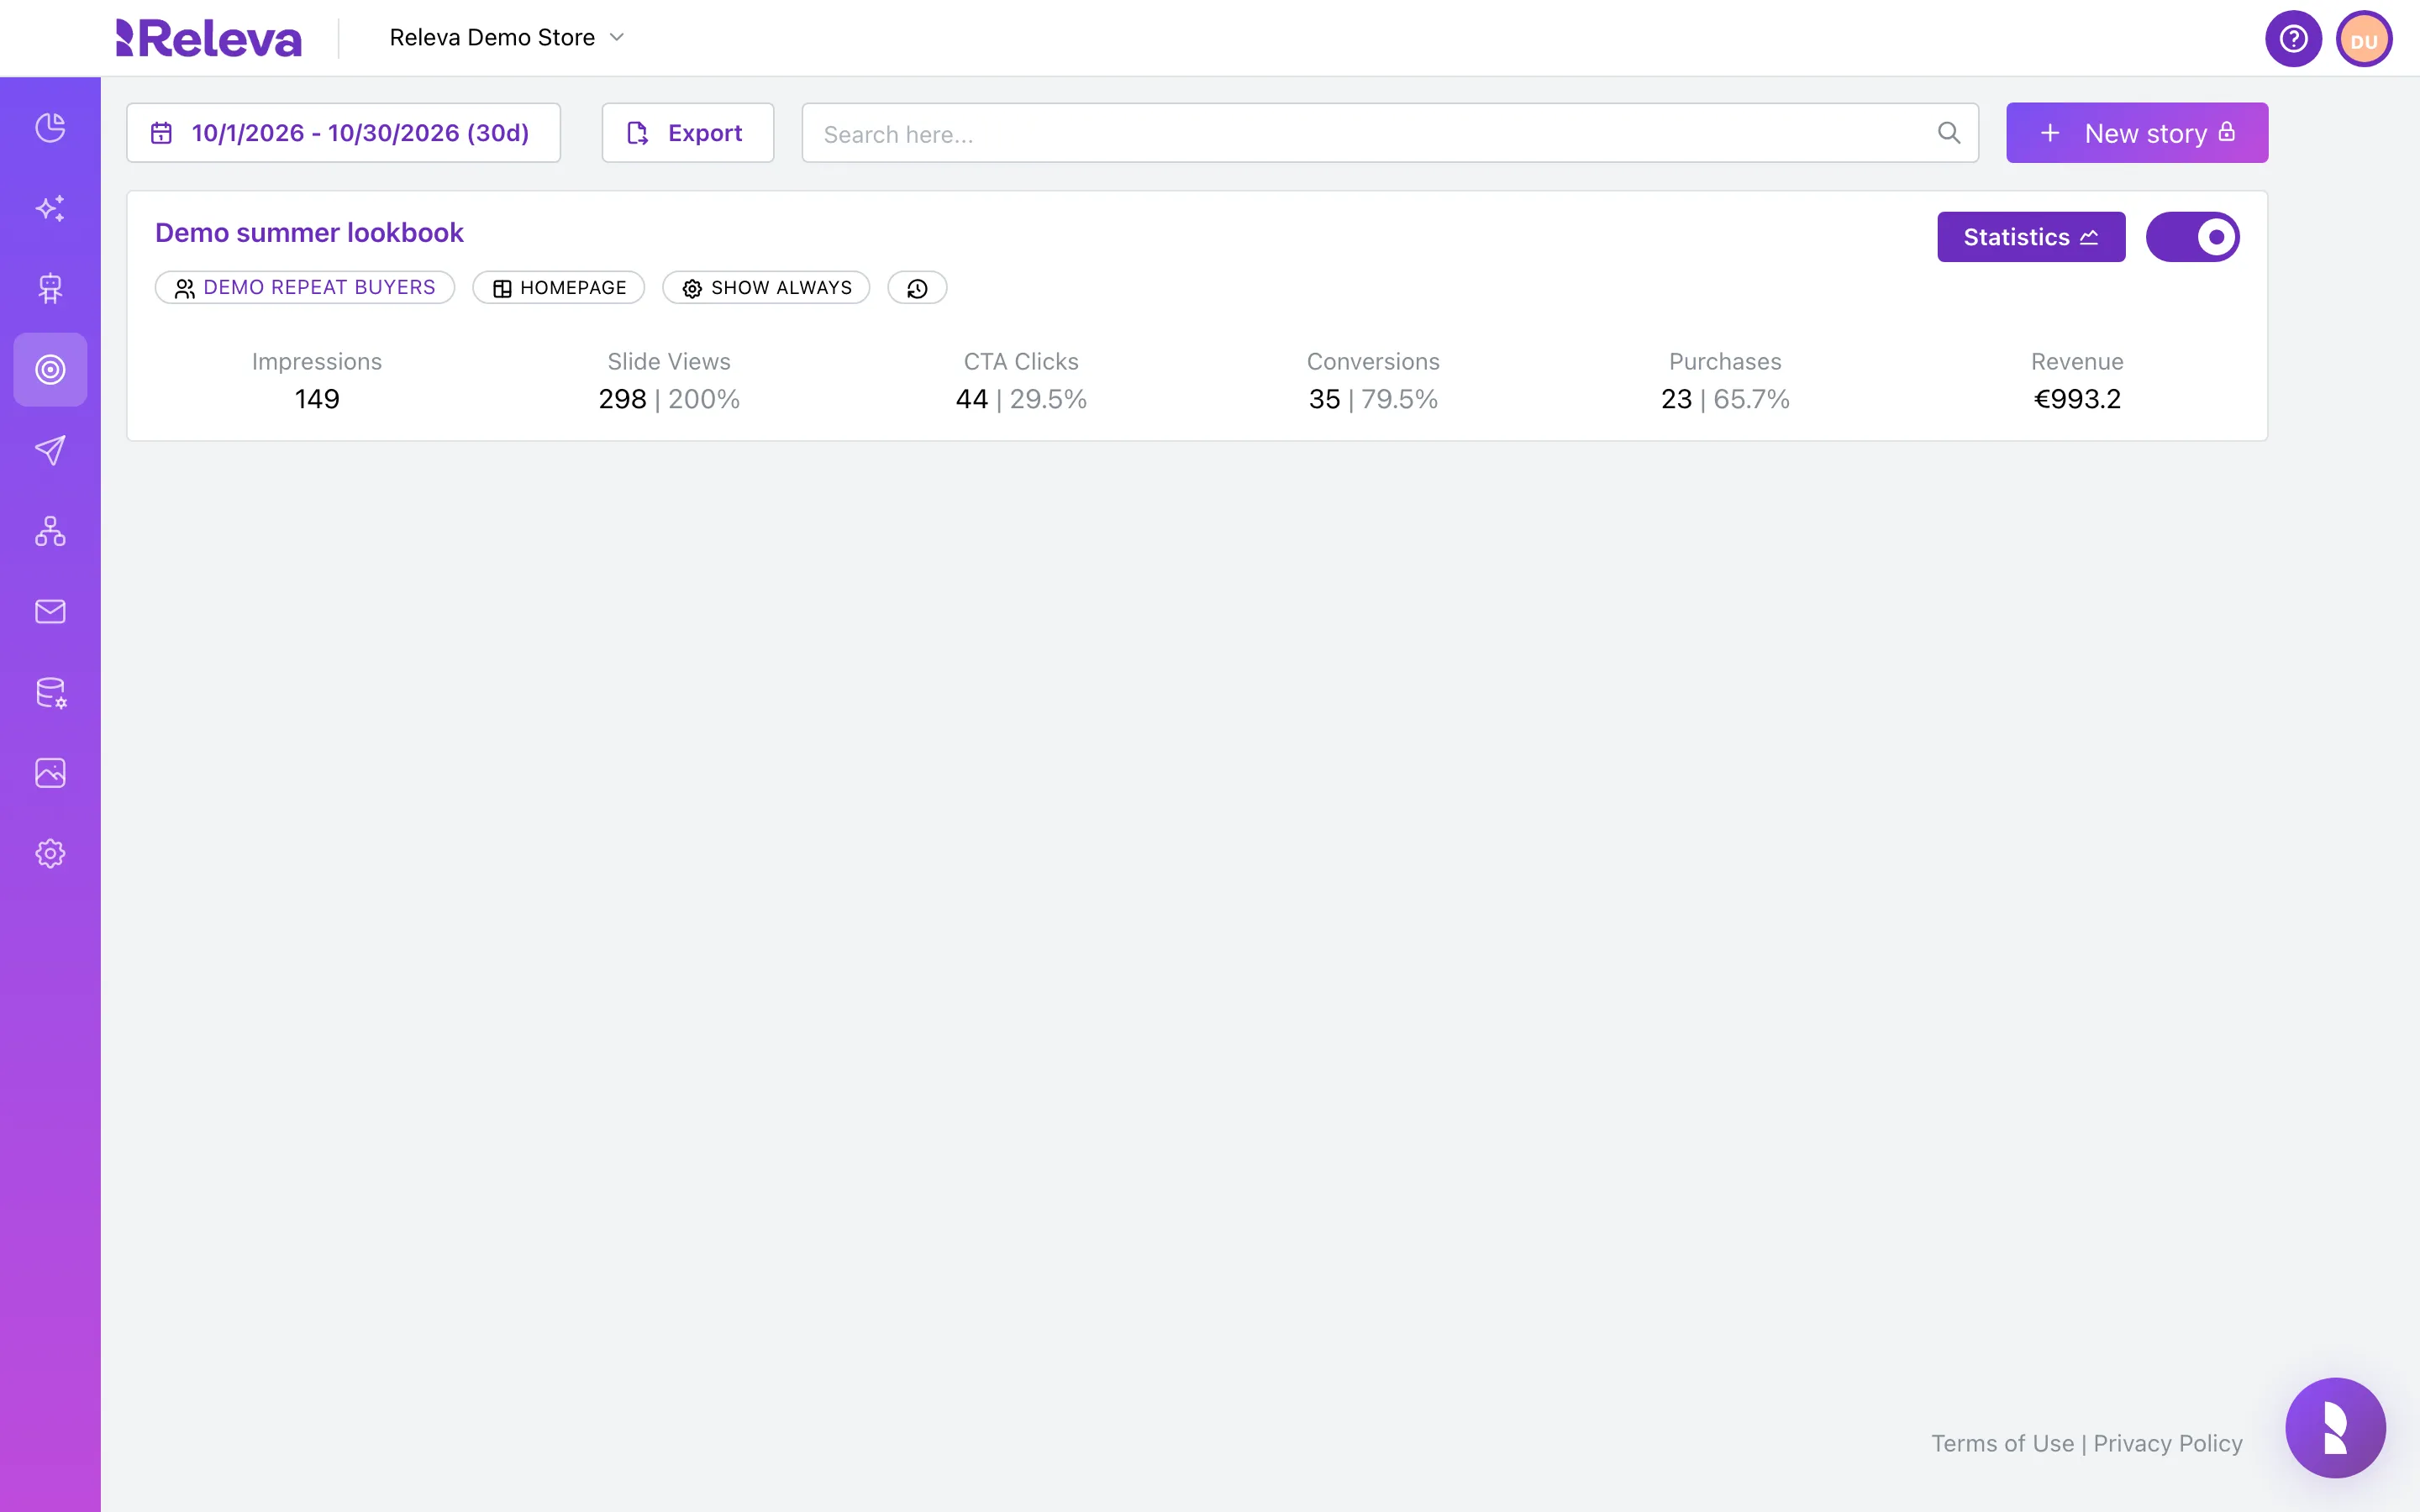
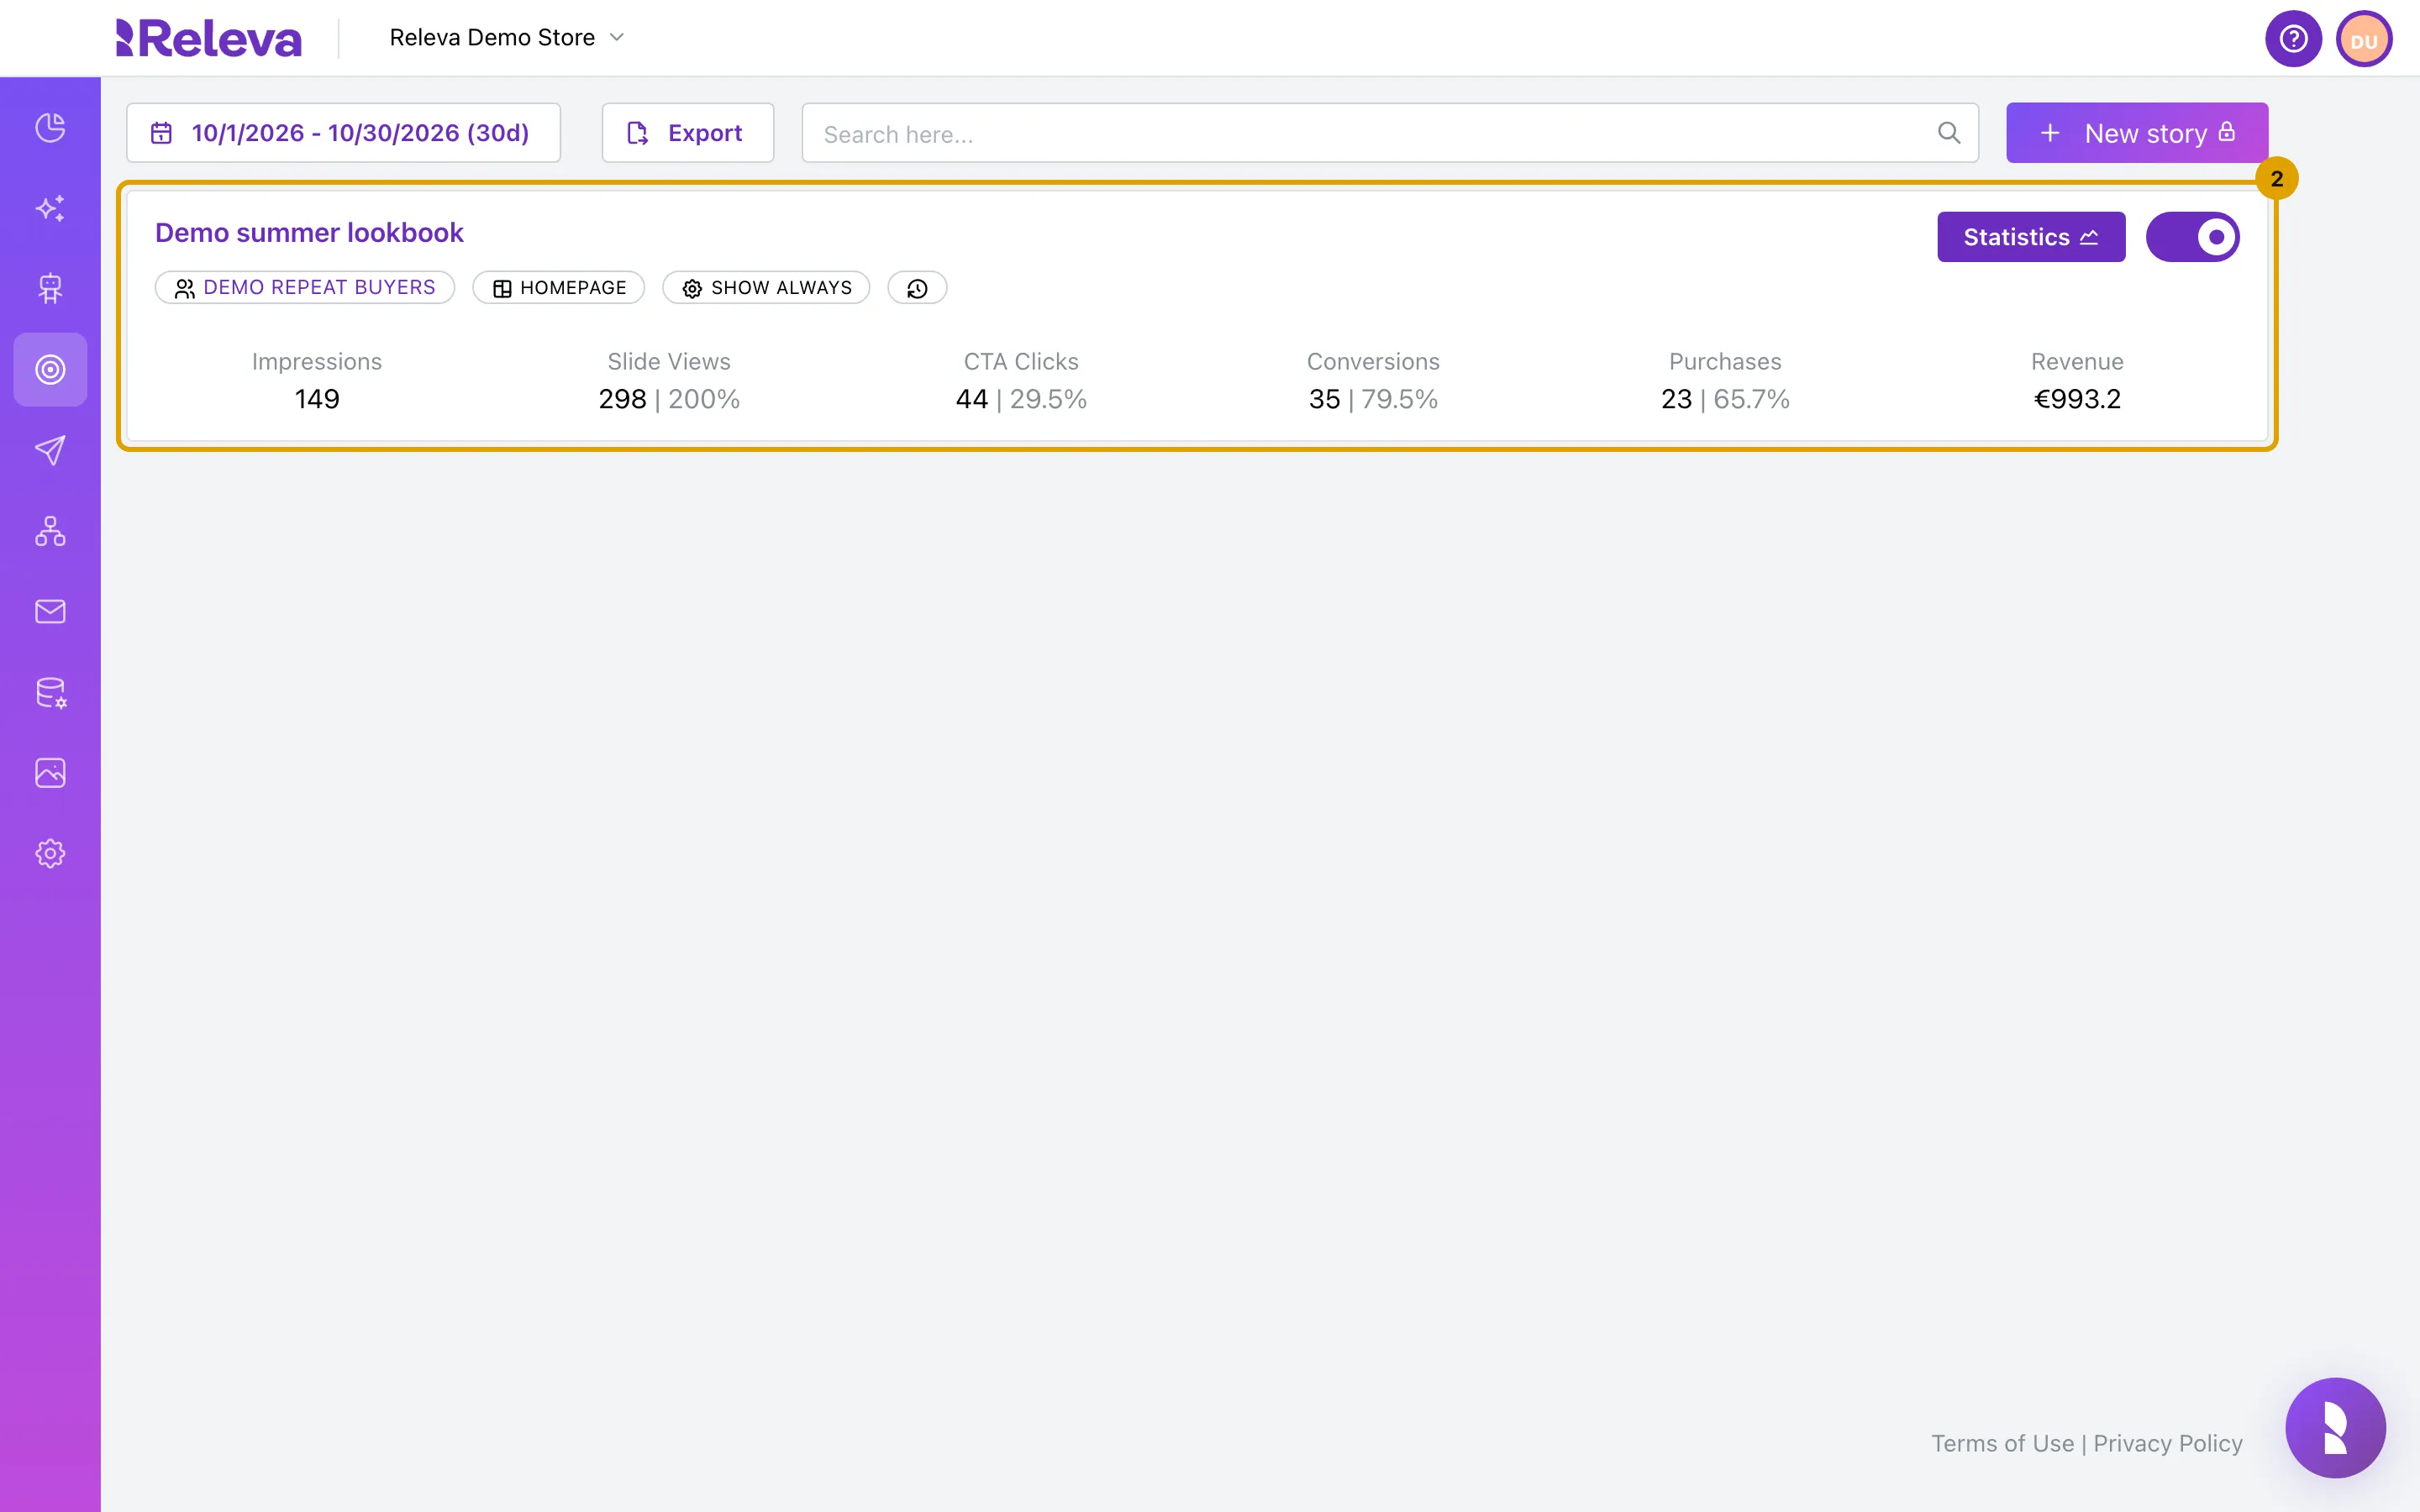
Each story has a card with its segment, page and display type, and its numbers for the period at the top of the list (the last 30 days by default)
What each number means:
- Impressions: how many times the story was opened.
- Slide Views: how many slides were viewed. One opening can show several slides.
- CTA Clicks: clicks on a slide’s link.
- Conversions: add-to-cart events by visitors who clicked the story before.
- Purchases: orders by visitors who clicked the story before.
- Revenue: the value of those orders, in your store’s currency.
The grey percentage after a number is its share of the metric before it: Slide Views and CTA Clicks per impression, Conversions per click, Purchases per conversion. The card counts events, so Slide Views can be above 100% when visitors watch several slides. Use the date button to change the period and the search box to filter stories by the start of their name.
-
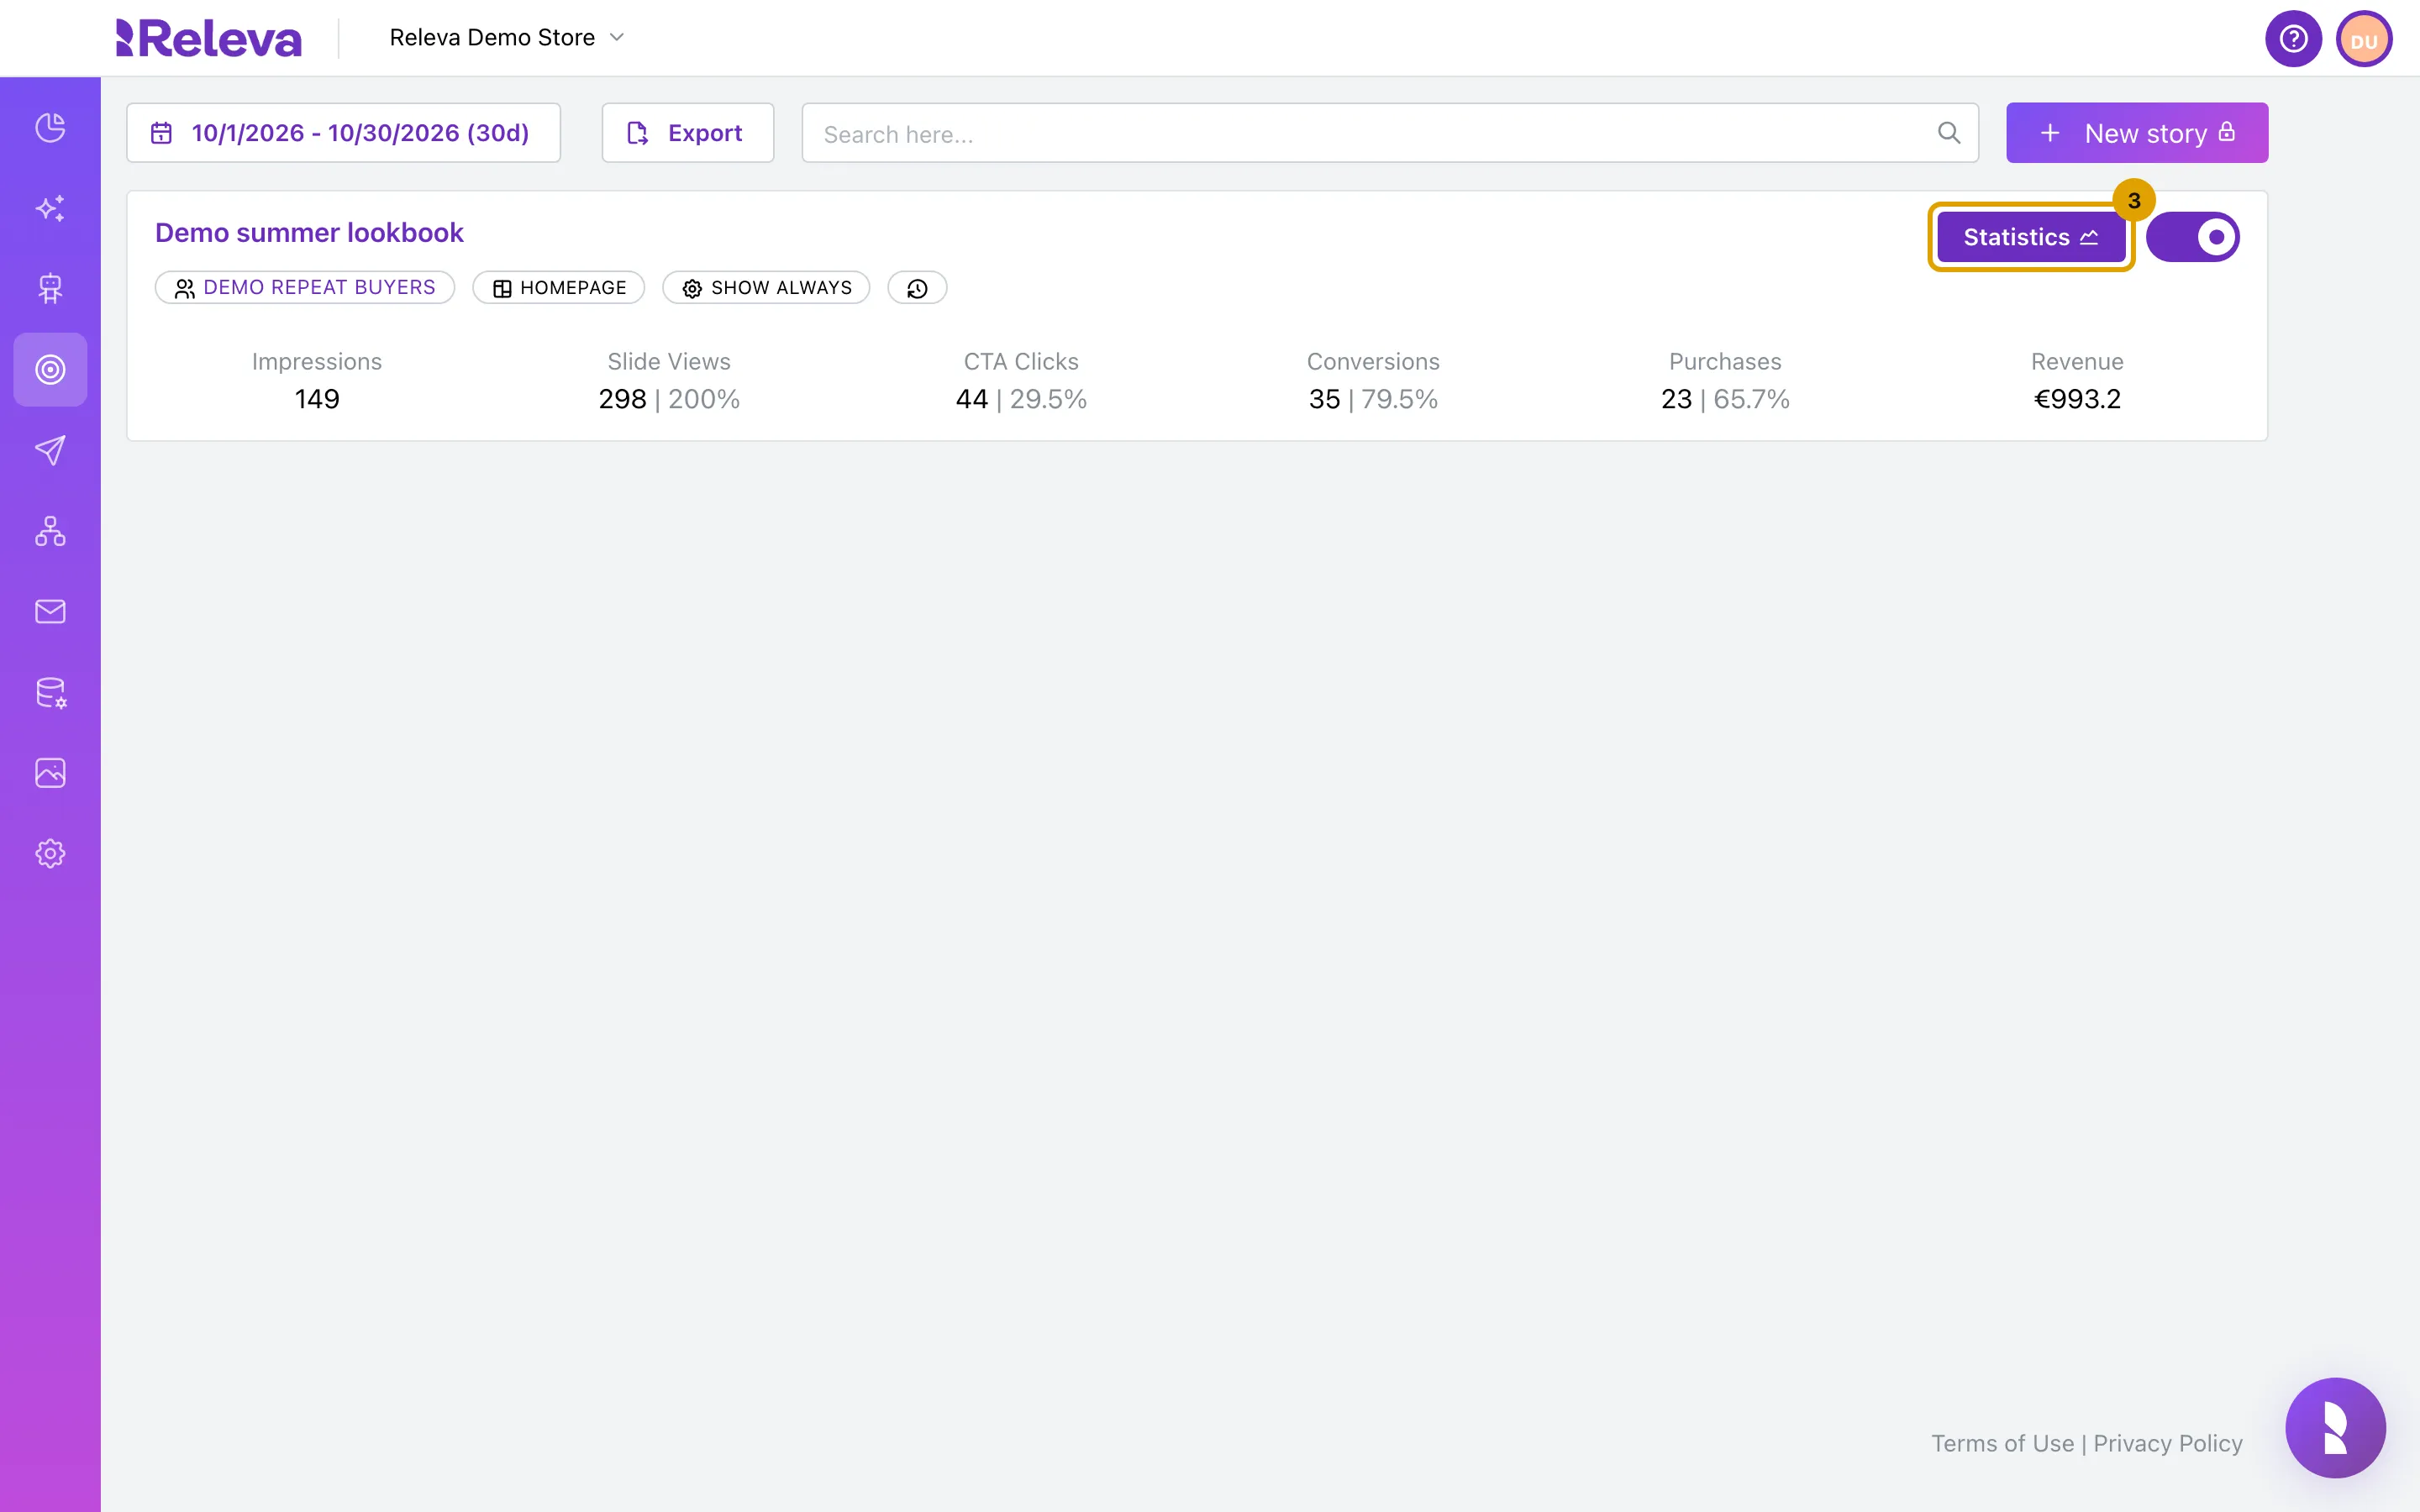
On the story’s card, select Statistics
-
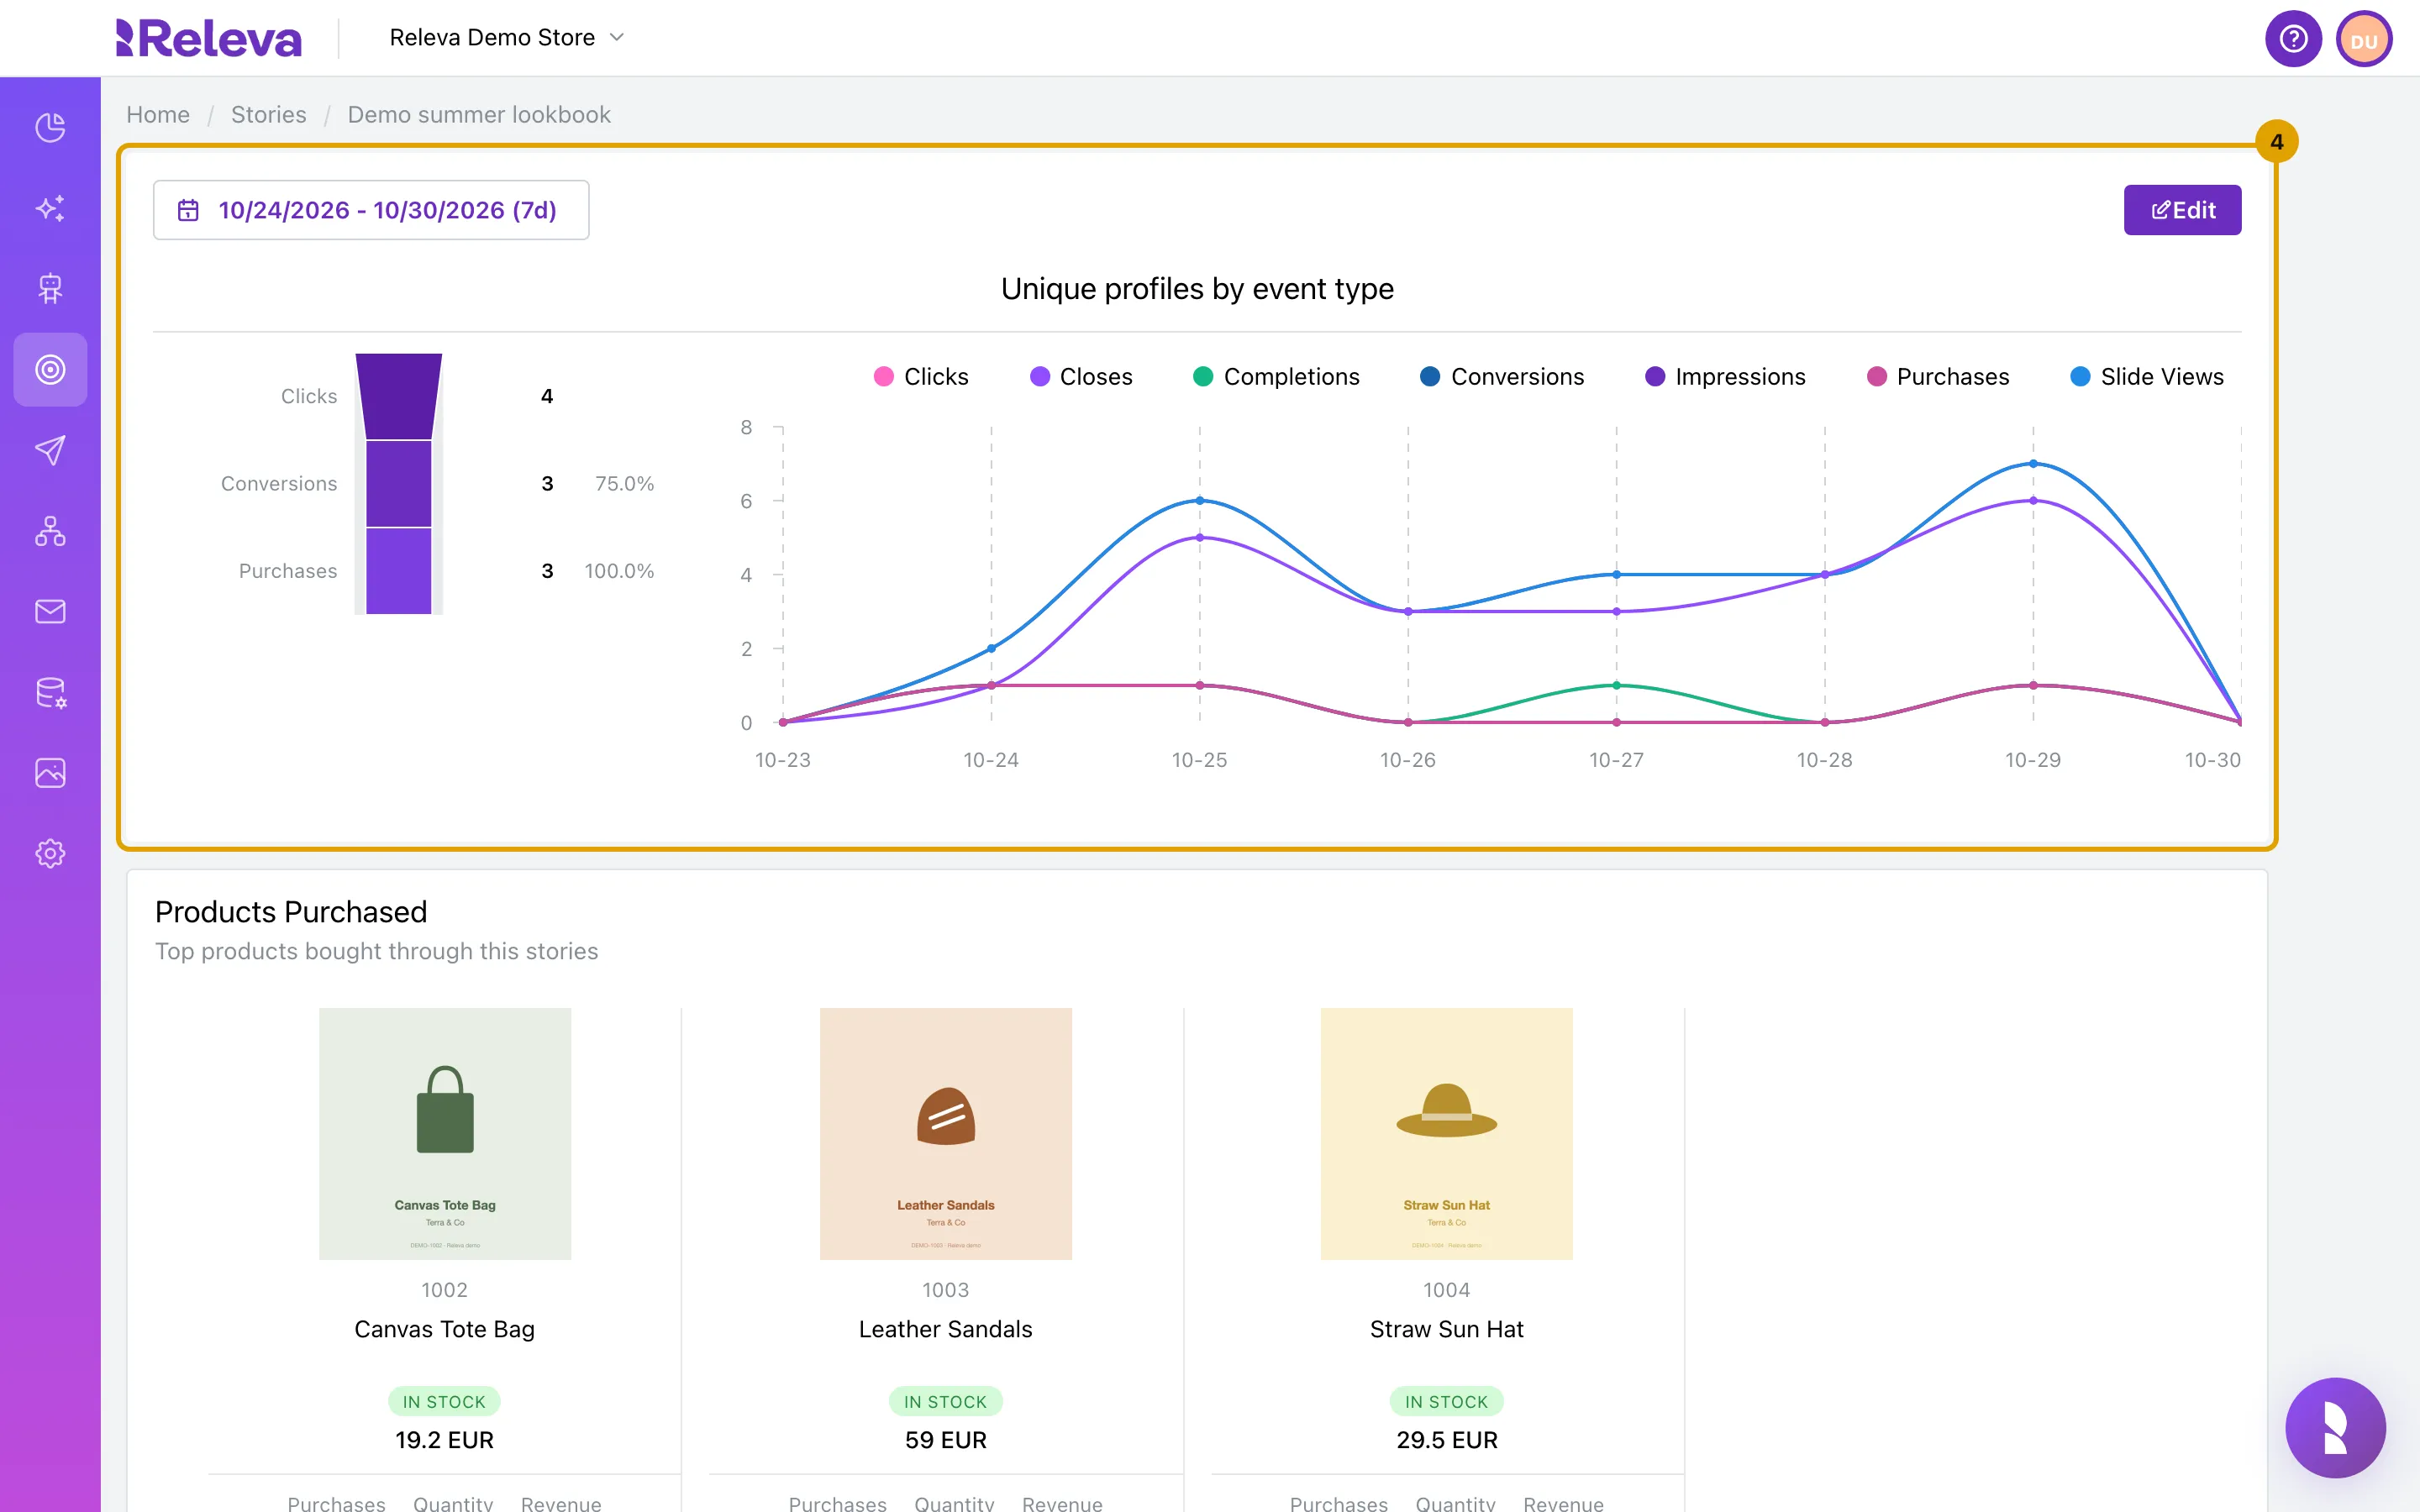
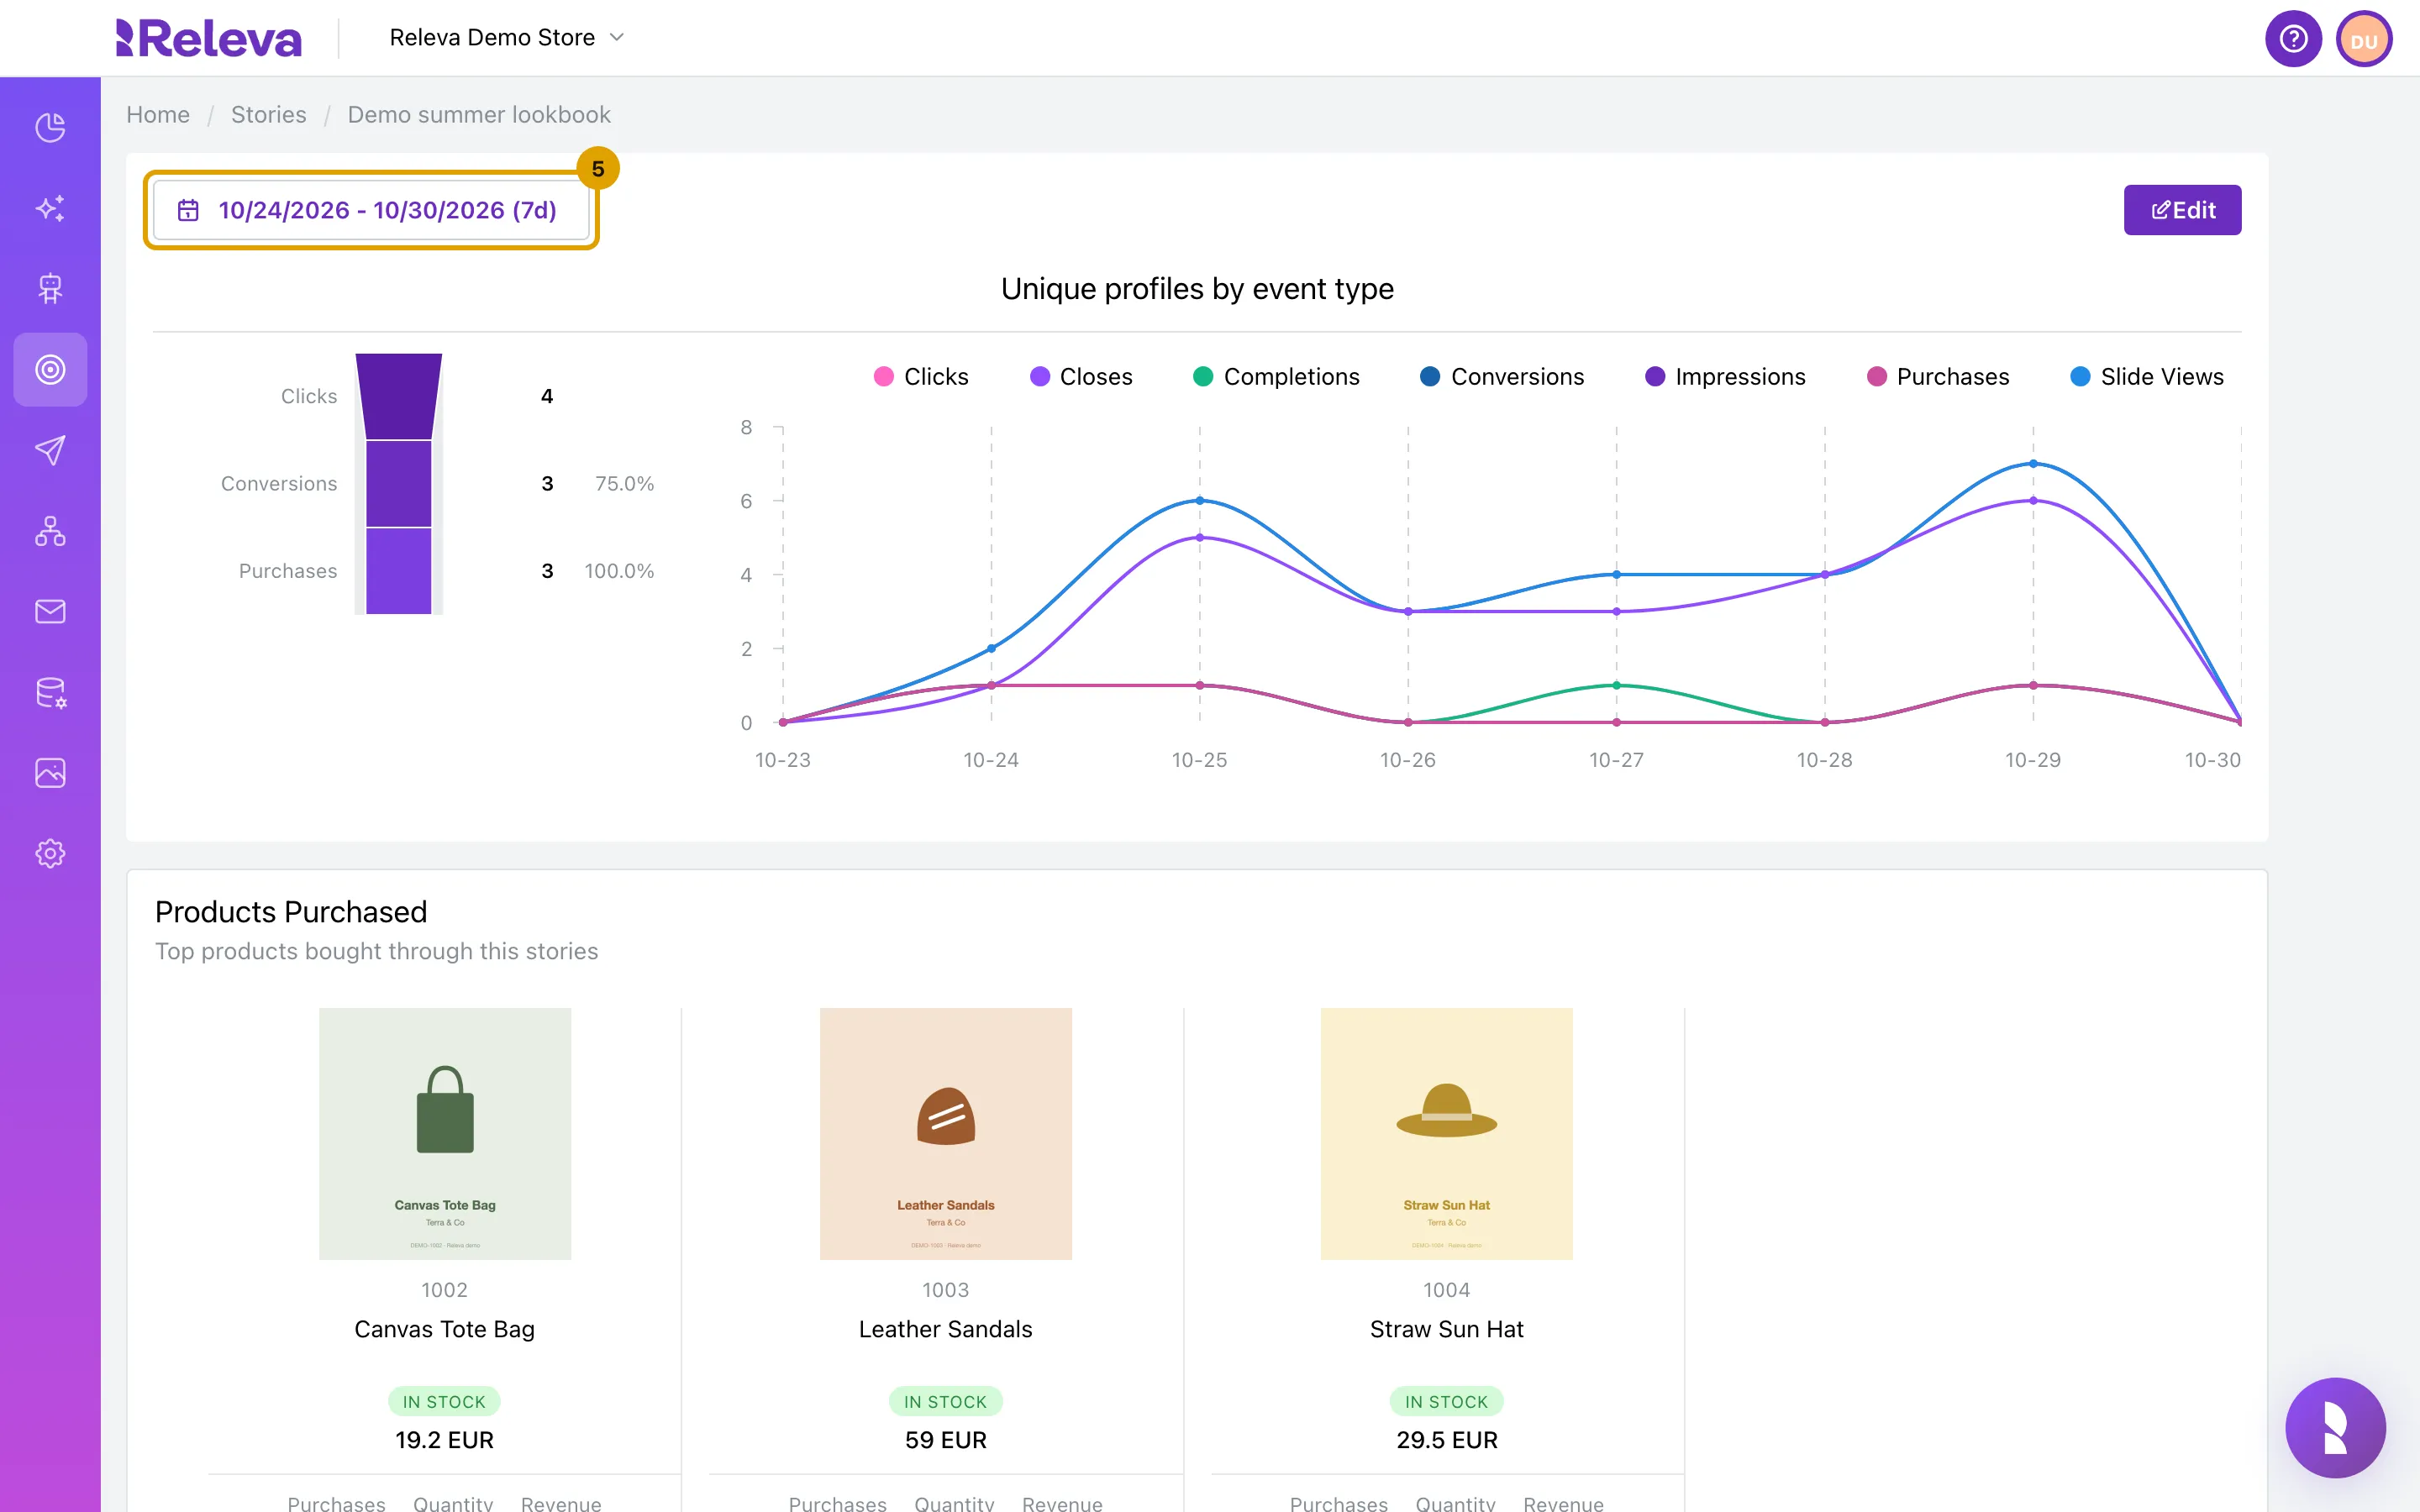
The Unique profiles by event type chart shows the last 7 days, with one line for each event type
- Impressions: people who opened the story.
- Slide Views: people who viewed slides.
- Clicks: people who clicked a slide’s link.
- Completions: people who reached the story’s last slide.
- Closes: people who closed the story.
- Conversions and Purchases: people who added to cart or ordered after clicking the story.
This page counts unique profiles per day, not events, so its numbers are lower than the card’s. Point at a day to see its values. The funnel to the left of the chart shows Clicks, Conversions and Purchases, each with its share of the step before.
-
Select the date range to change the period (the last 7 days by default)
-
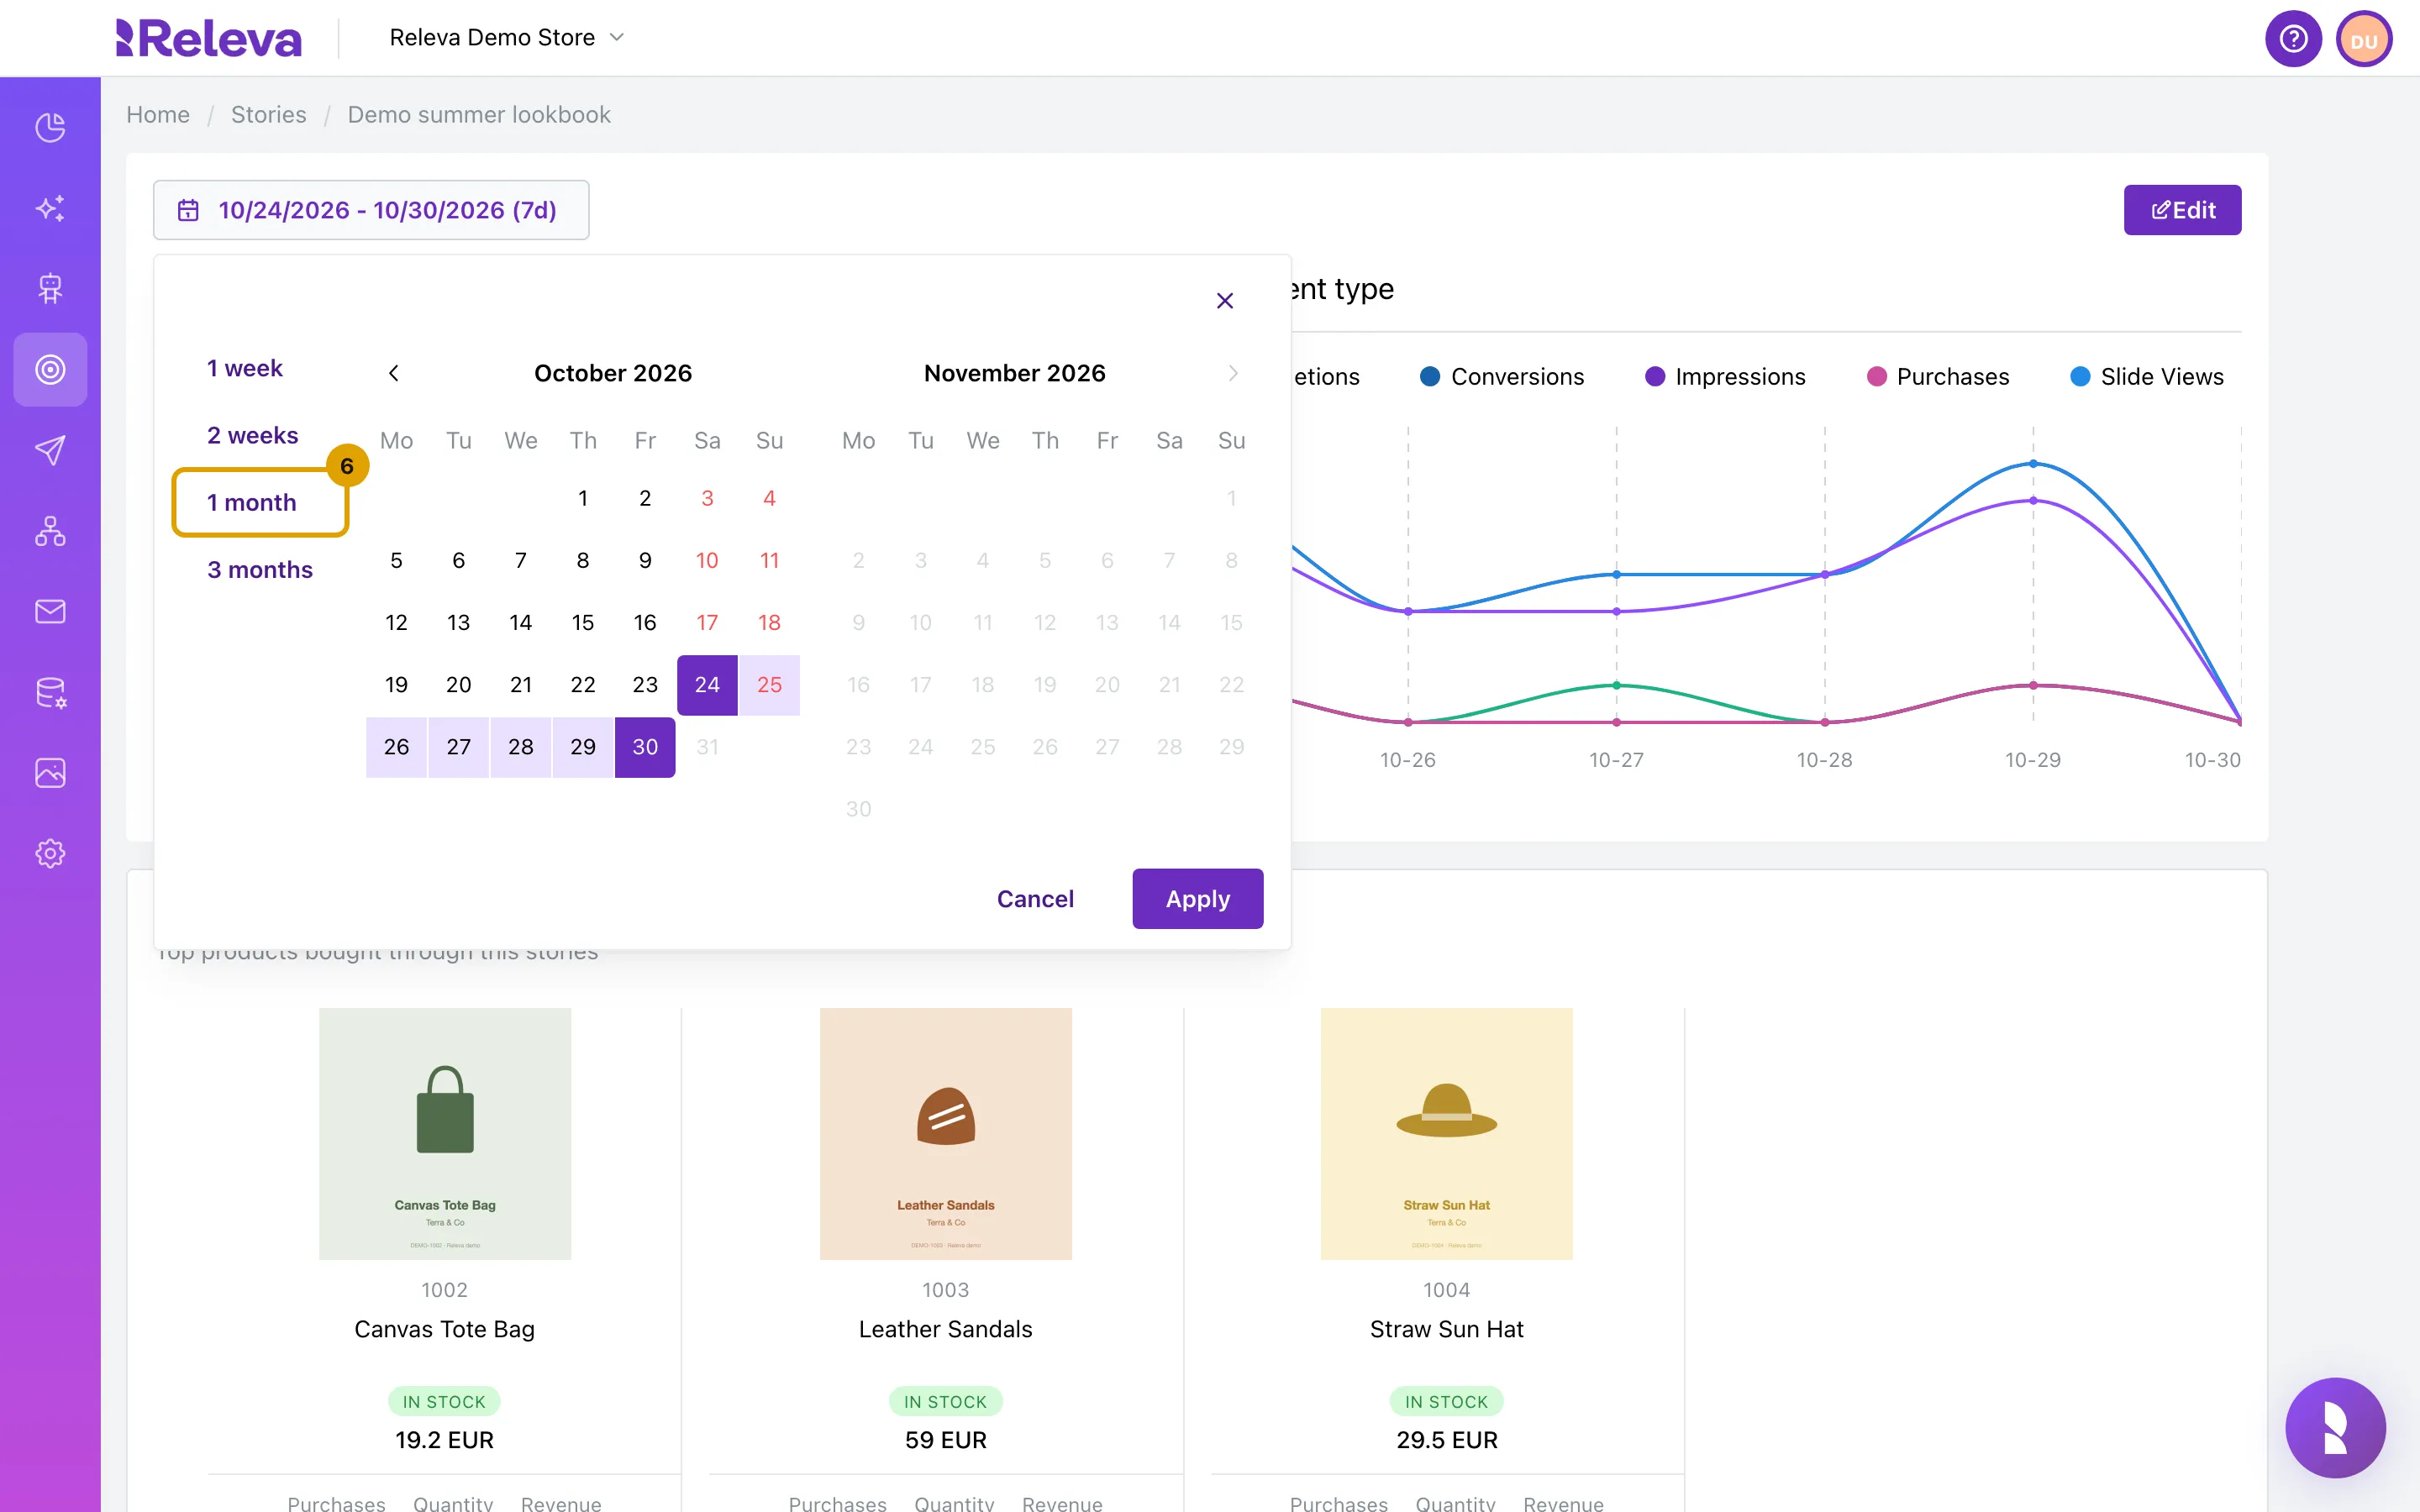
Pick a preset such as 1 month, or select a start and end day in the calendar and select Apply
Presets apply at once. The presets are 1 week, 2 weeks, 1 month and 3 months.
-
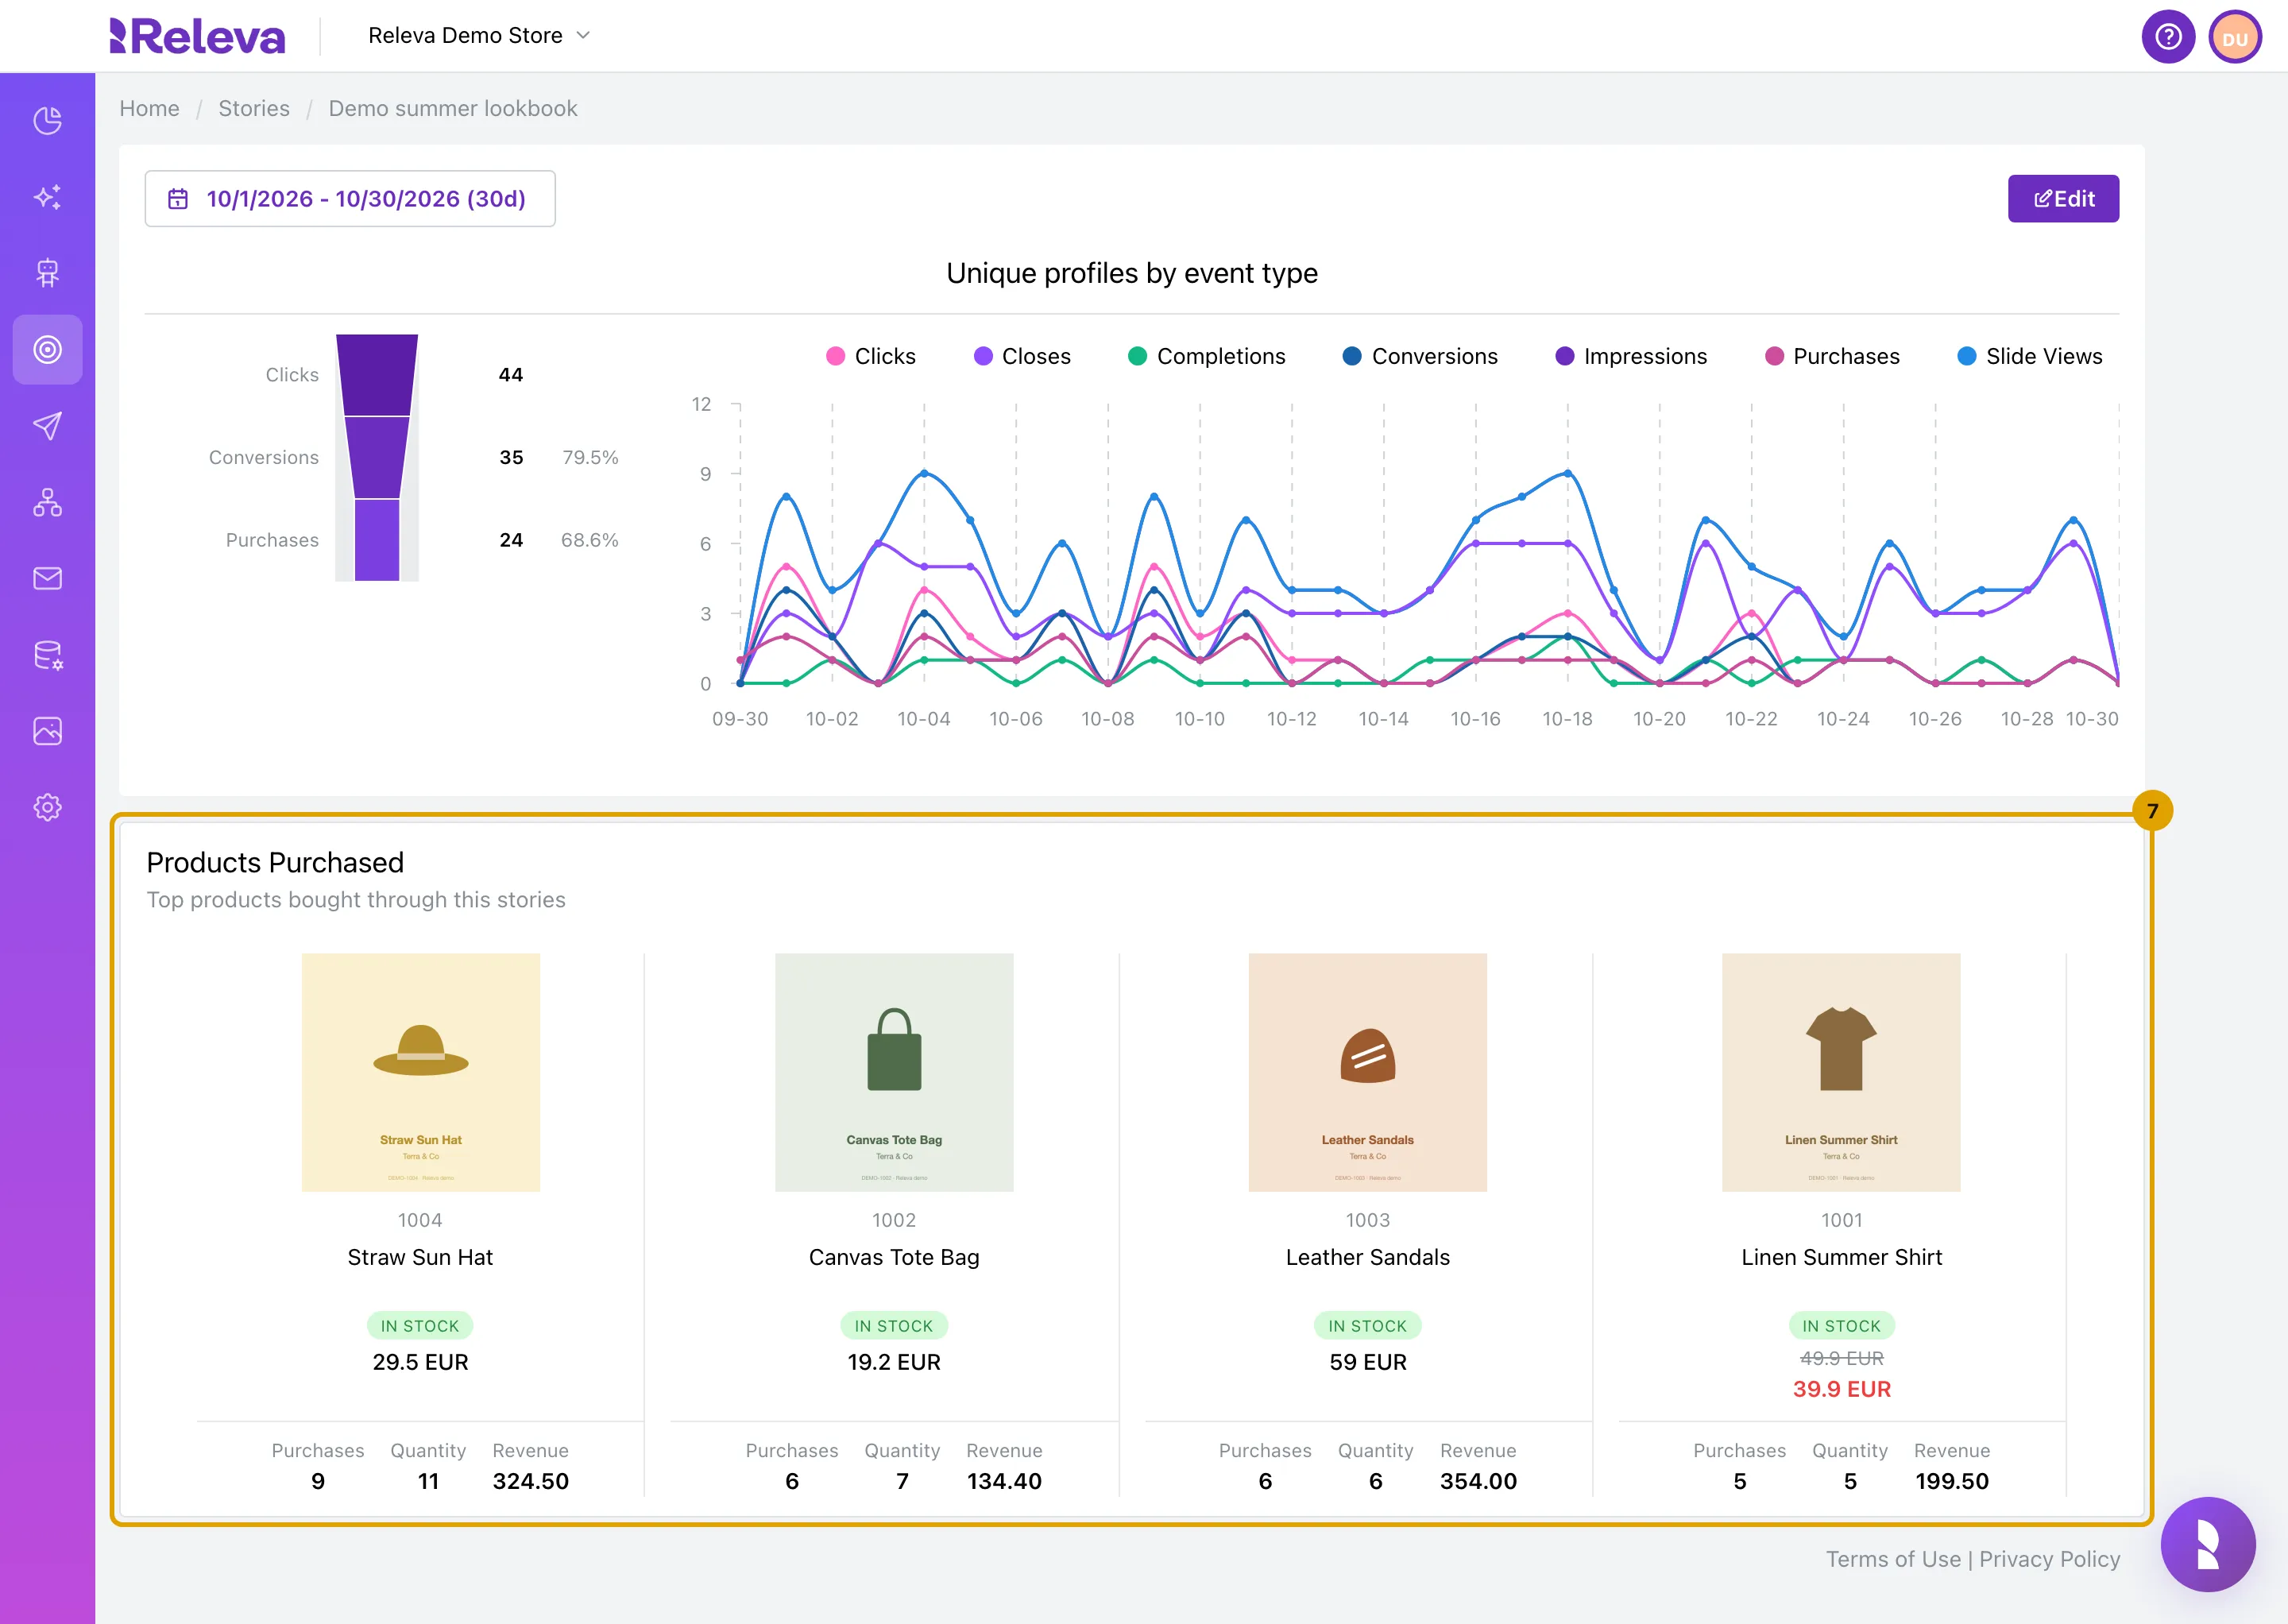
Under Products Purchased, see the products bought after a story click
The section lists up to 20 products, most buyers first. For each product you see Purchases (the number of buyers), Quantity and Revenue. It appears only when at least one order in the period is attributed to the story.
-
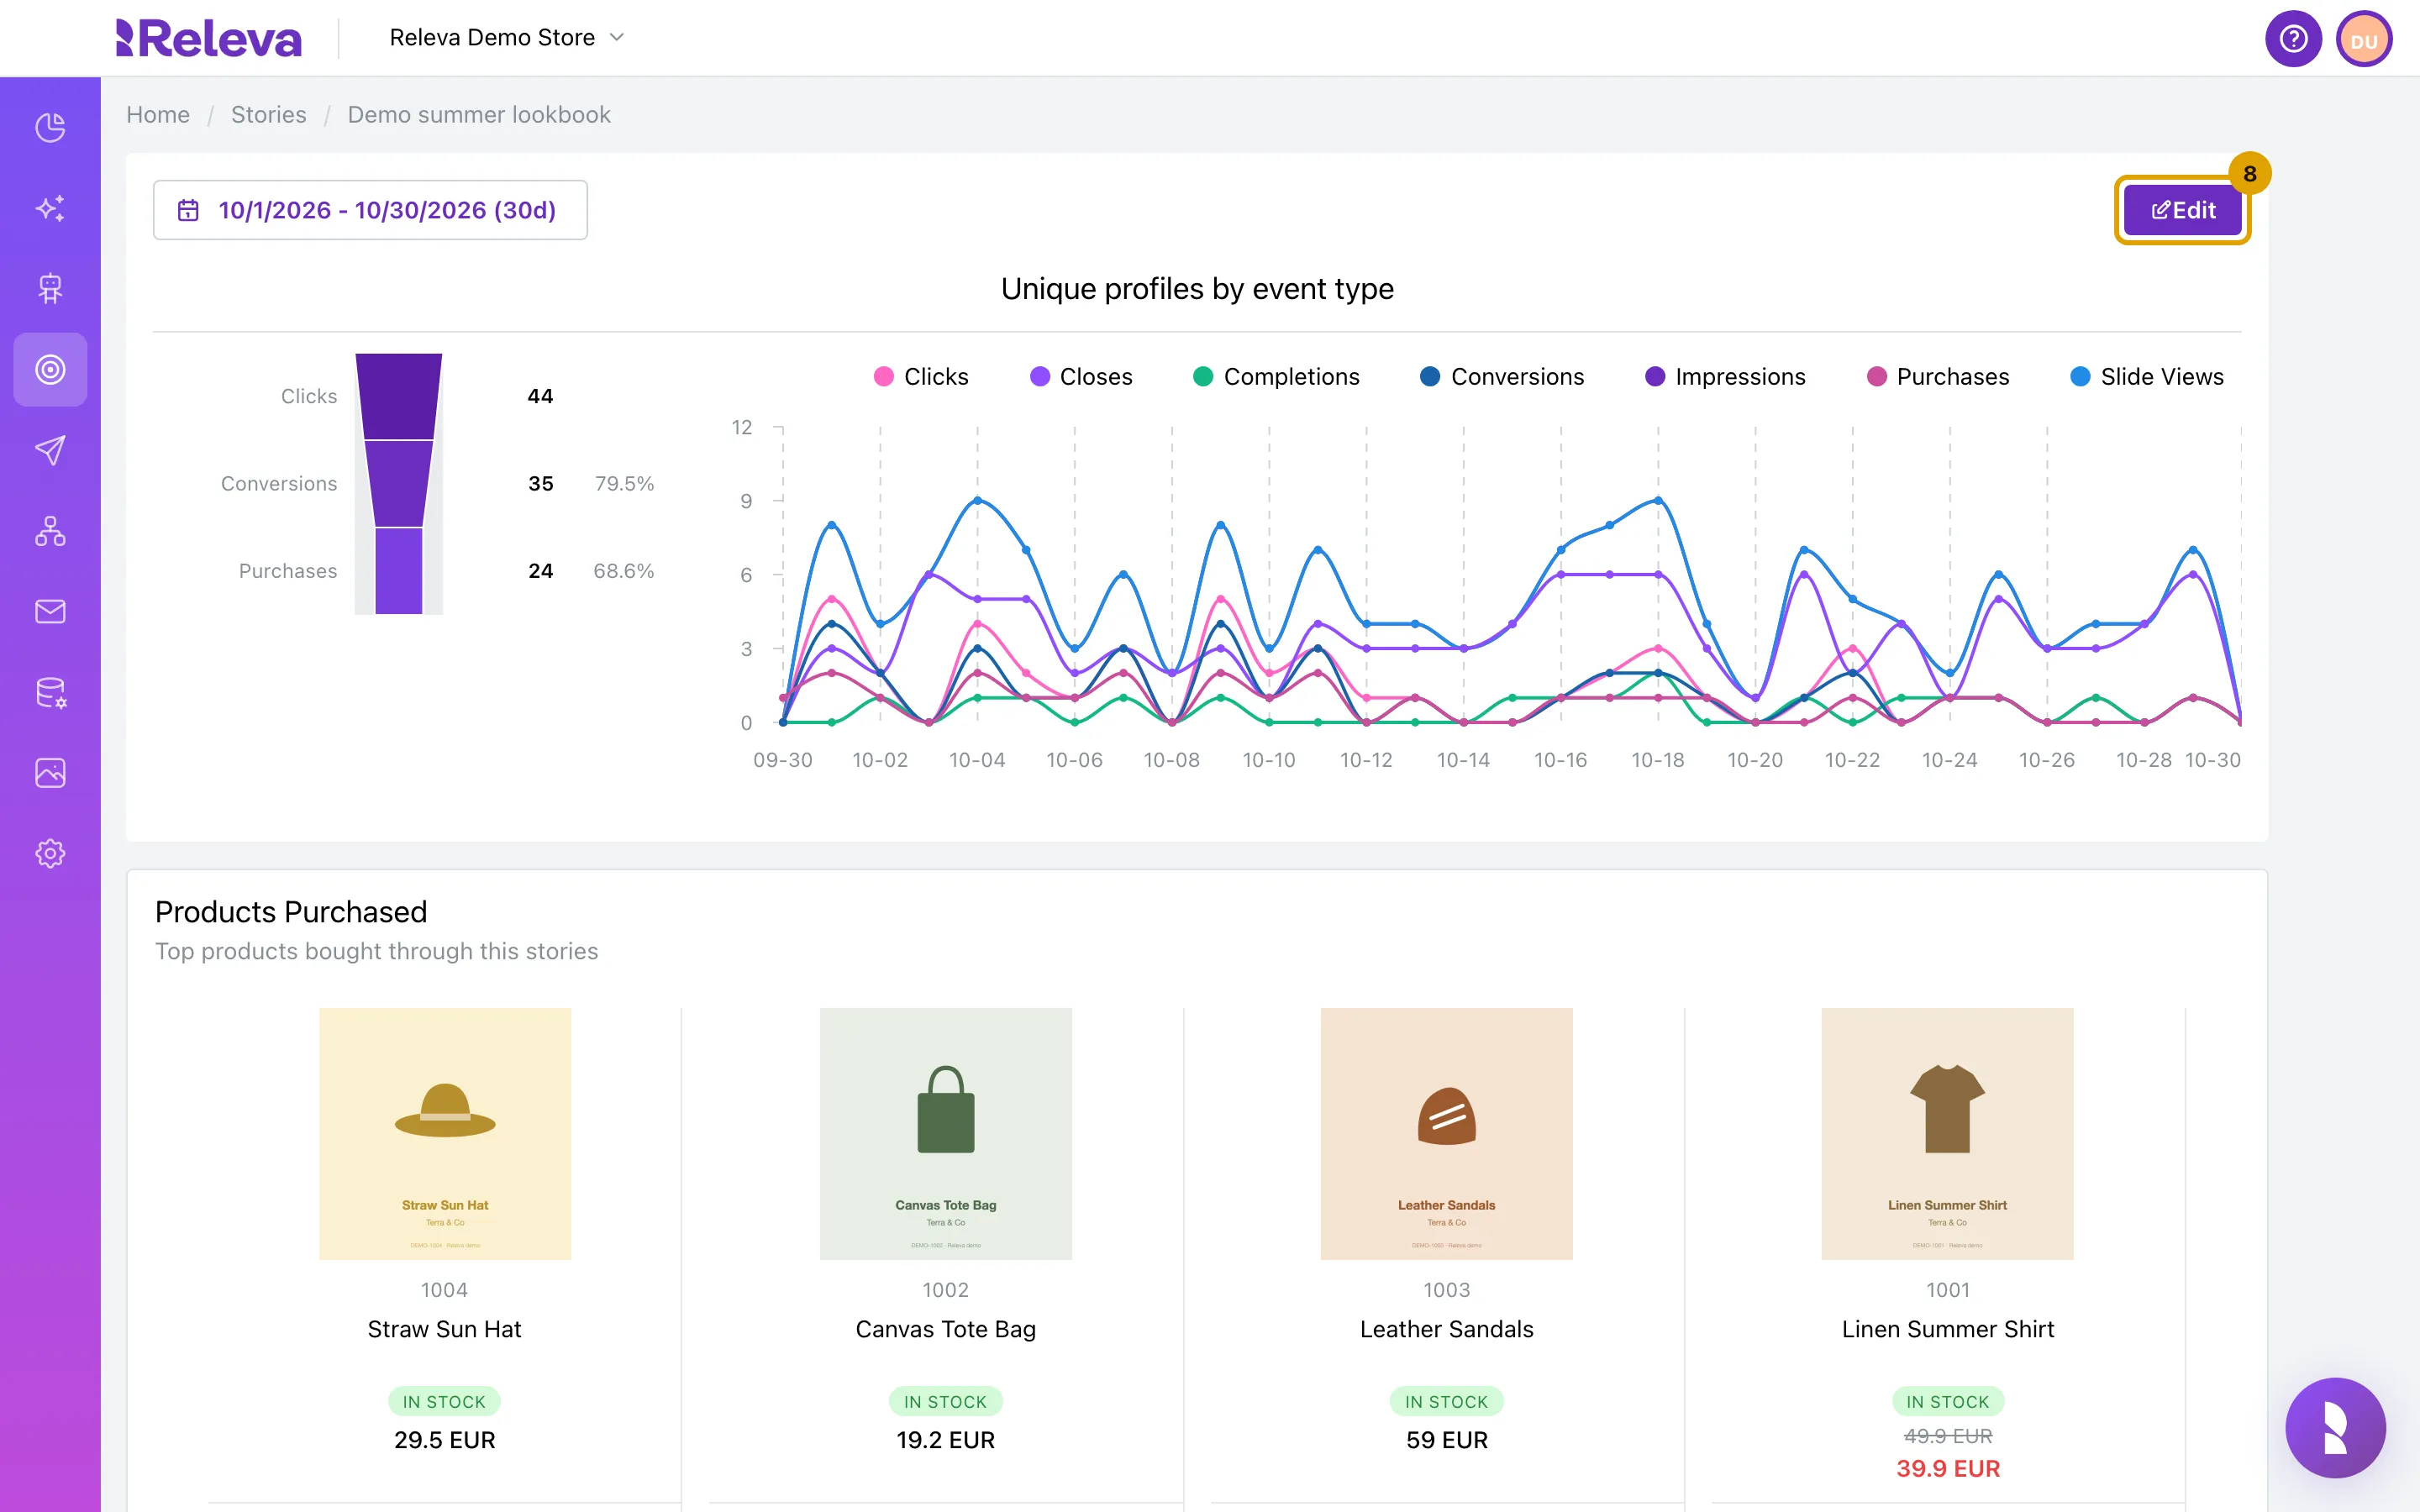
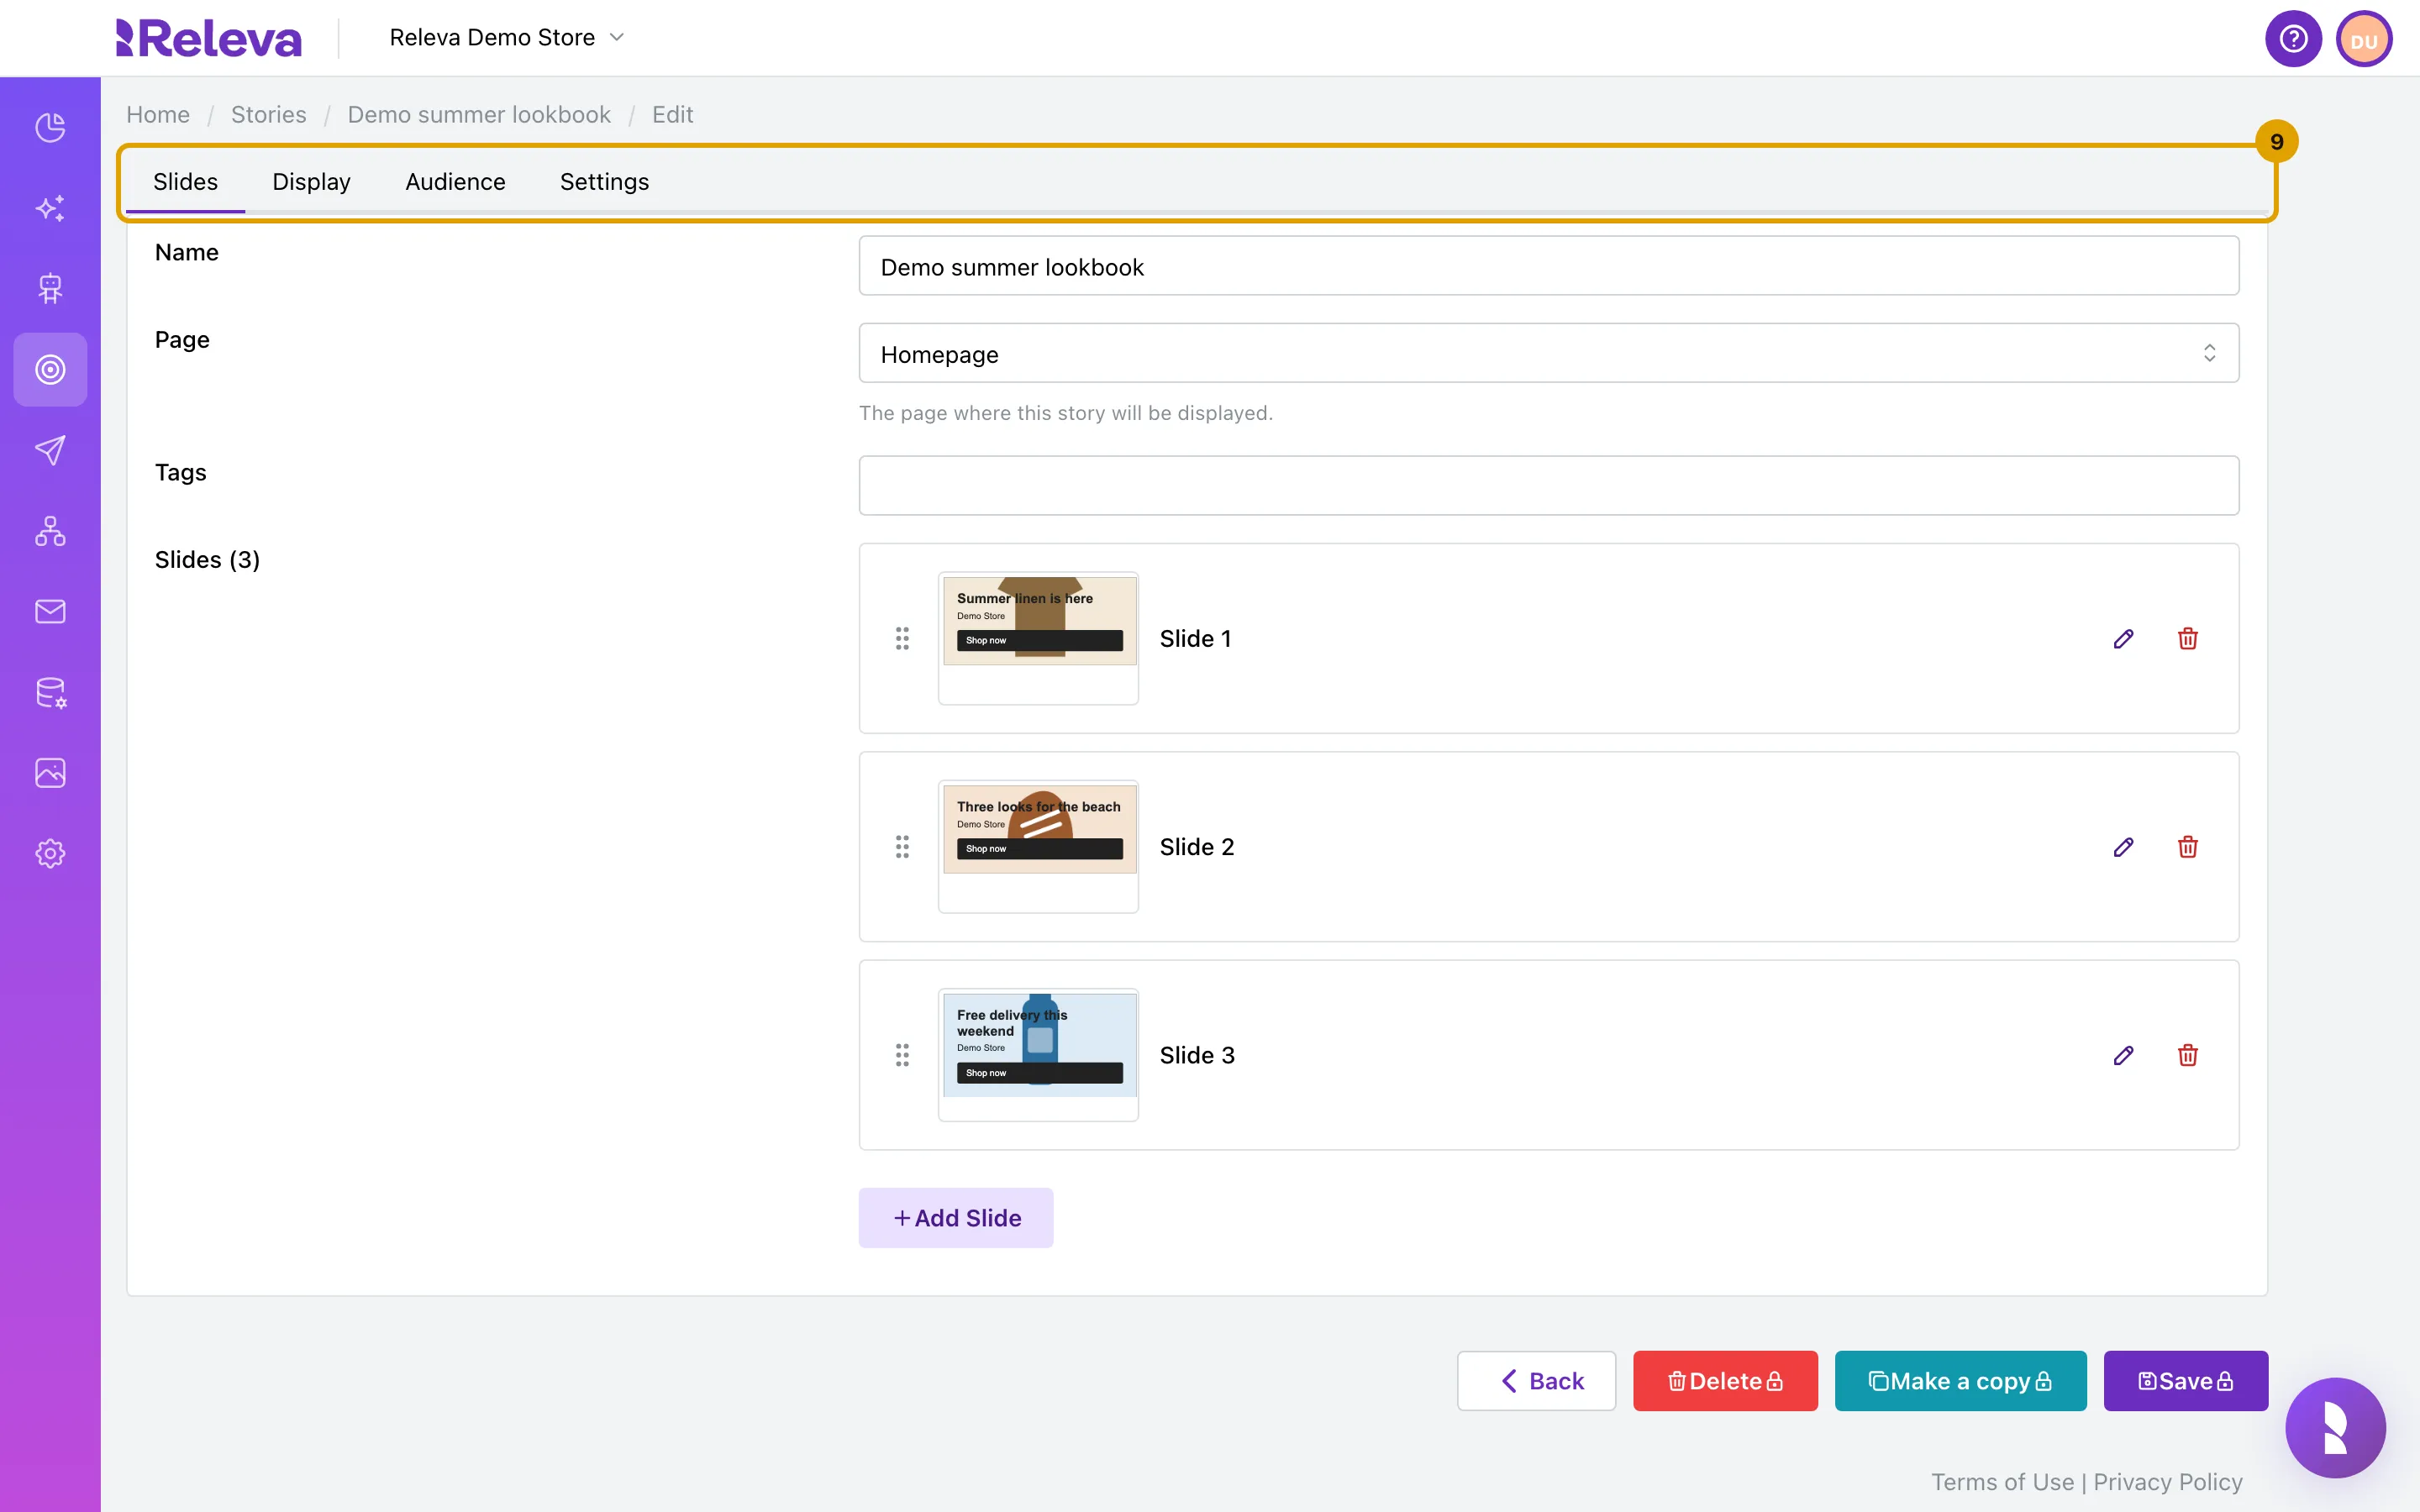
To change the story’s slides, display rules, audience or settings, select Edit
-
The story opens on the Slides tab. Use the Display, Audience and Settings tabs for the rest, and select Save when you are done
On an existing story every tab also has Delete and Make a copy. Delete asks Are you sure? and removes the story with its slides. Make a copy opens a new story named “Copy of …” with the same slides; nothing is saved until you select Save.
Check it worked
Section titled “Check it worked”- The card’s numbers for the period are not zero once the story has been shown and clicked.
- Changing the period updates the date button label, for example
10/1/2026 - 10/30/2026 (30d), and redraws the chart. - Products Purchased lists products once orders attributed to the story come in.
Troubleshooting
Section titled “Troubleshooting”No data available for the selected period. No story events arrived in that period. Widen the period, or check that the story is switched on and that the shop loads the Releva SDK on that page.
The card and the Statistics page disagree. The card sums events; the Statistics page counts unique profiles per day. Both are right. The card’s Slide Views share can exceed 100% for the same reason.
Conversions and Purchases are empty. They need a click: only cart adds and orders by a visitor who clicked a slide link before are attributed to the story. Impressions and slide views alone do not attribute later orders, and cart adds or orders that reach Releva more than 7 days after they happened are not attributed. Check that your shop sends cart and order events.
Products Purchased is missing. No order in the period is attributed to the story. Widen the period, for example to 1 month.
There was an error loading the resource: An internal error occurred. The story id in the address does not exist, for example after the story was deleted. Go back to the list and open the card again.