

Check and stop an A/B test
The details page of an A/B test compares the control group (no Releva) with the treatment group (with Releva) on page views, product views, revenue, time on page and scroll depth. This guide reads those results, stops the test and shows how to delete it. For how each number is computed, read How A/B tests work.
Before you start
Section titled “Before you start”- A test is running. If Running A/B tests shows No active A/B test, start one first: see Start an A/B test.
- Give it time. The results leave out the first and the last day of the test, so nothing shows before the third day, and a running test never includes today. Significance needs traffic in both groups; a small shop may need weeks.
- Stopping is final. A stopped test cannot be restarted; you can only delete it or start a new one.
-
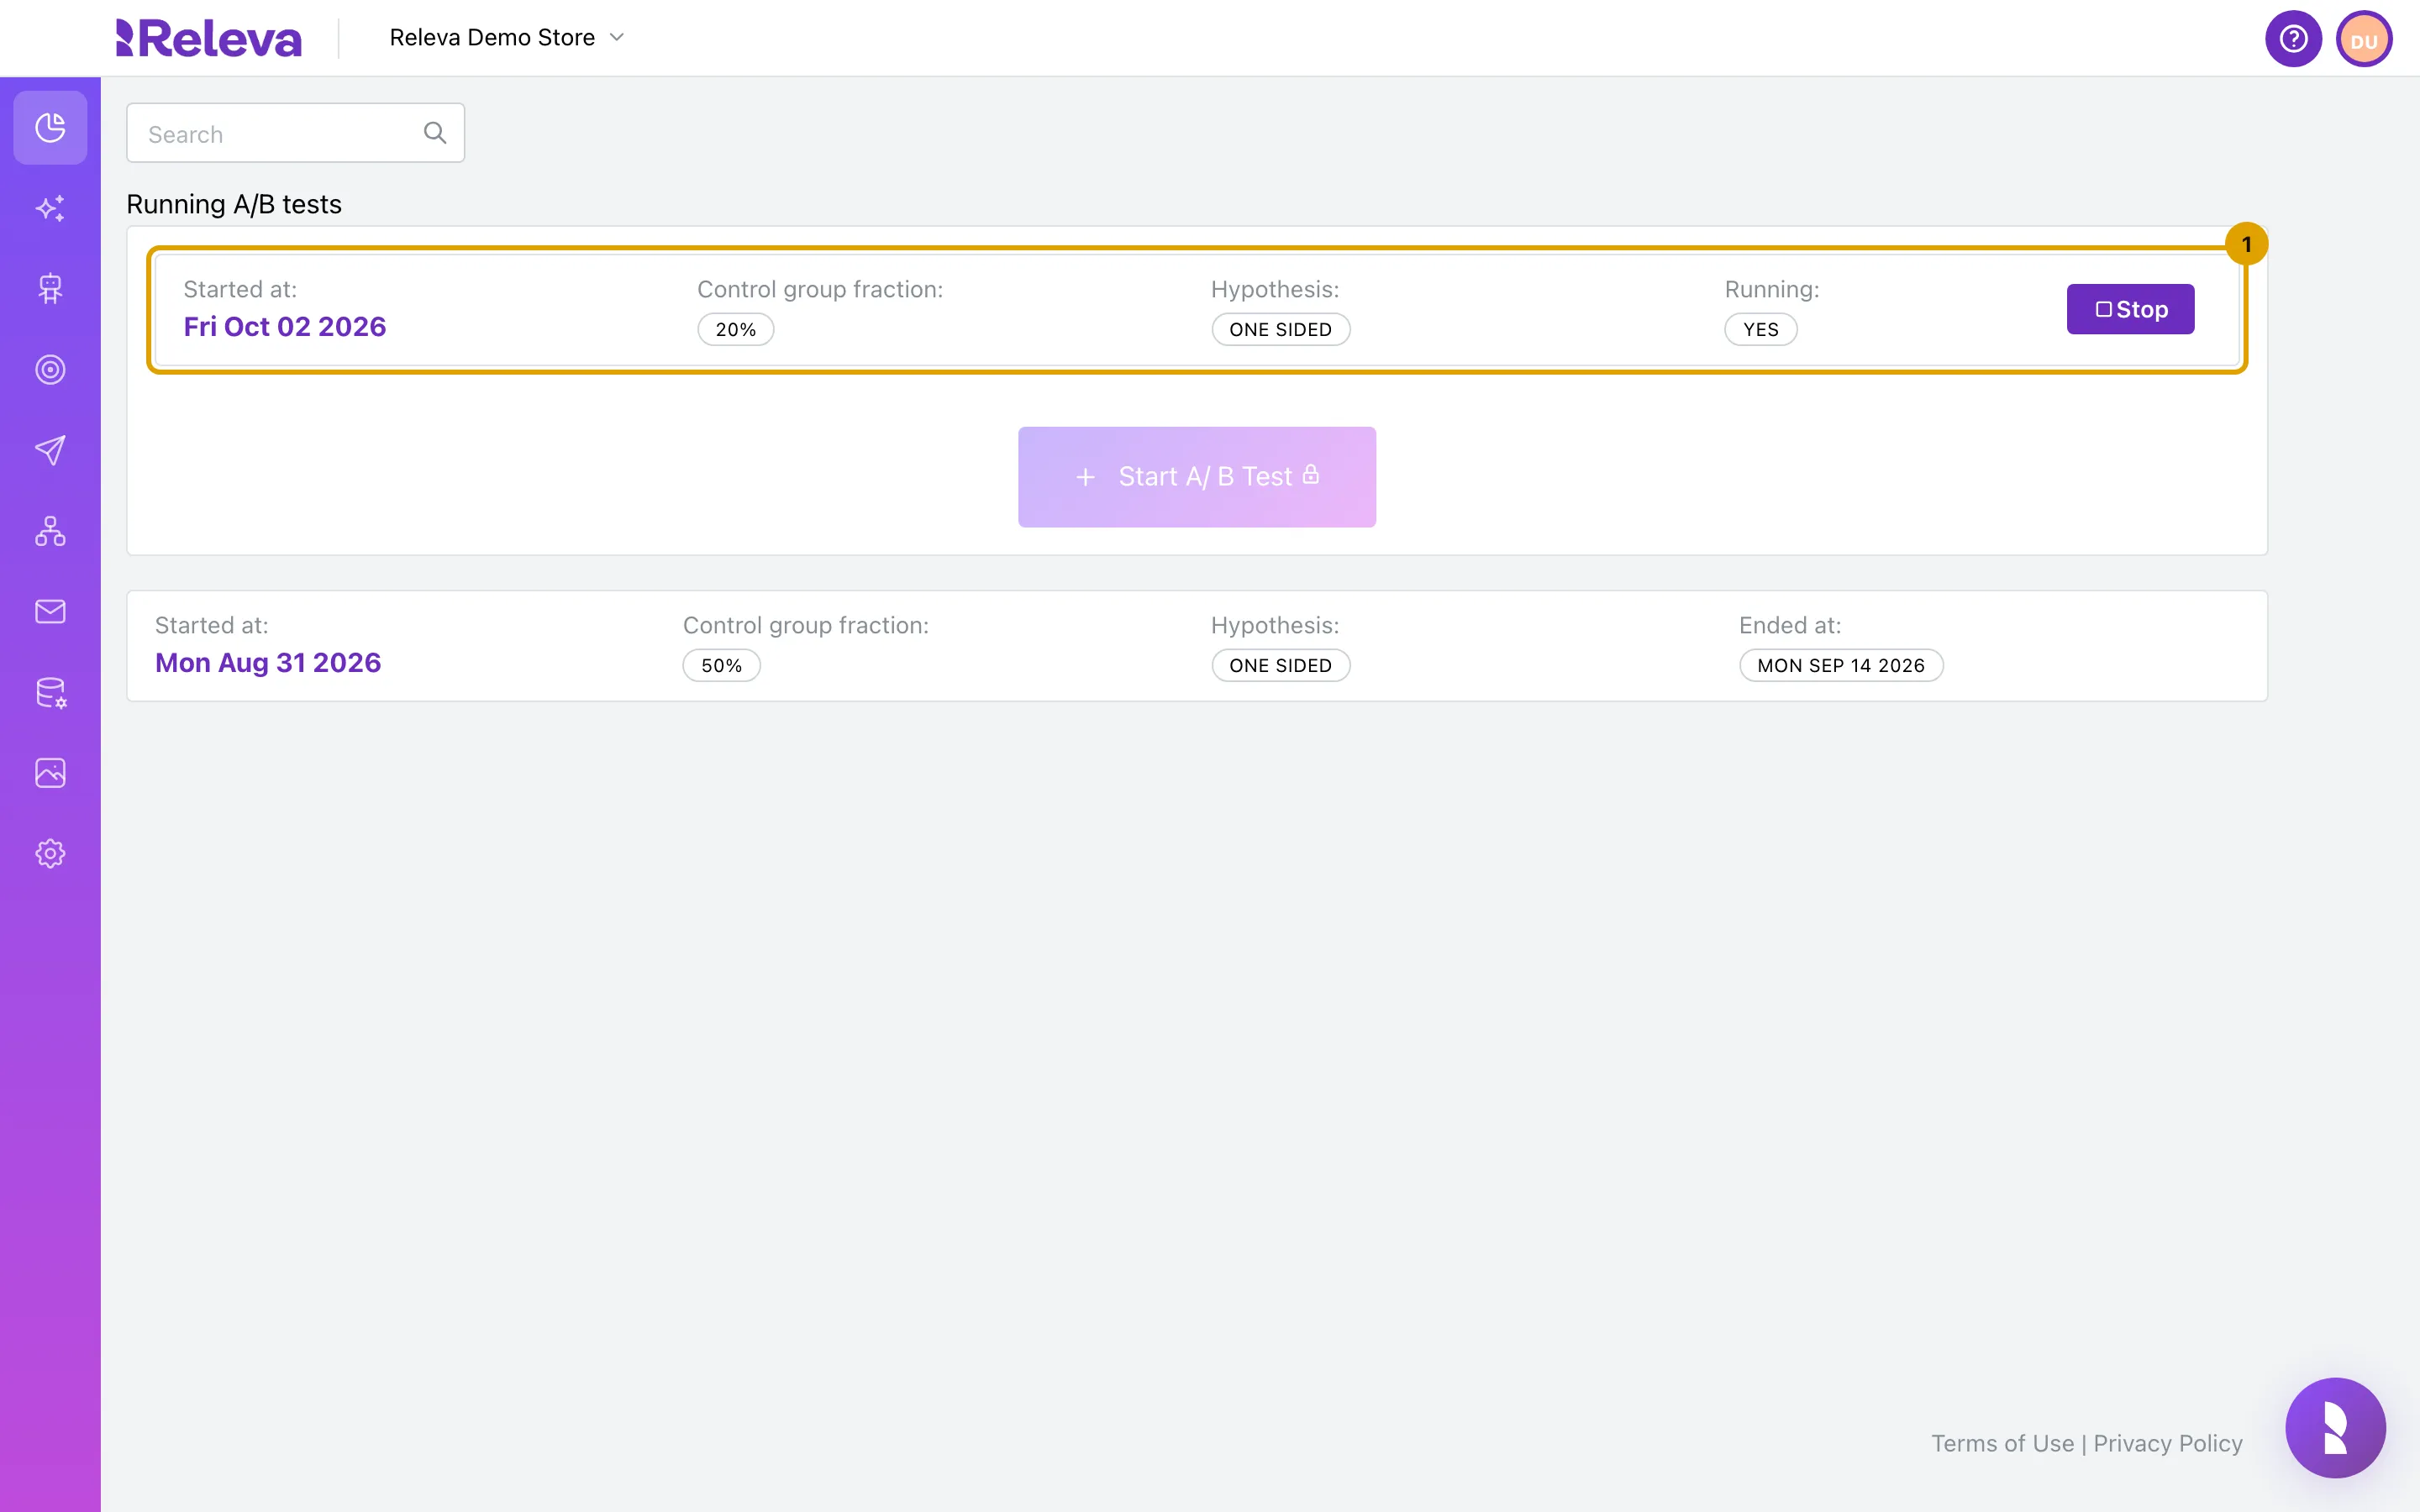
Go to Analytics › A/B Tests. The test that runs now is under Running A/B tests.
The card shows when the test started, its Control group fraction, its Hypothesis and Running: Yes. You can stop the test right here with Stop on the card; the same confirmation opens as in step 7.
-
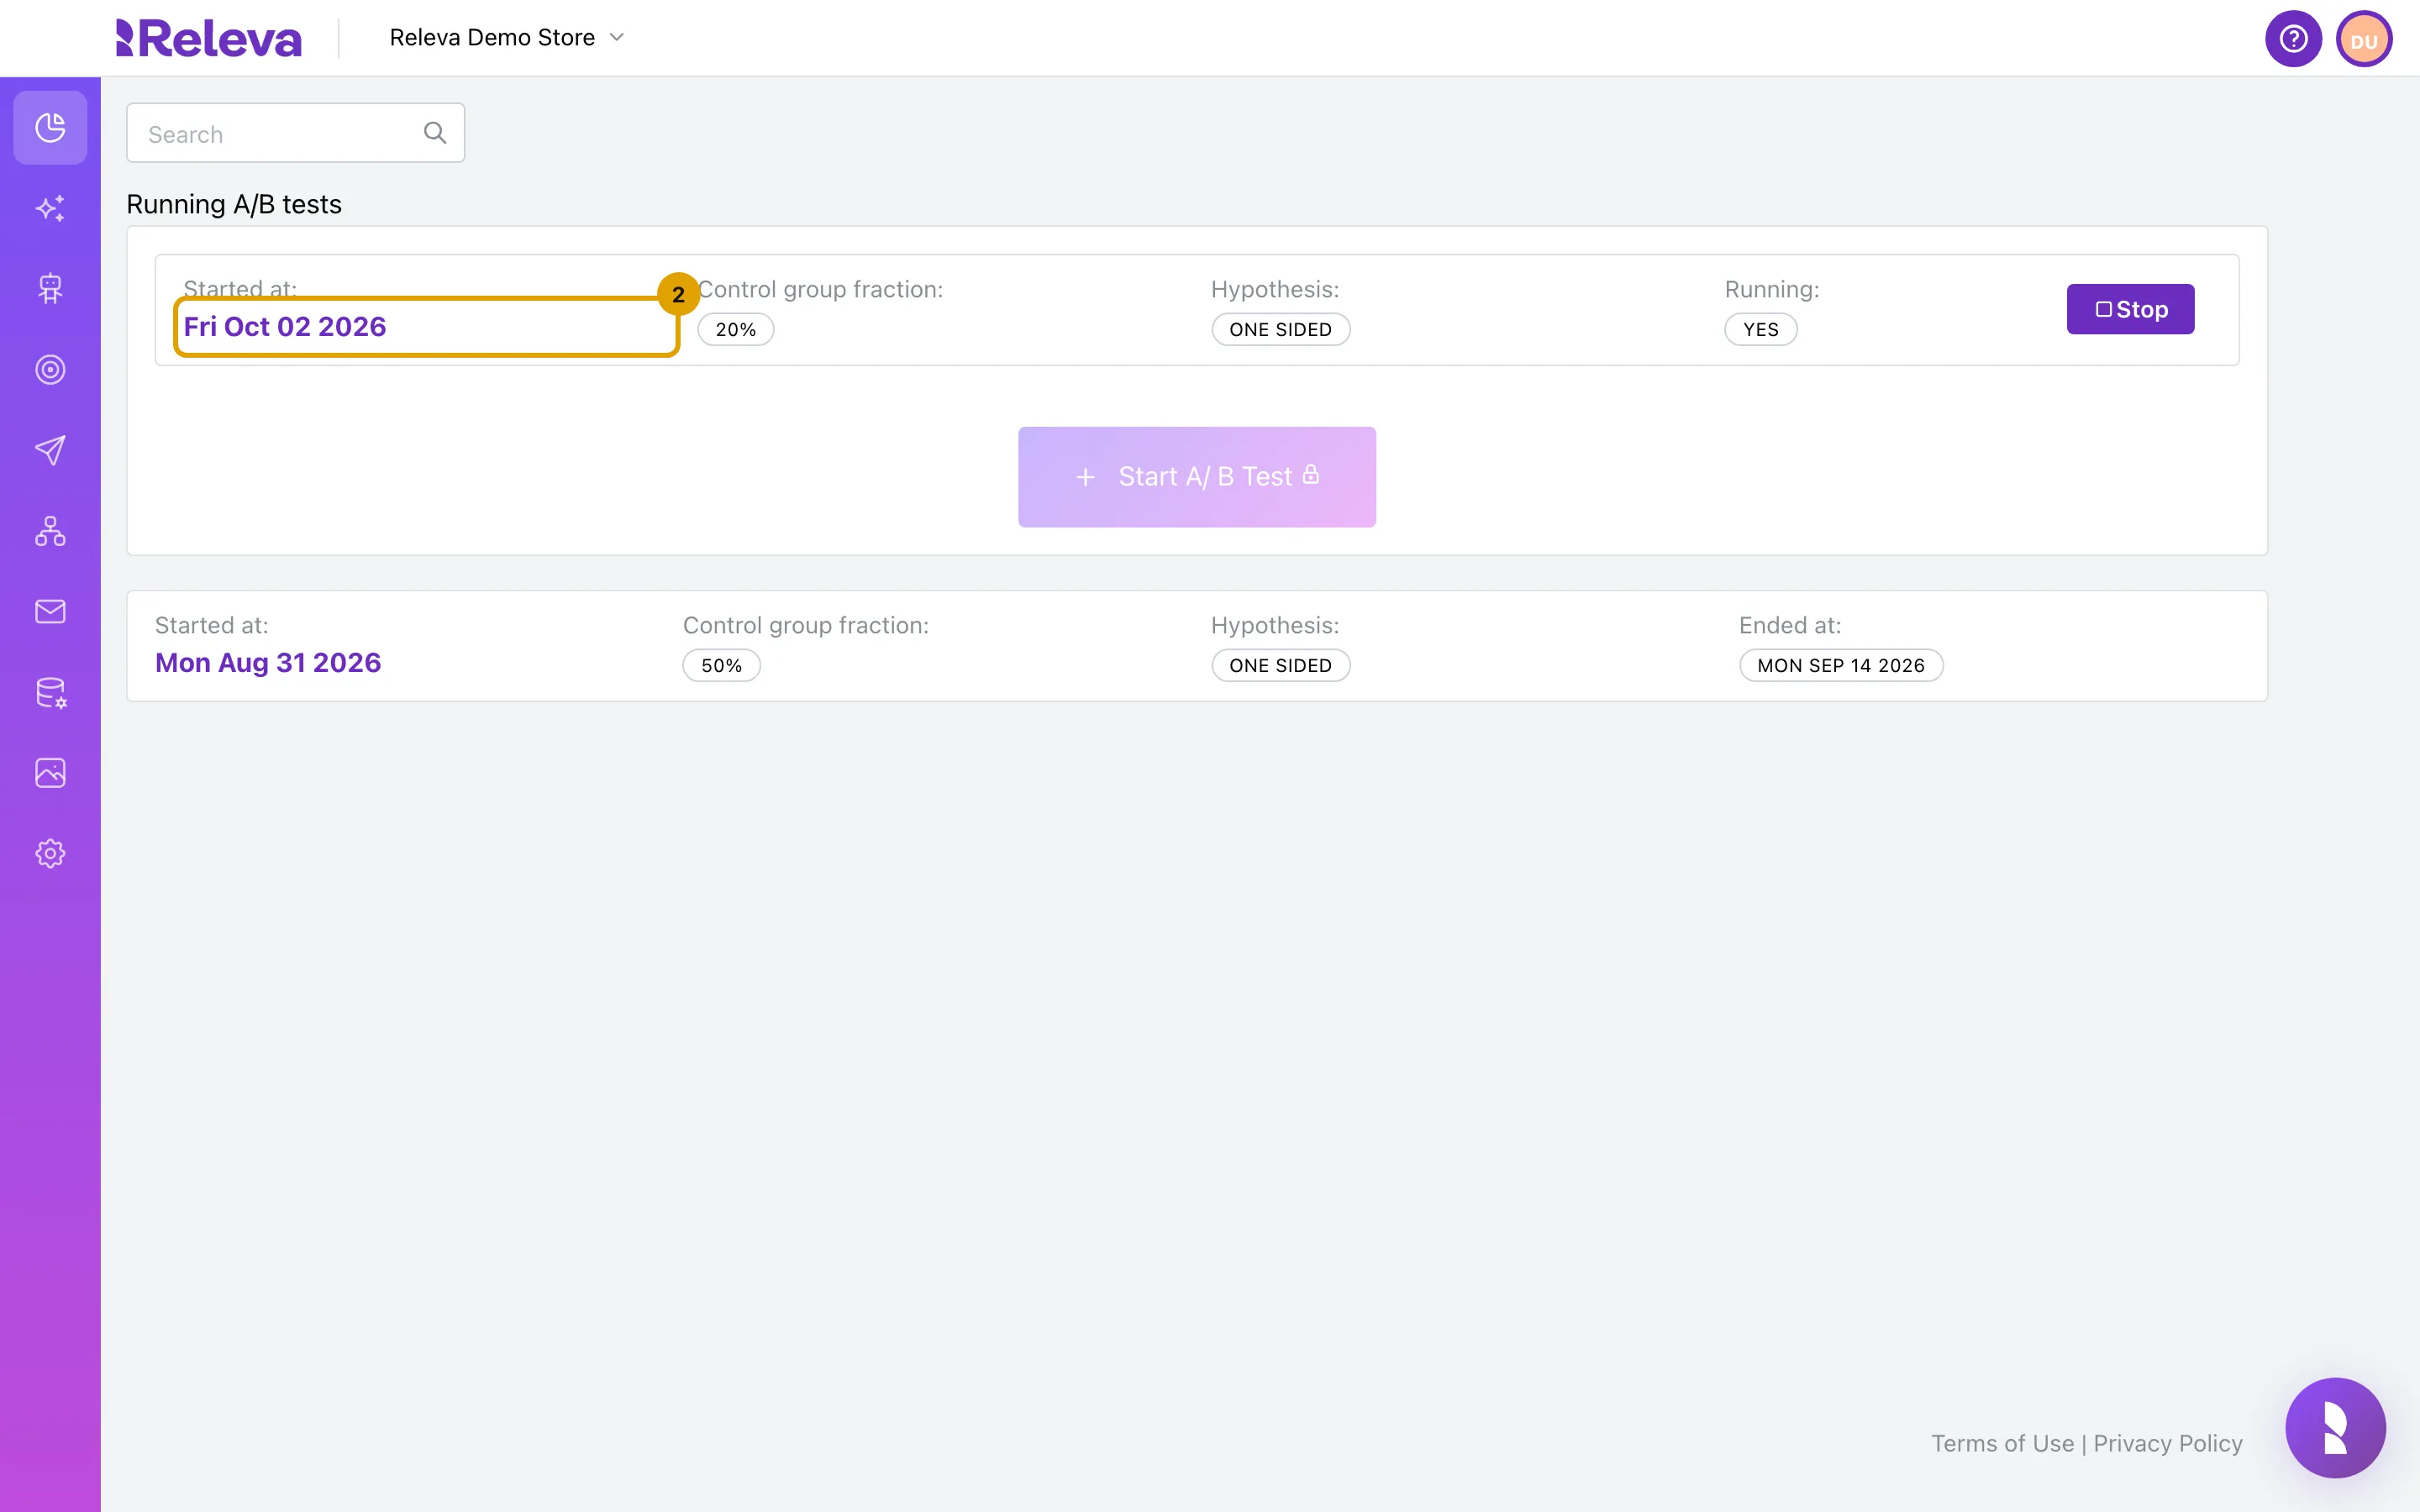
Select the date under Started at: to open the test.
-
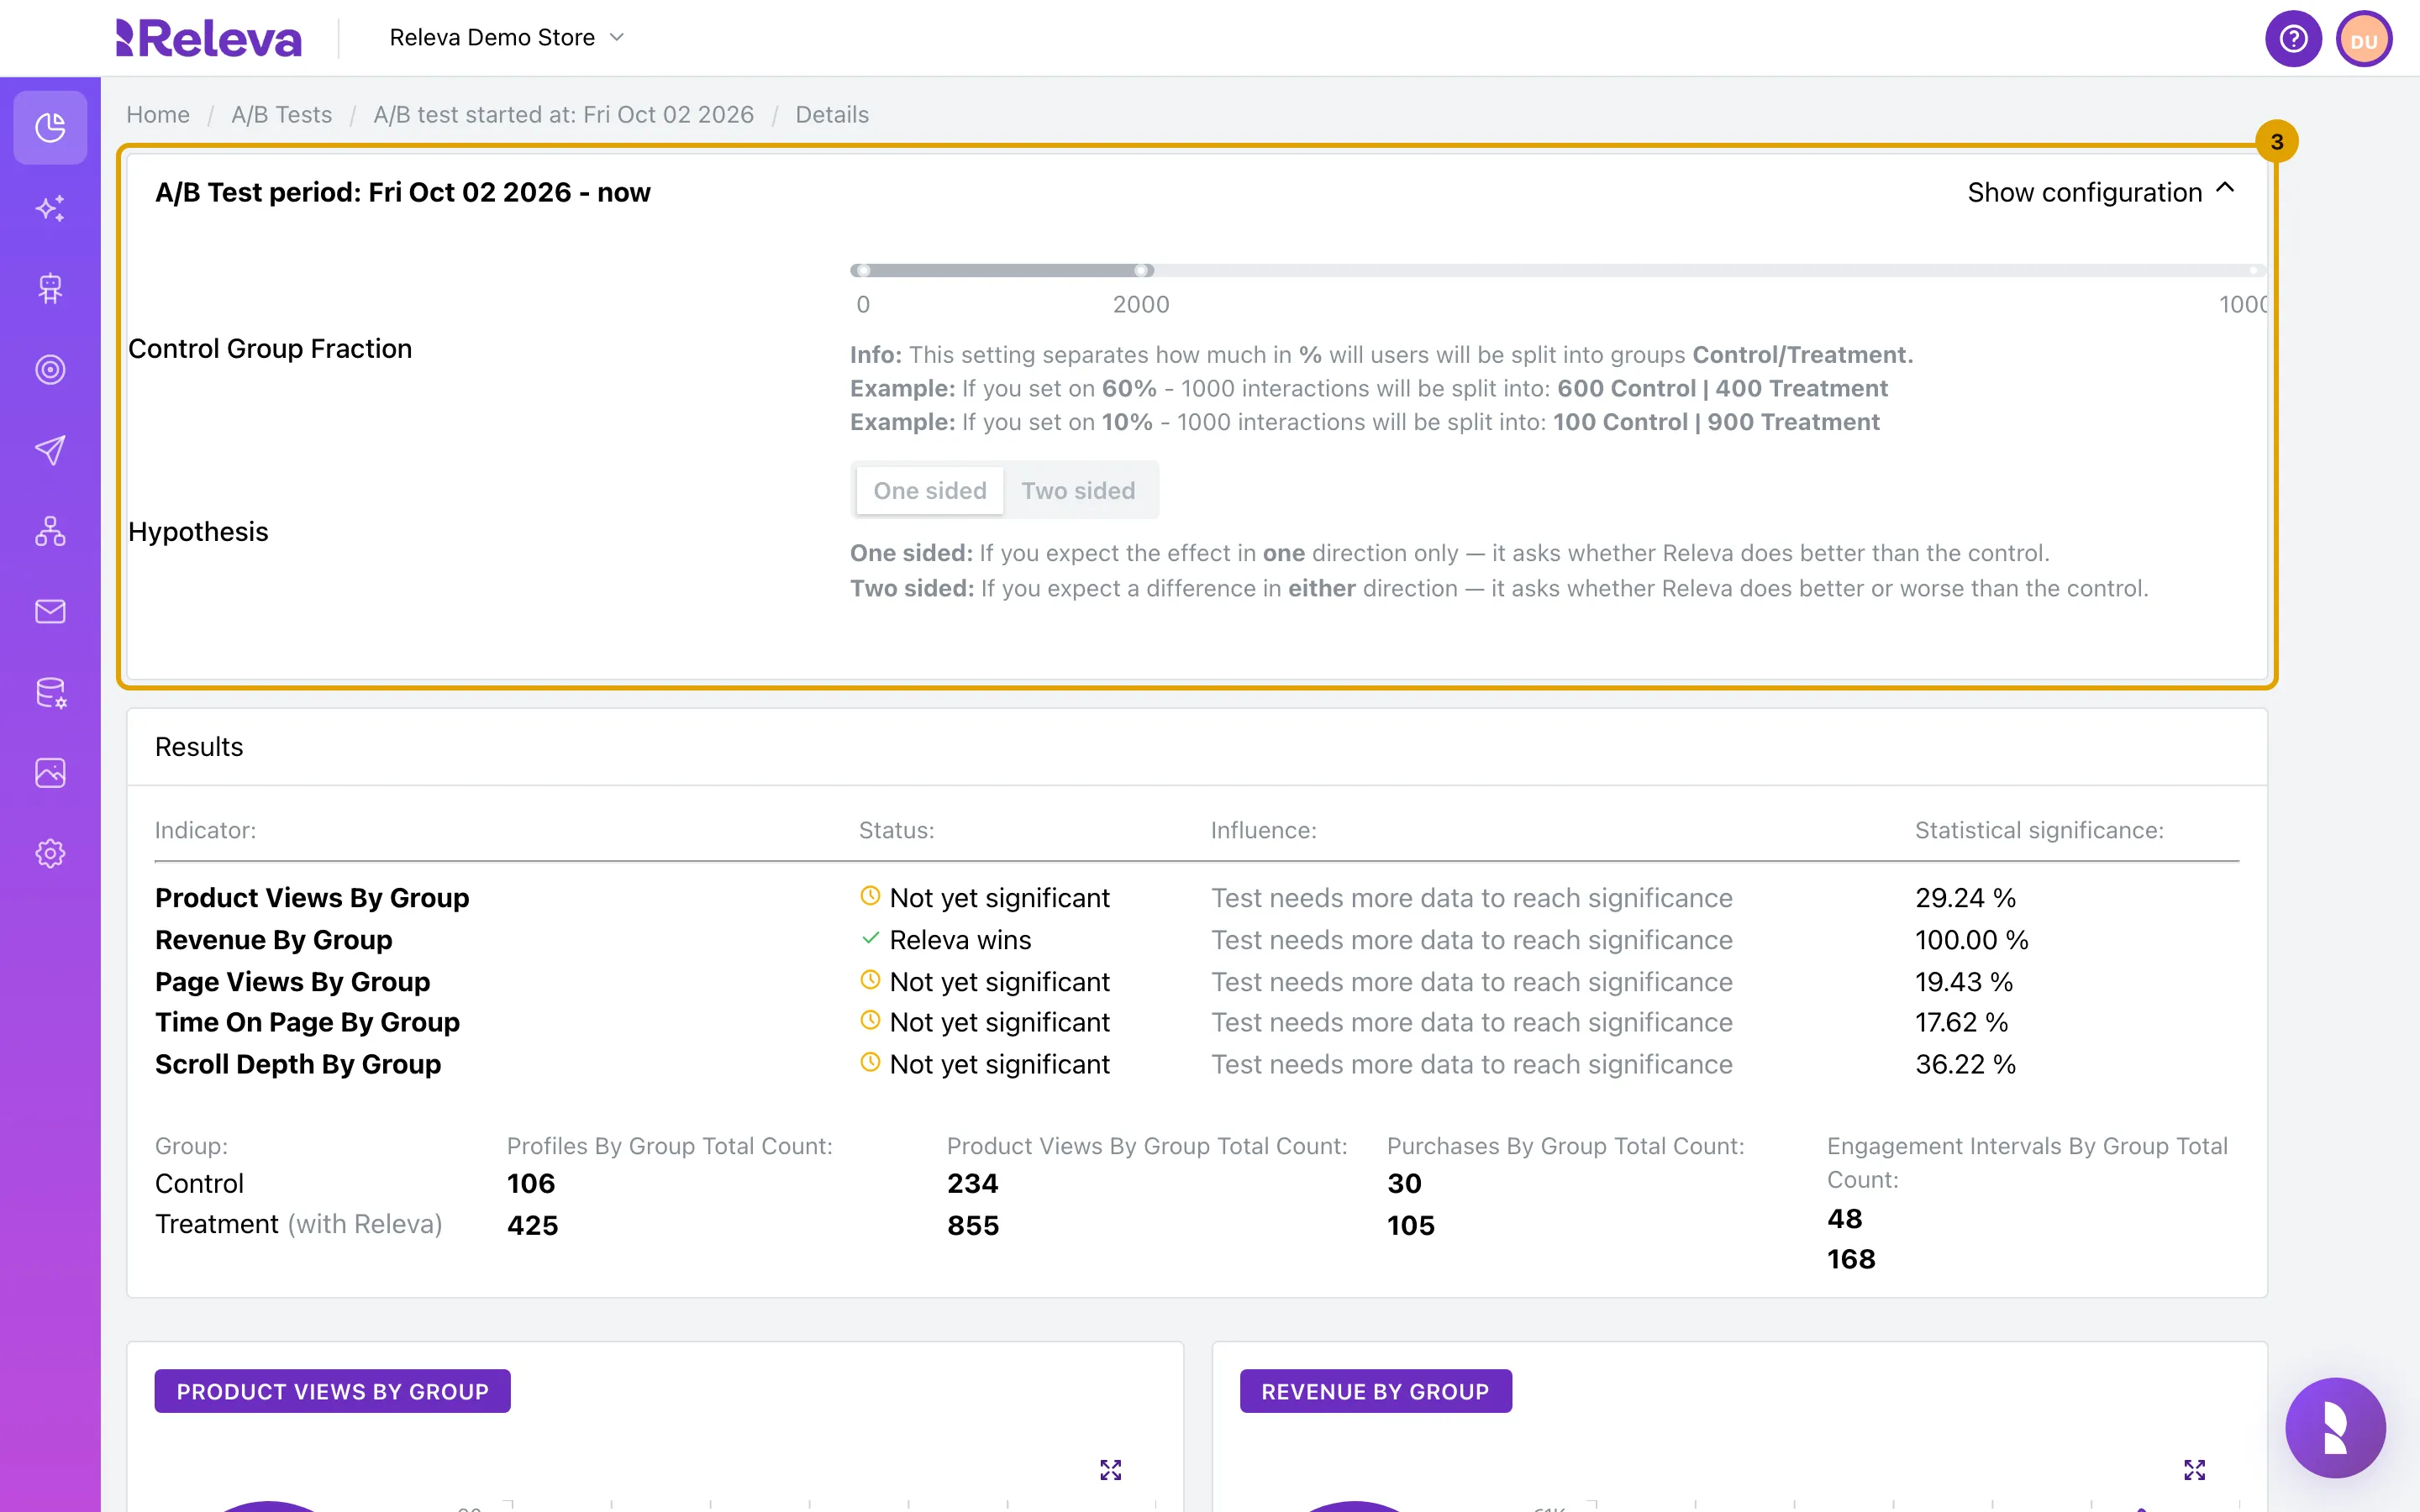
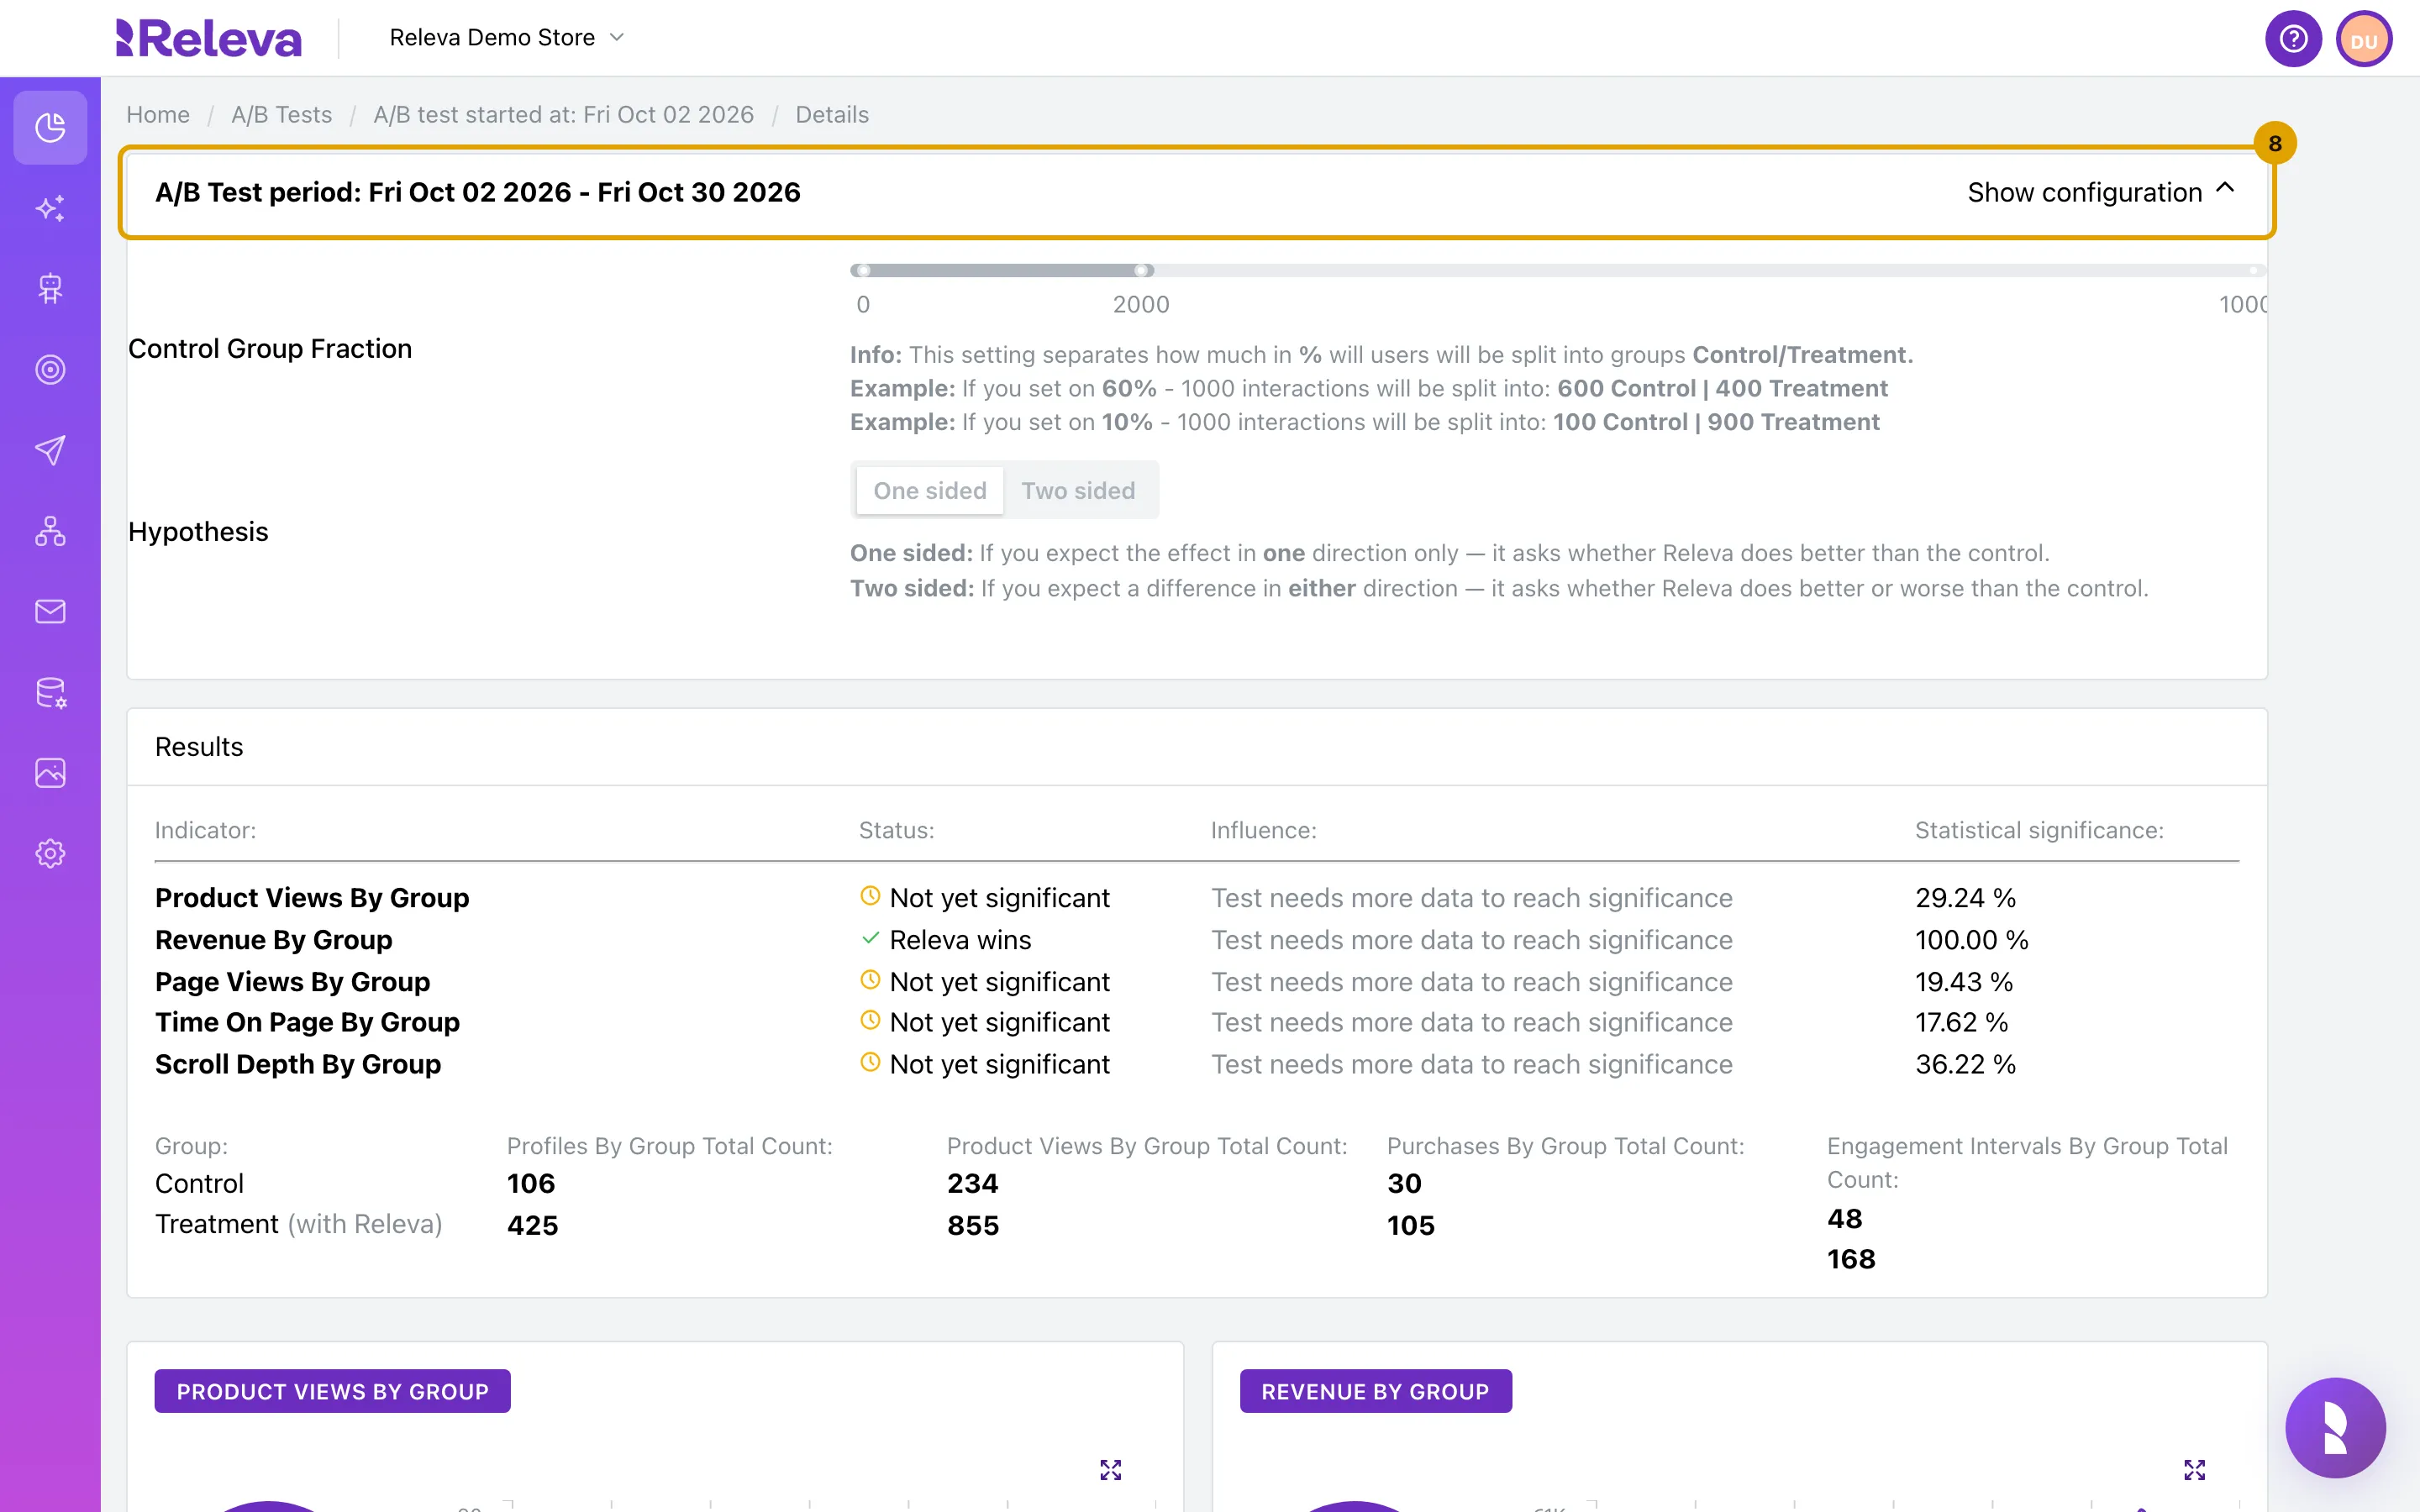
Select Show configuration to see the Control Group Fraction and Hypothesis the test runs with.
The header reads A/B Test period: <start date> - now while the test runs. The configuration is read-only. The slider counts in hundredths of a percent, so 2000 on the scale means a 20 % control group.
-
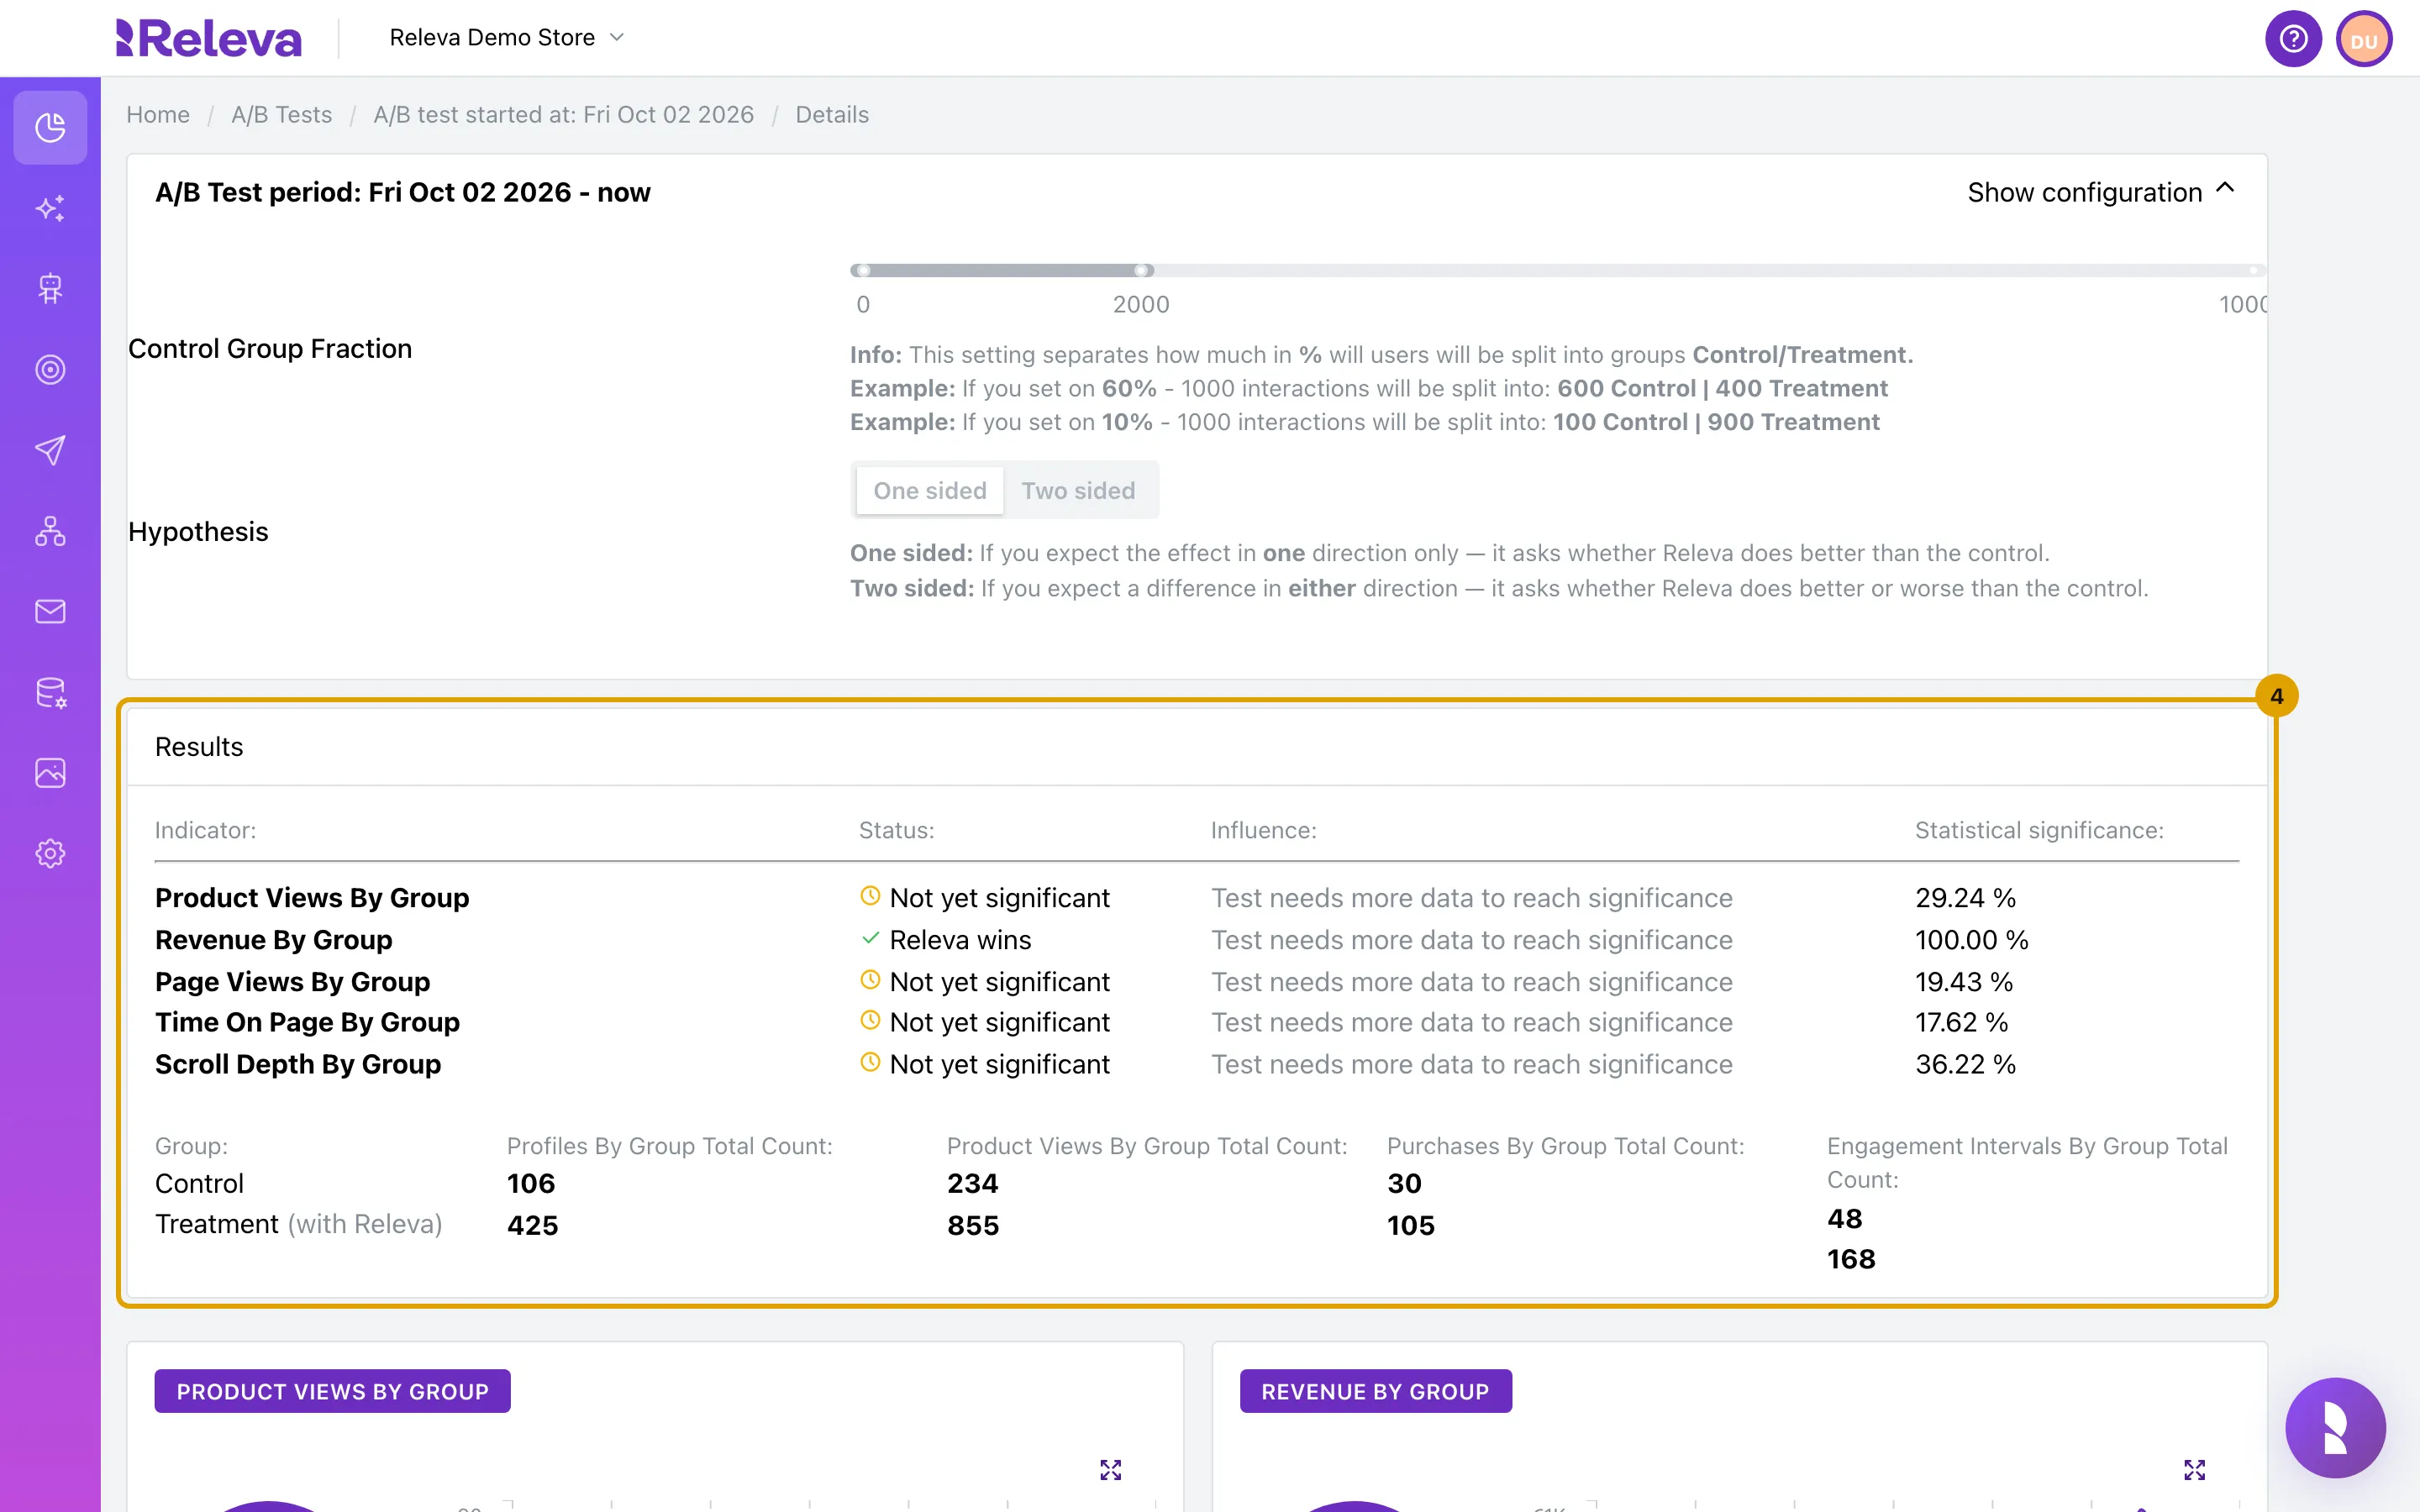
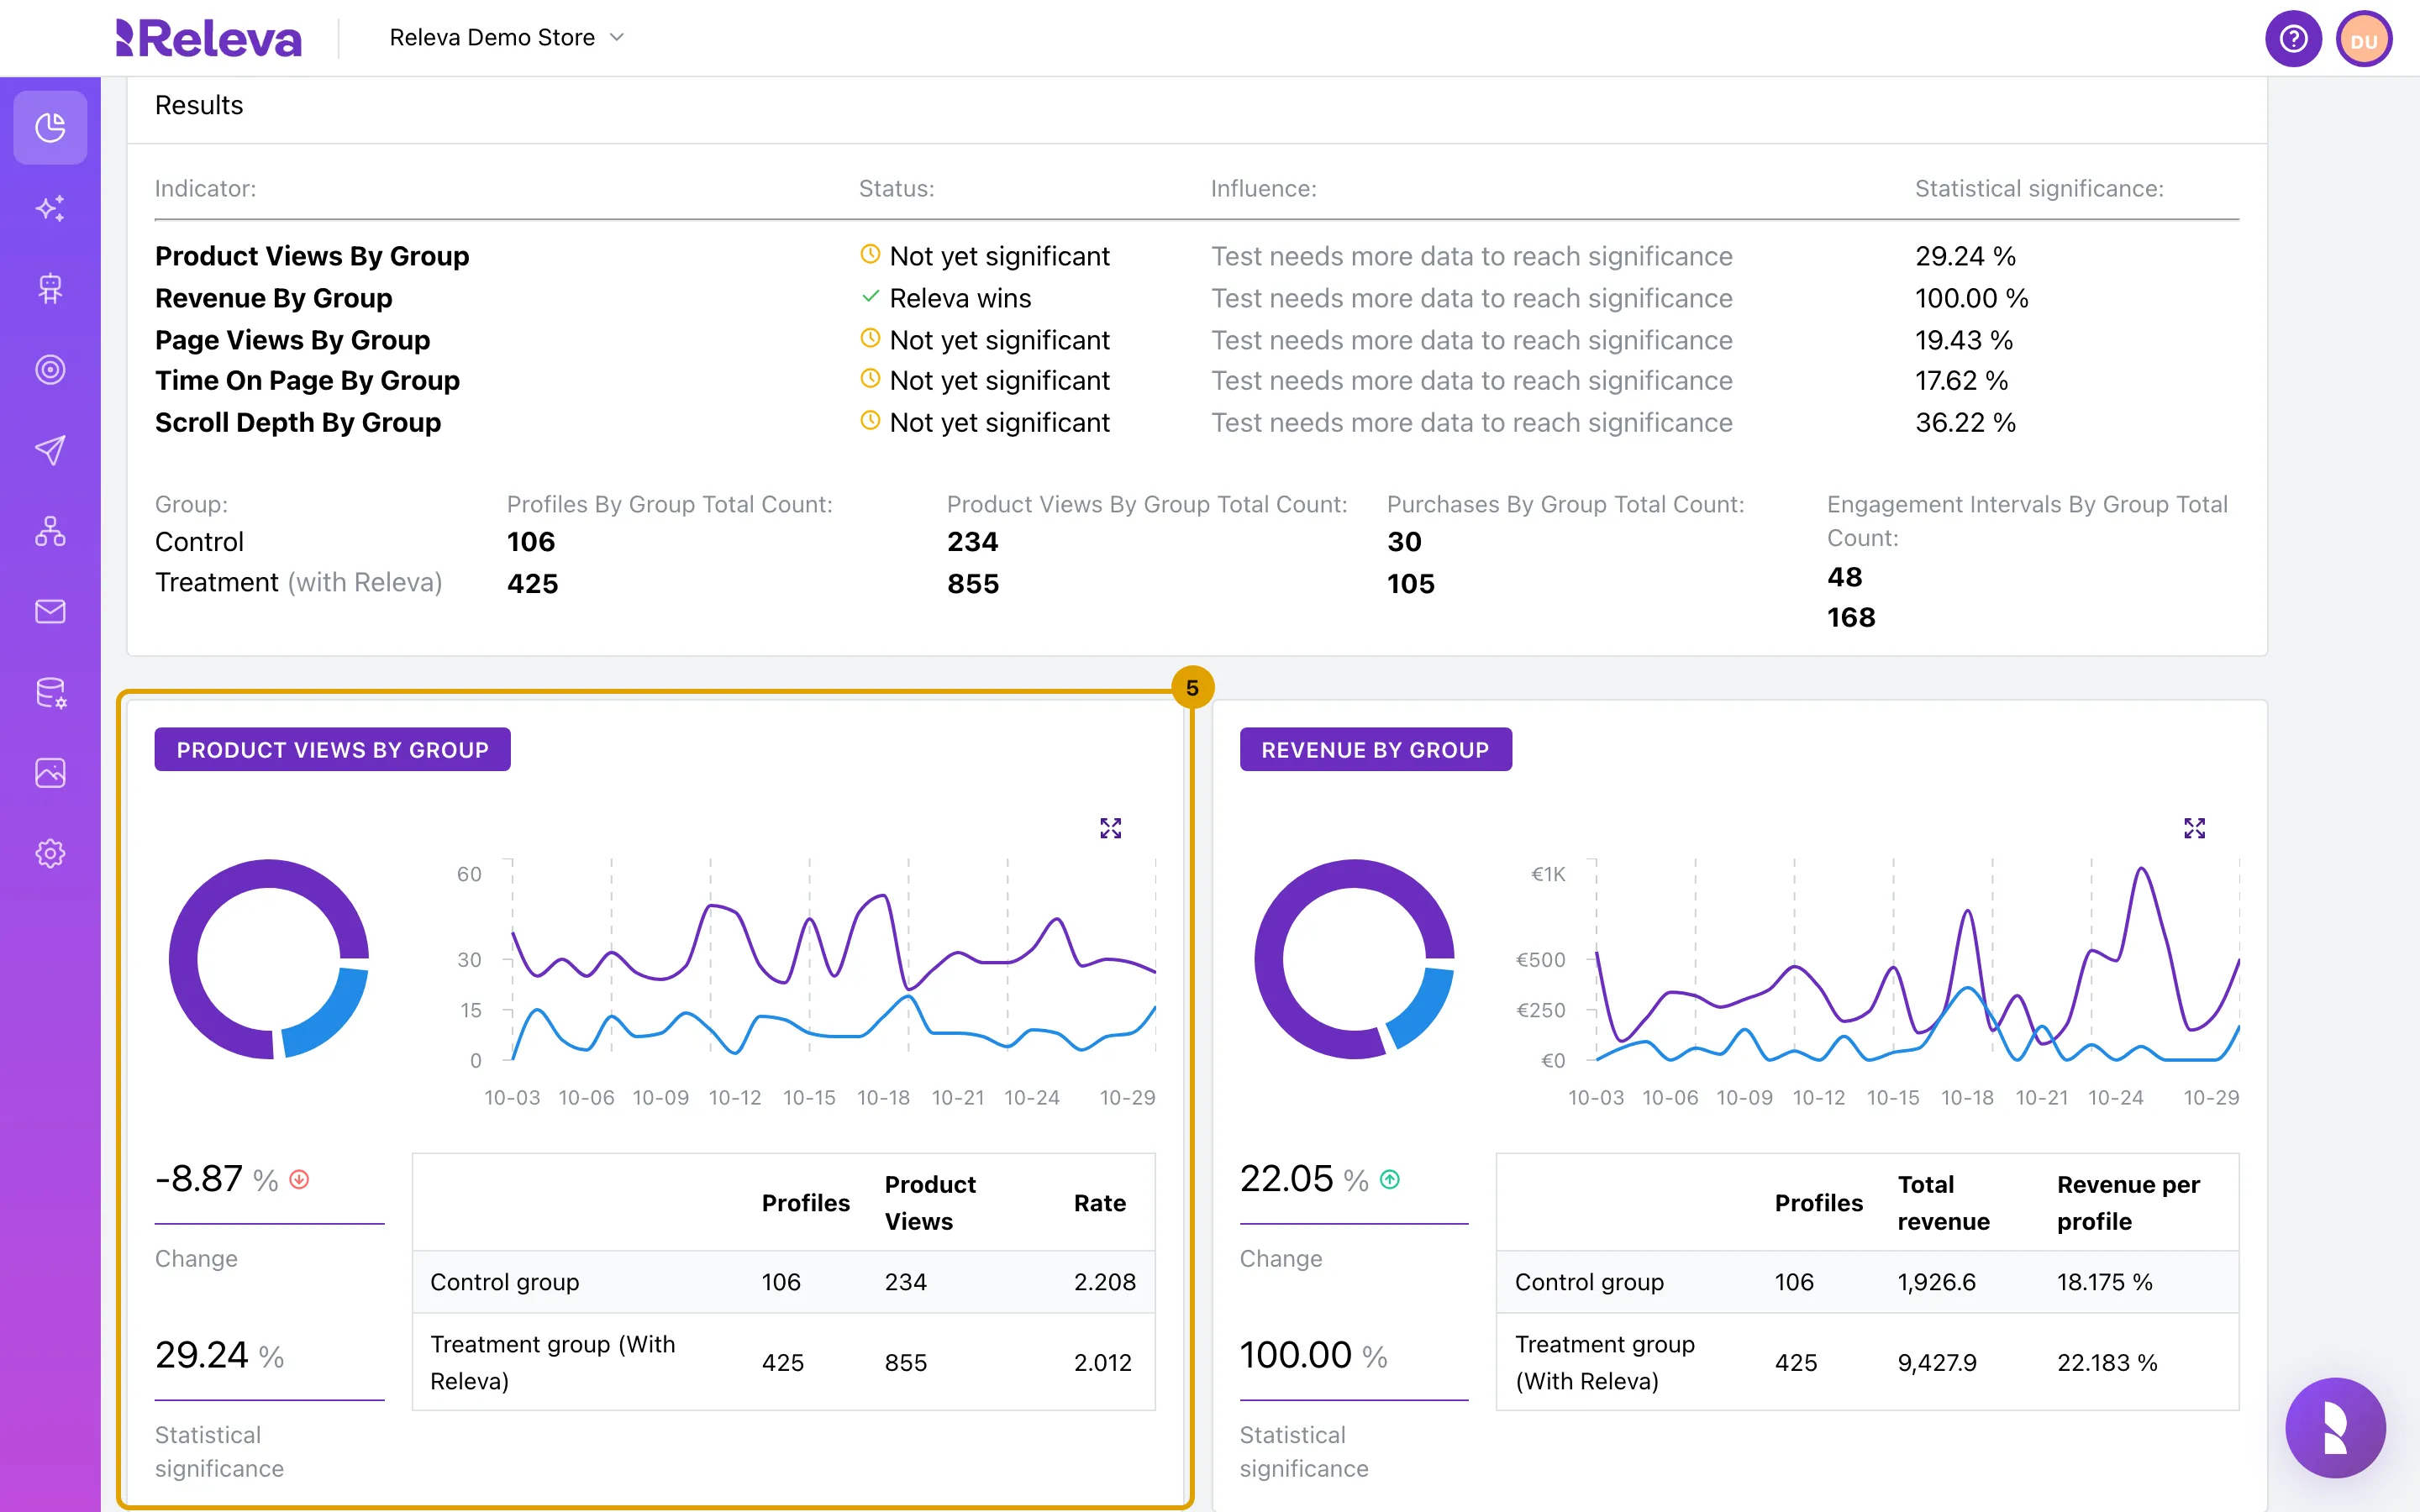
Under Results, read each indicator’s Status, Influence and Statistical significance.
Status is Not yet significant until the significance passes 90 %, then Releva wins or Releva doesn’t win. Below the indicators, Group: lists Profiles By Group Total Count:, Product Views By Group Total Count:, Purchases By Group Total Count: and Engagement Intervals By Group Total Count: for Control and Treatment (with Releva). Engagement intervals are the tracked page views that time on page and scroll depth are averaged over.
-
Scroll down to compare the Control group and the Treatment group (With Releva) for each indicator.
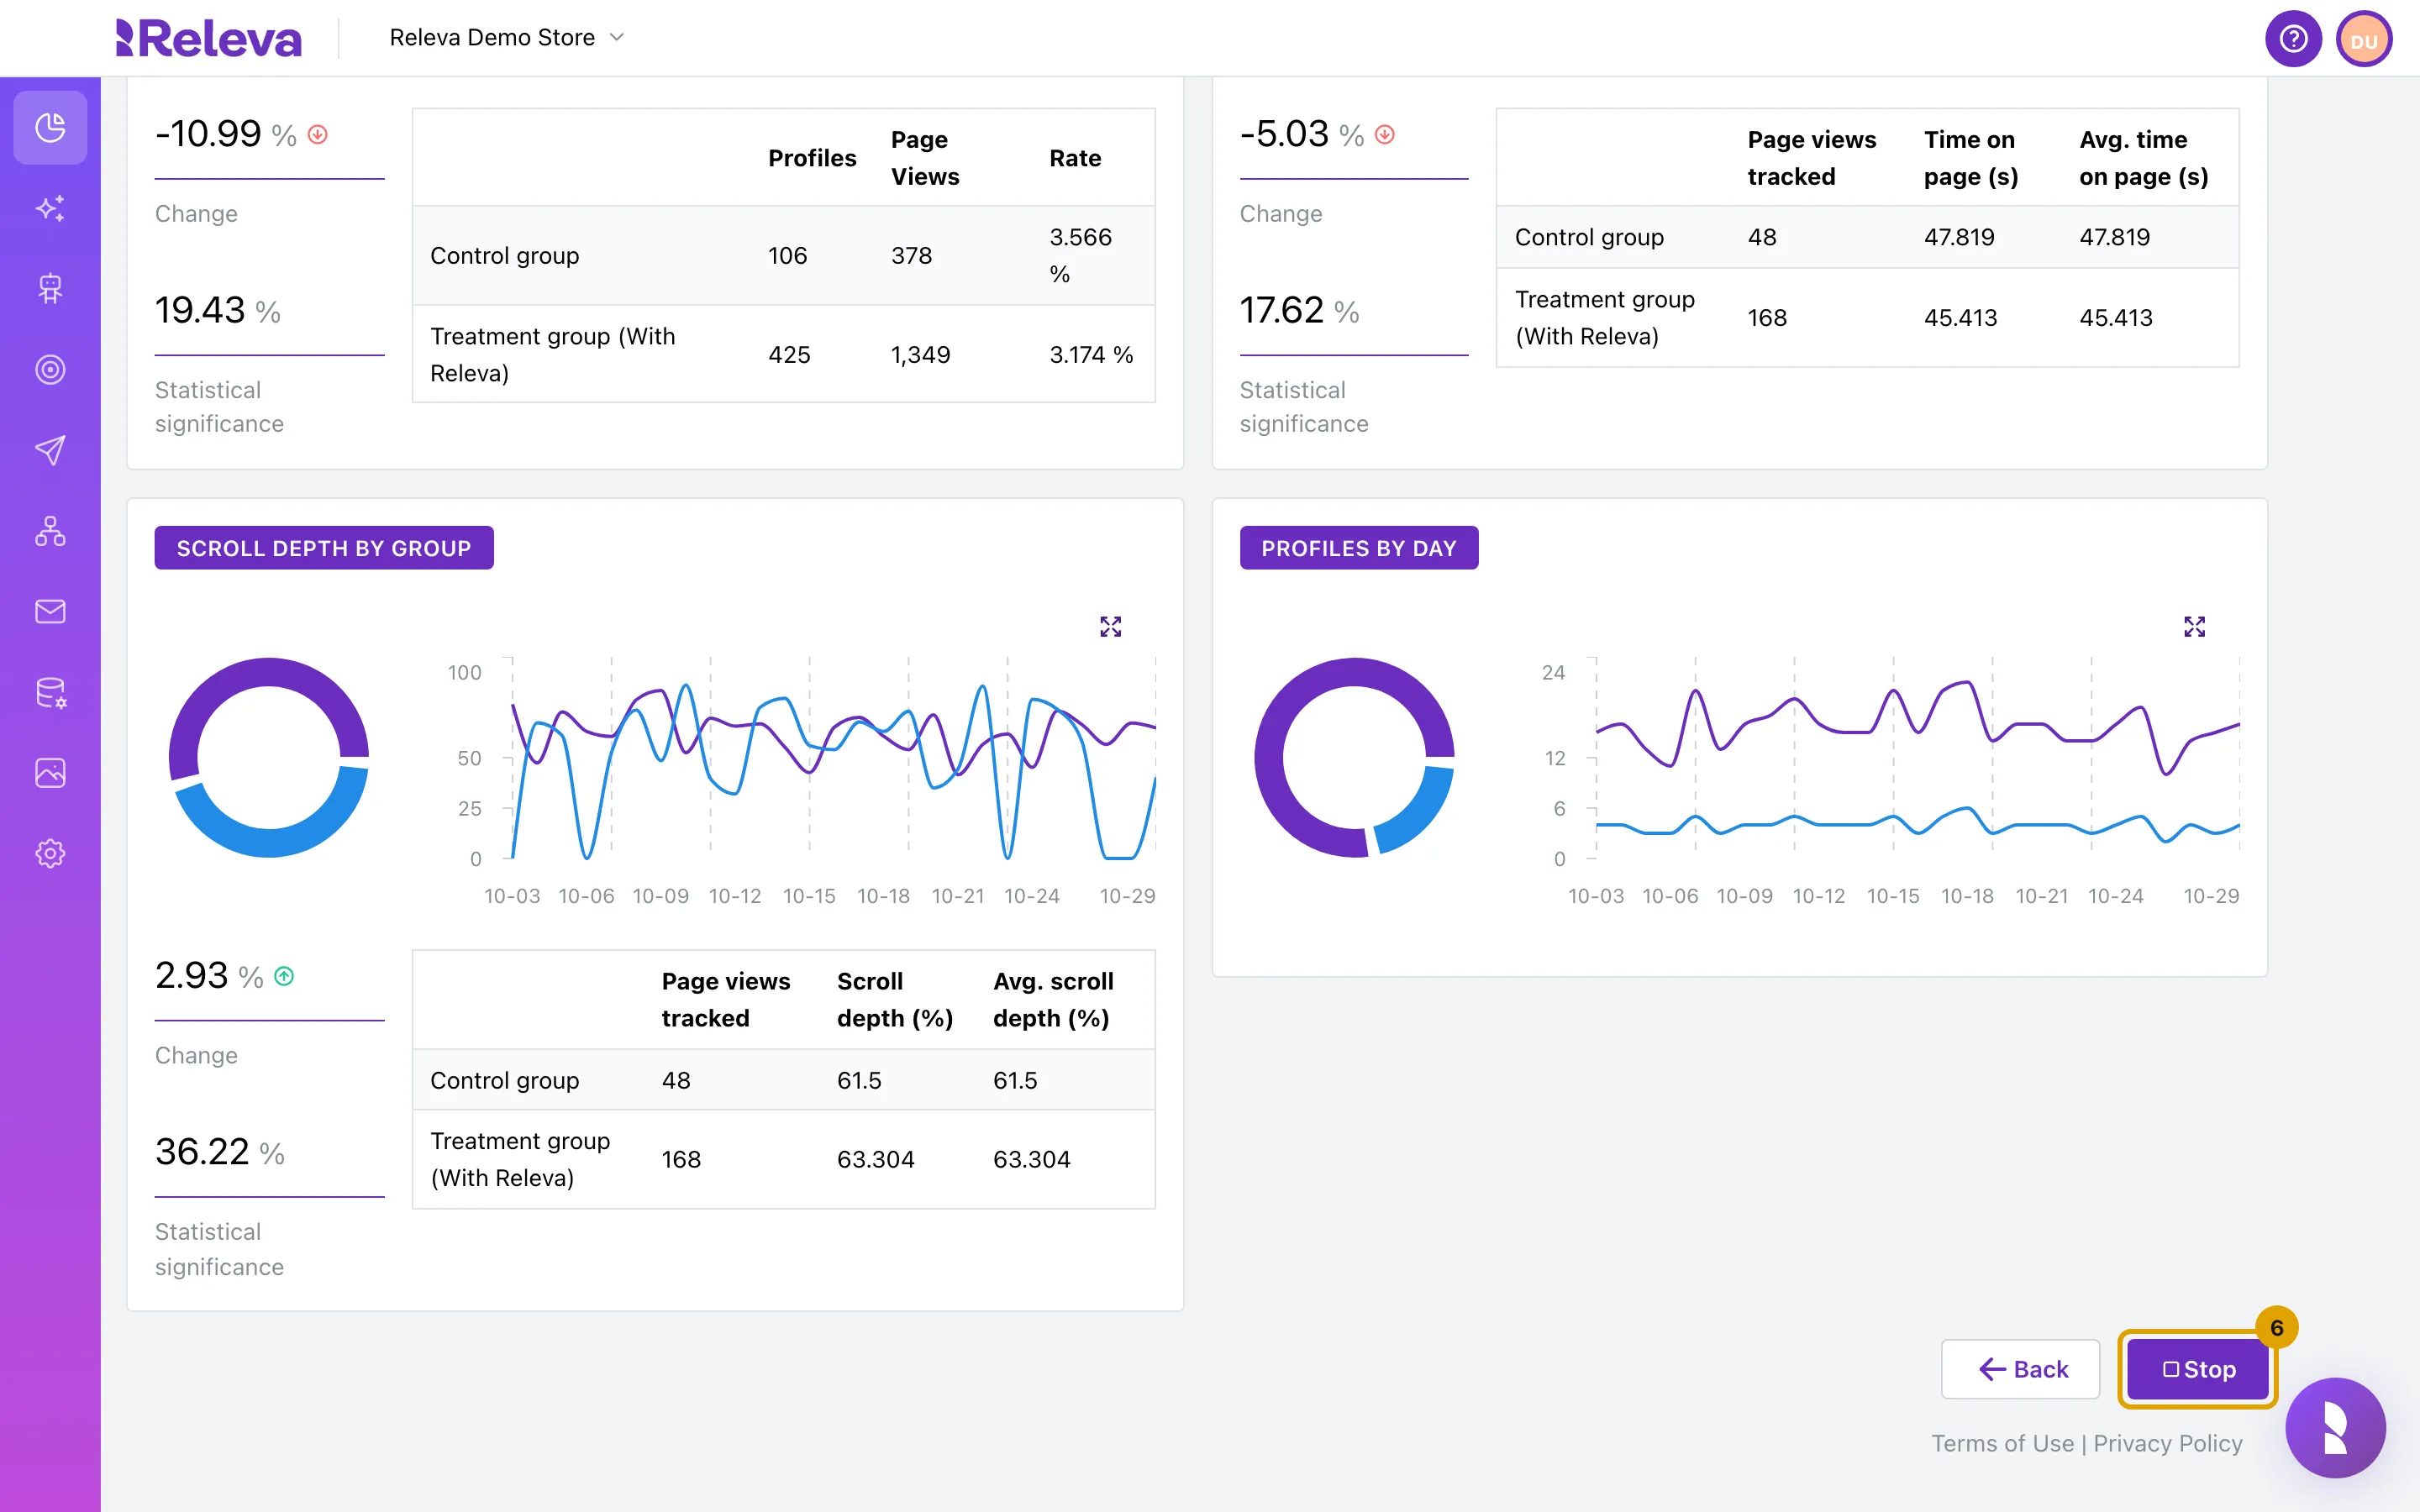
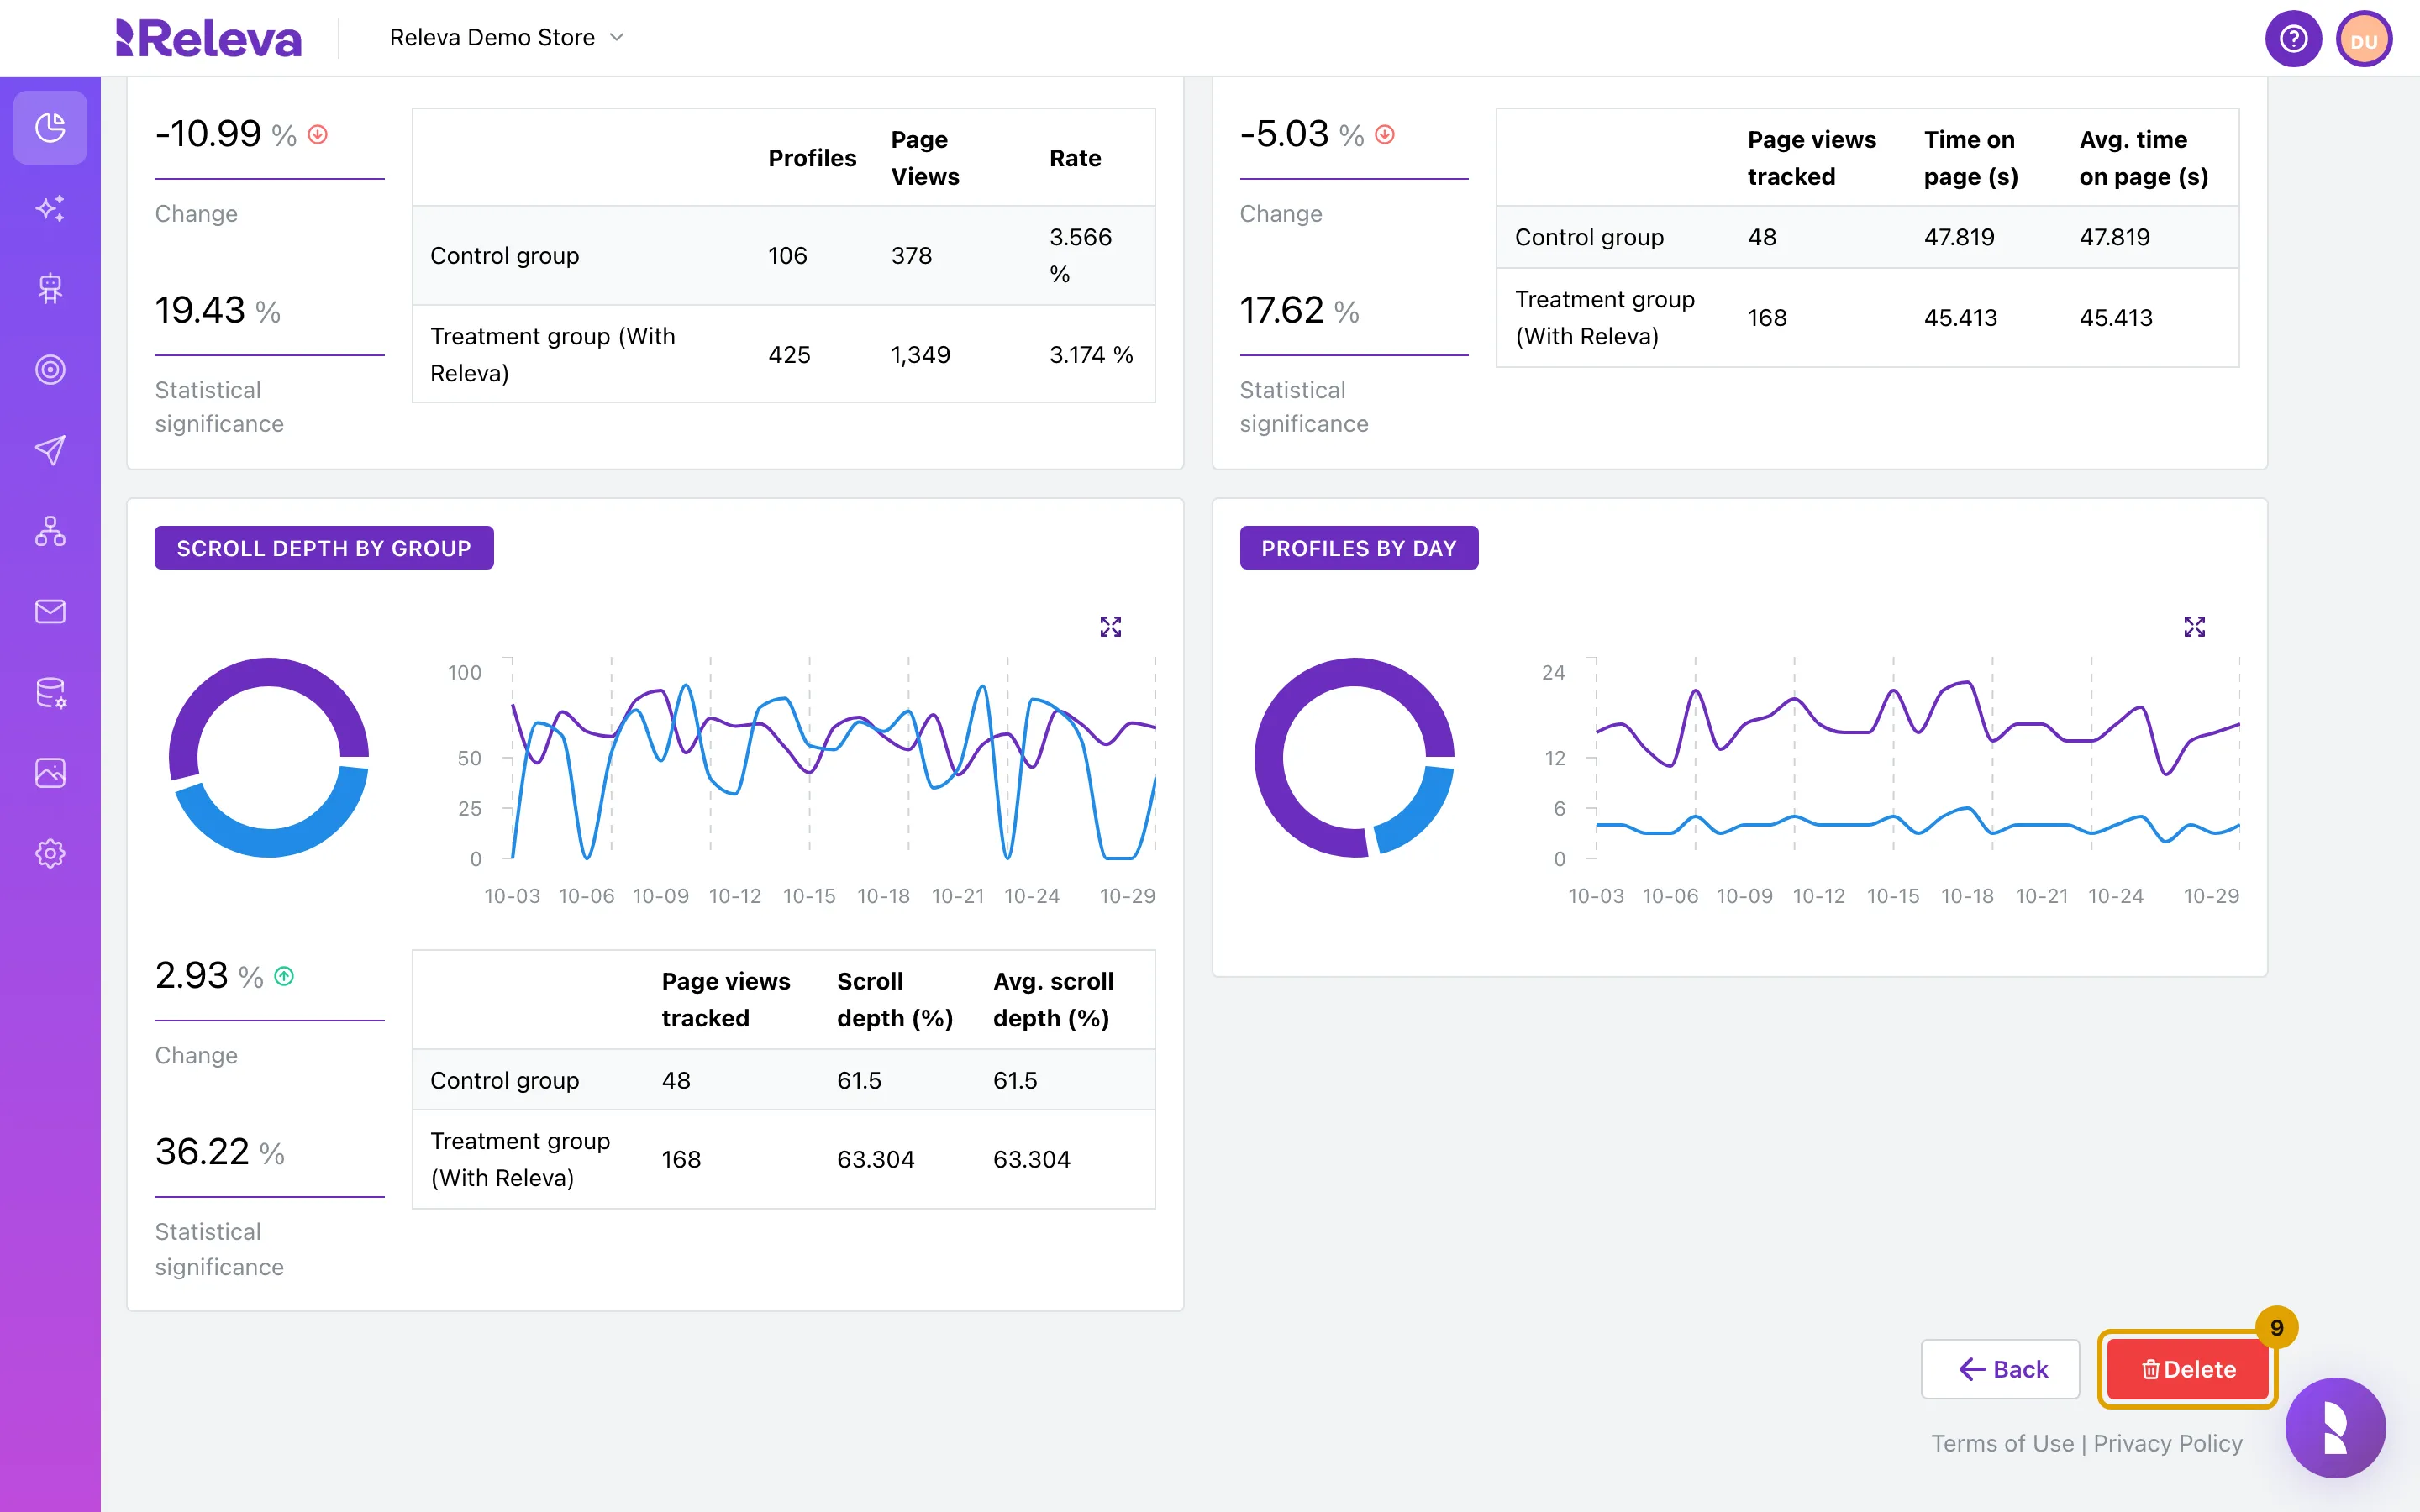
Each indicator has its own card with a chart, the Change in percent, the Statistical significance and a table with the two groups. No Data means nothing was recorded for that indicator in the counted days. The last card, Profiles By Day, shows how many profiles each group had per day.
-
To end the test, select Stop.
Stop is at the bottom of the page, next to Back.
-
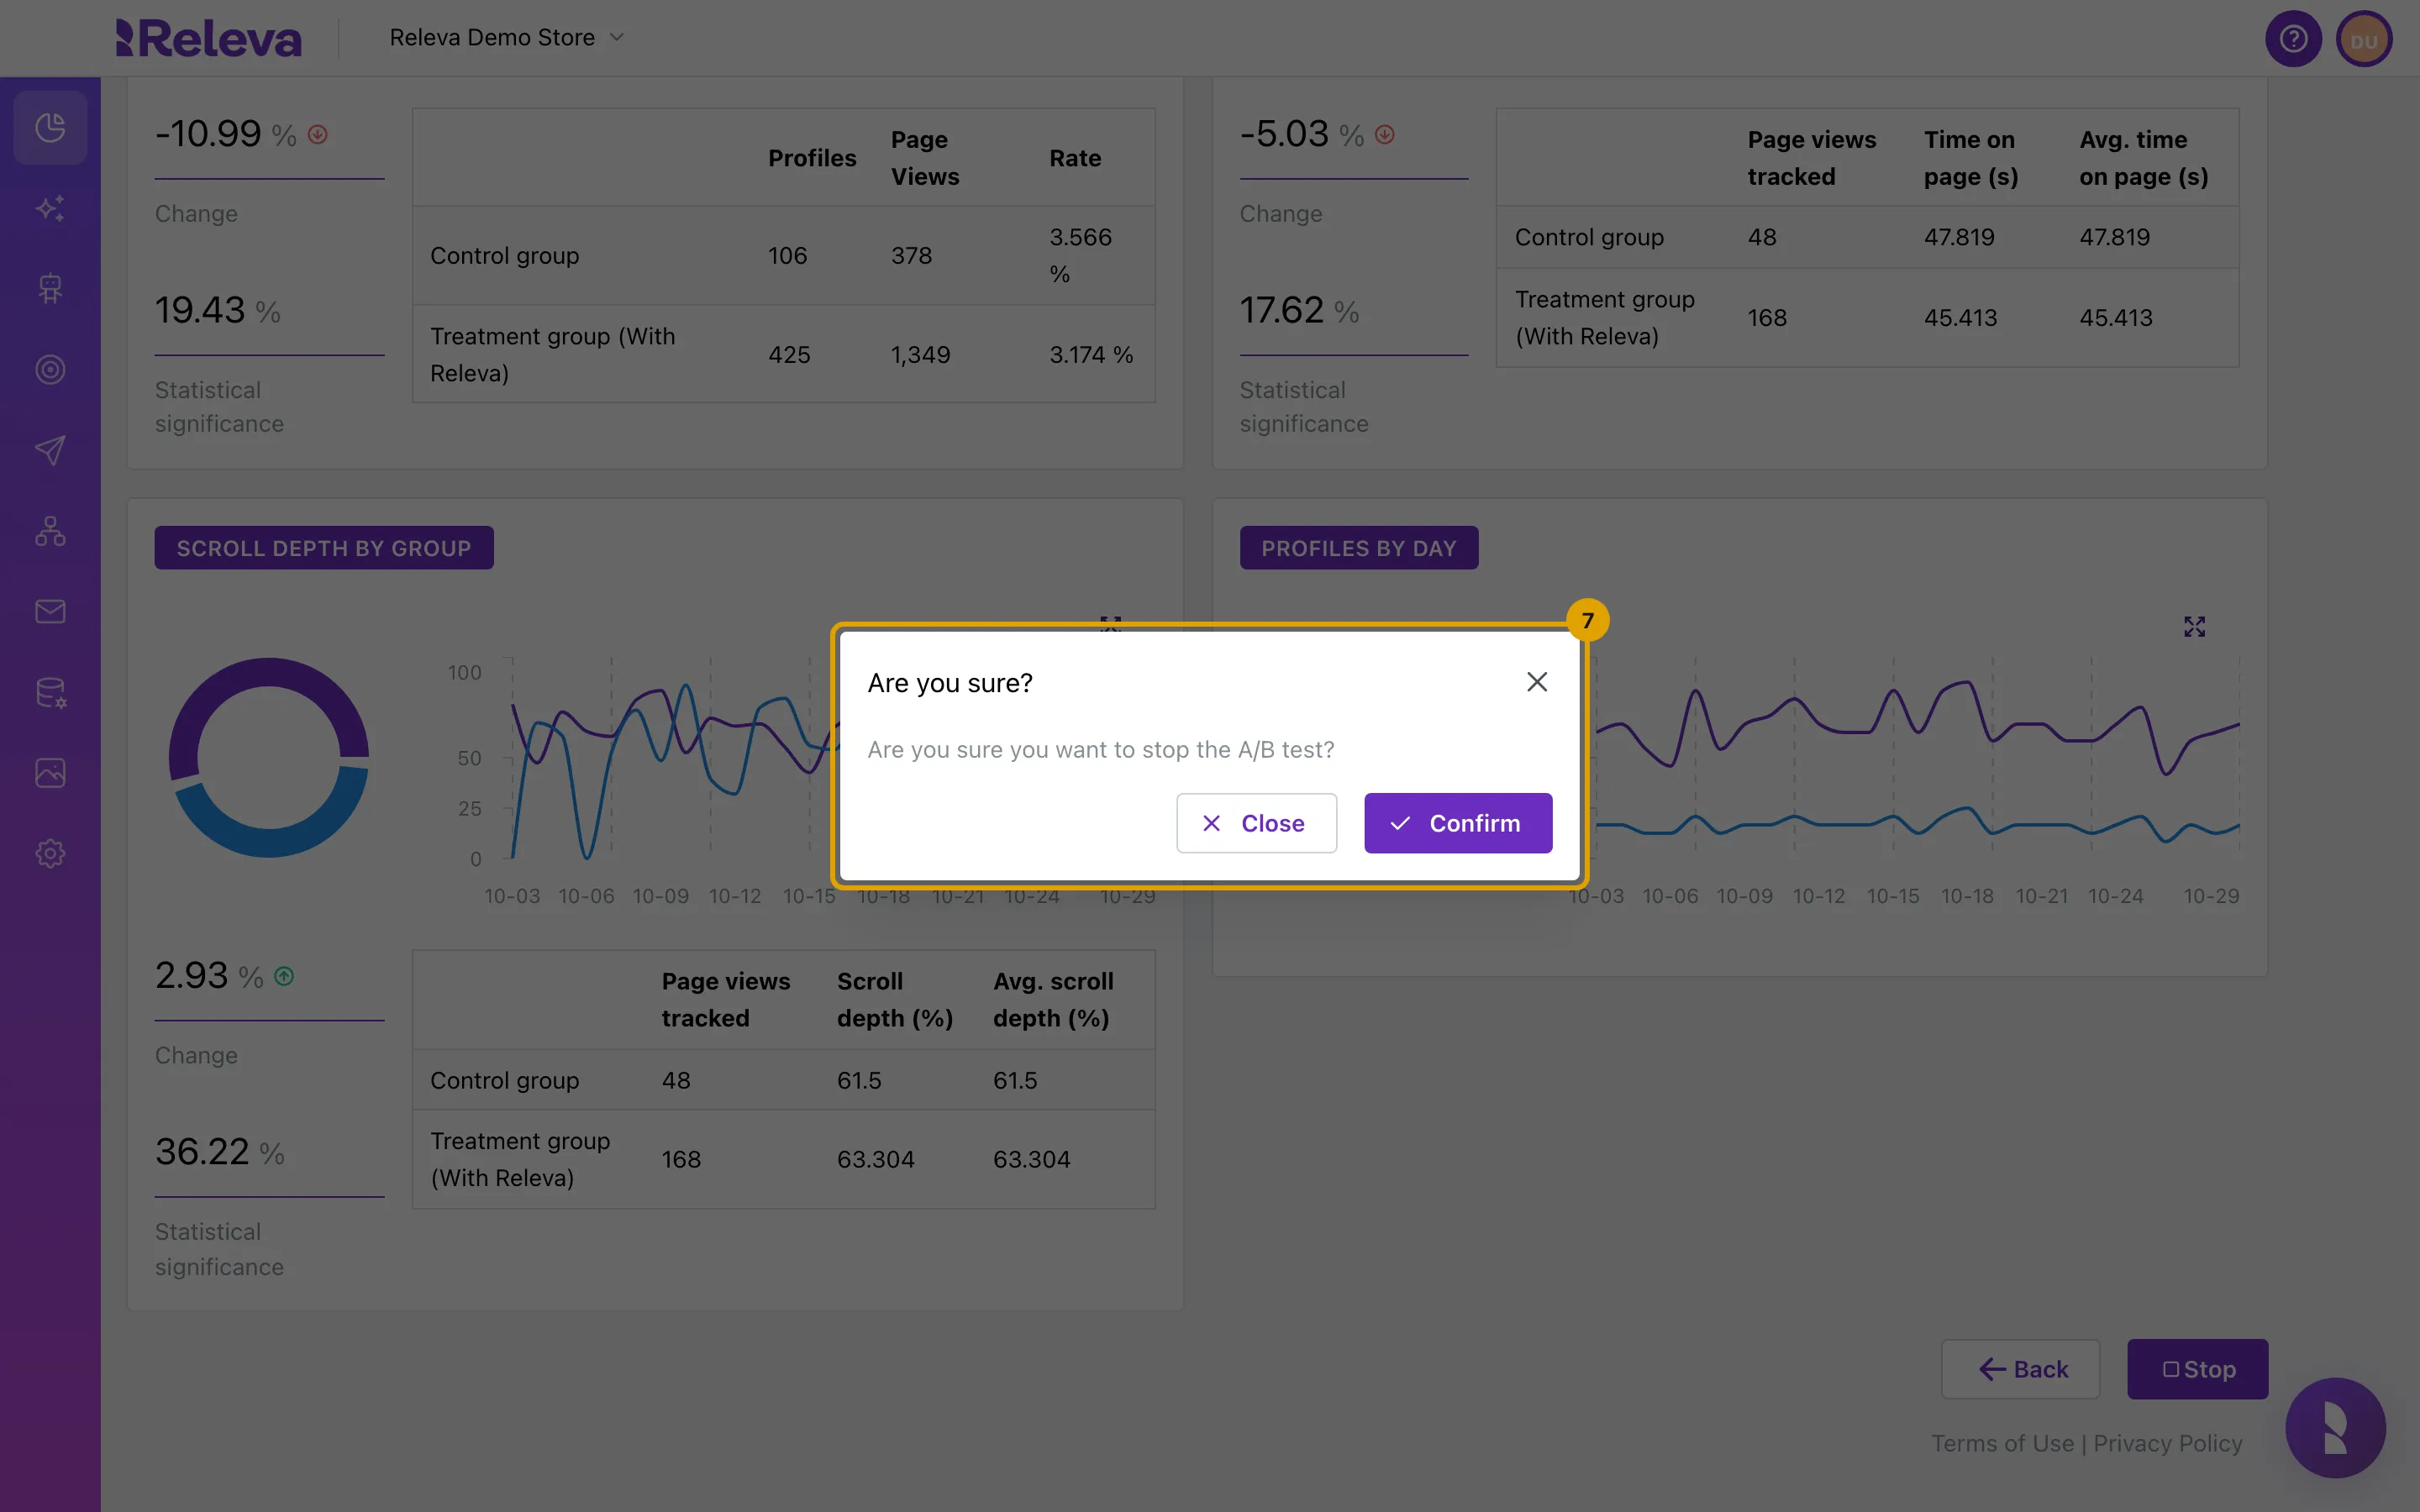
Select Confirm.
The dialog asks Are you sure you want to stop the A/B test? Select Close to keep the test running.
-
The test has ended. A/B Test period now shows an end date, and Delete replaces Stop.
The results stay on this page. If you want to keep them, you are done.
-
Optional: to remove the test and its results, select Delete.
-
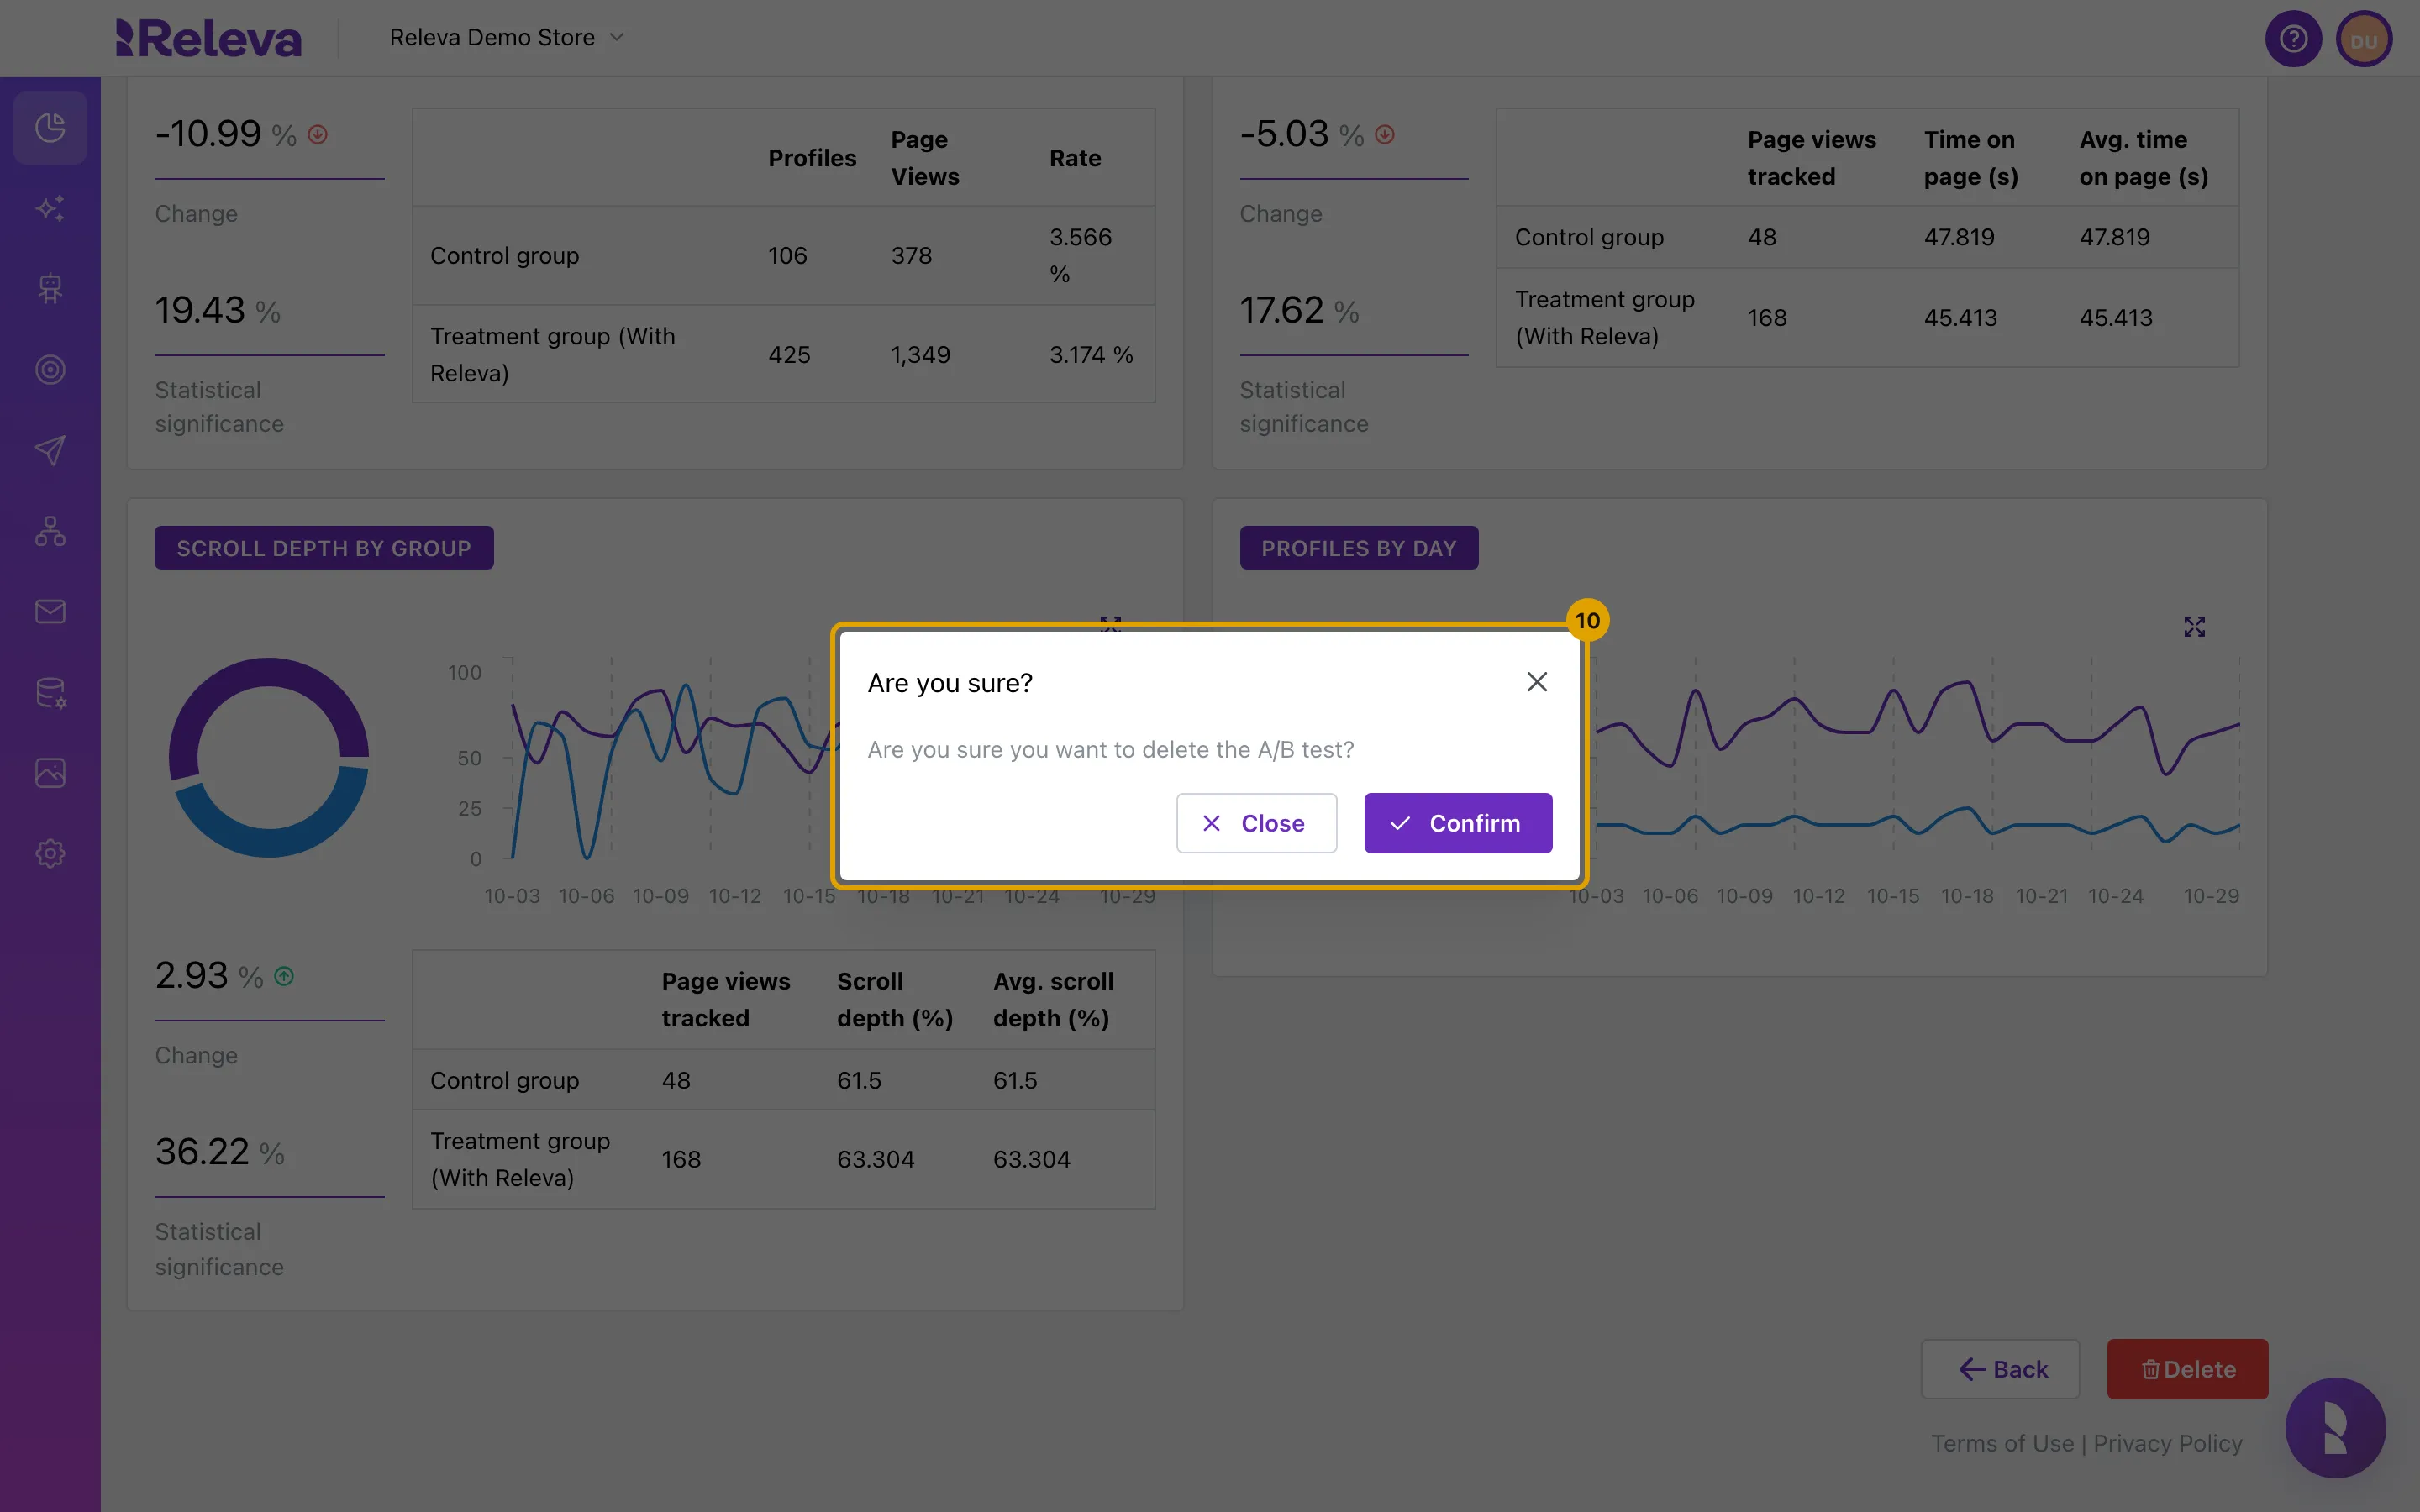
Read Are you sure you want to delete the A/B test? and select Confirm.
Deleting cannot be undone.
-
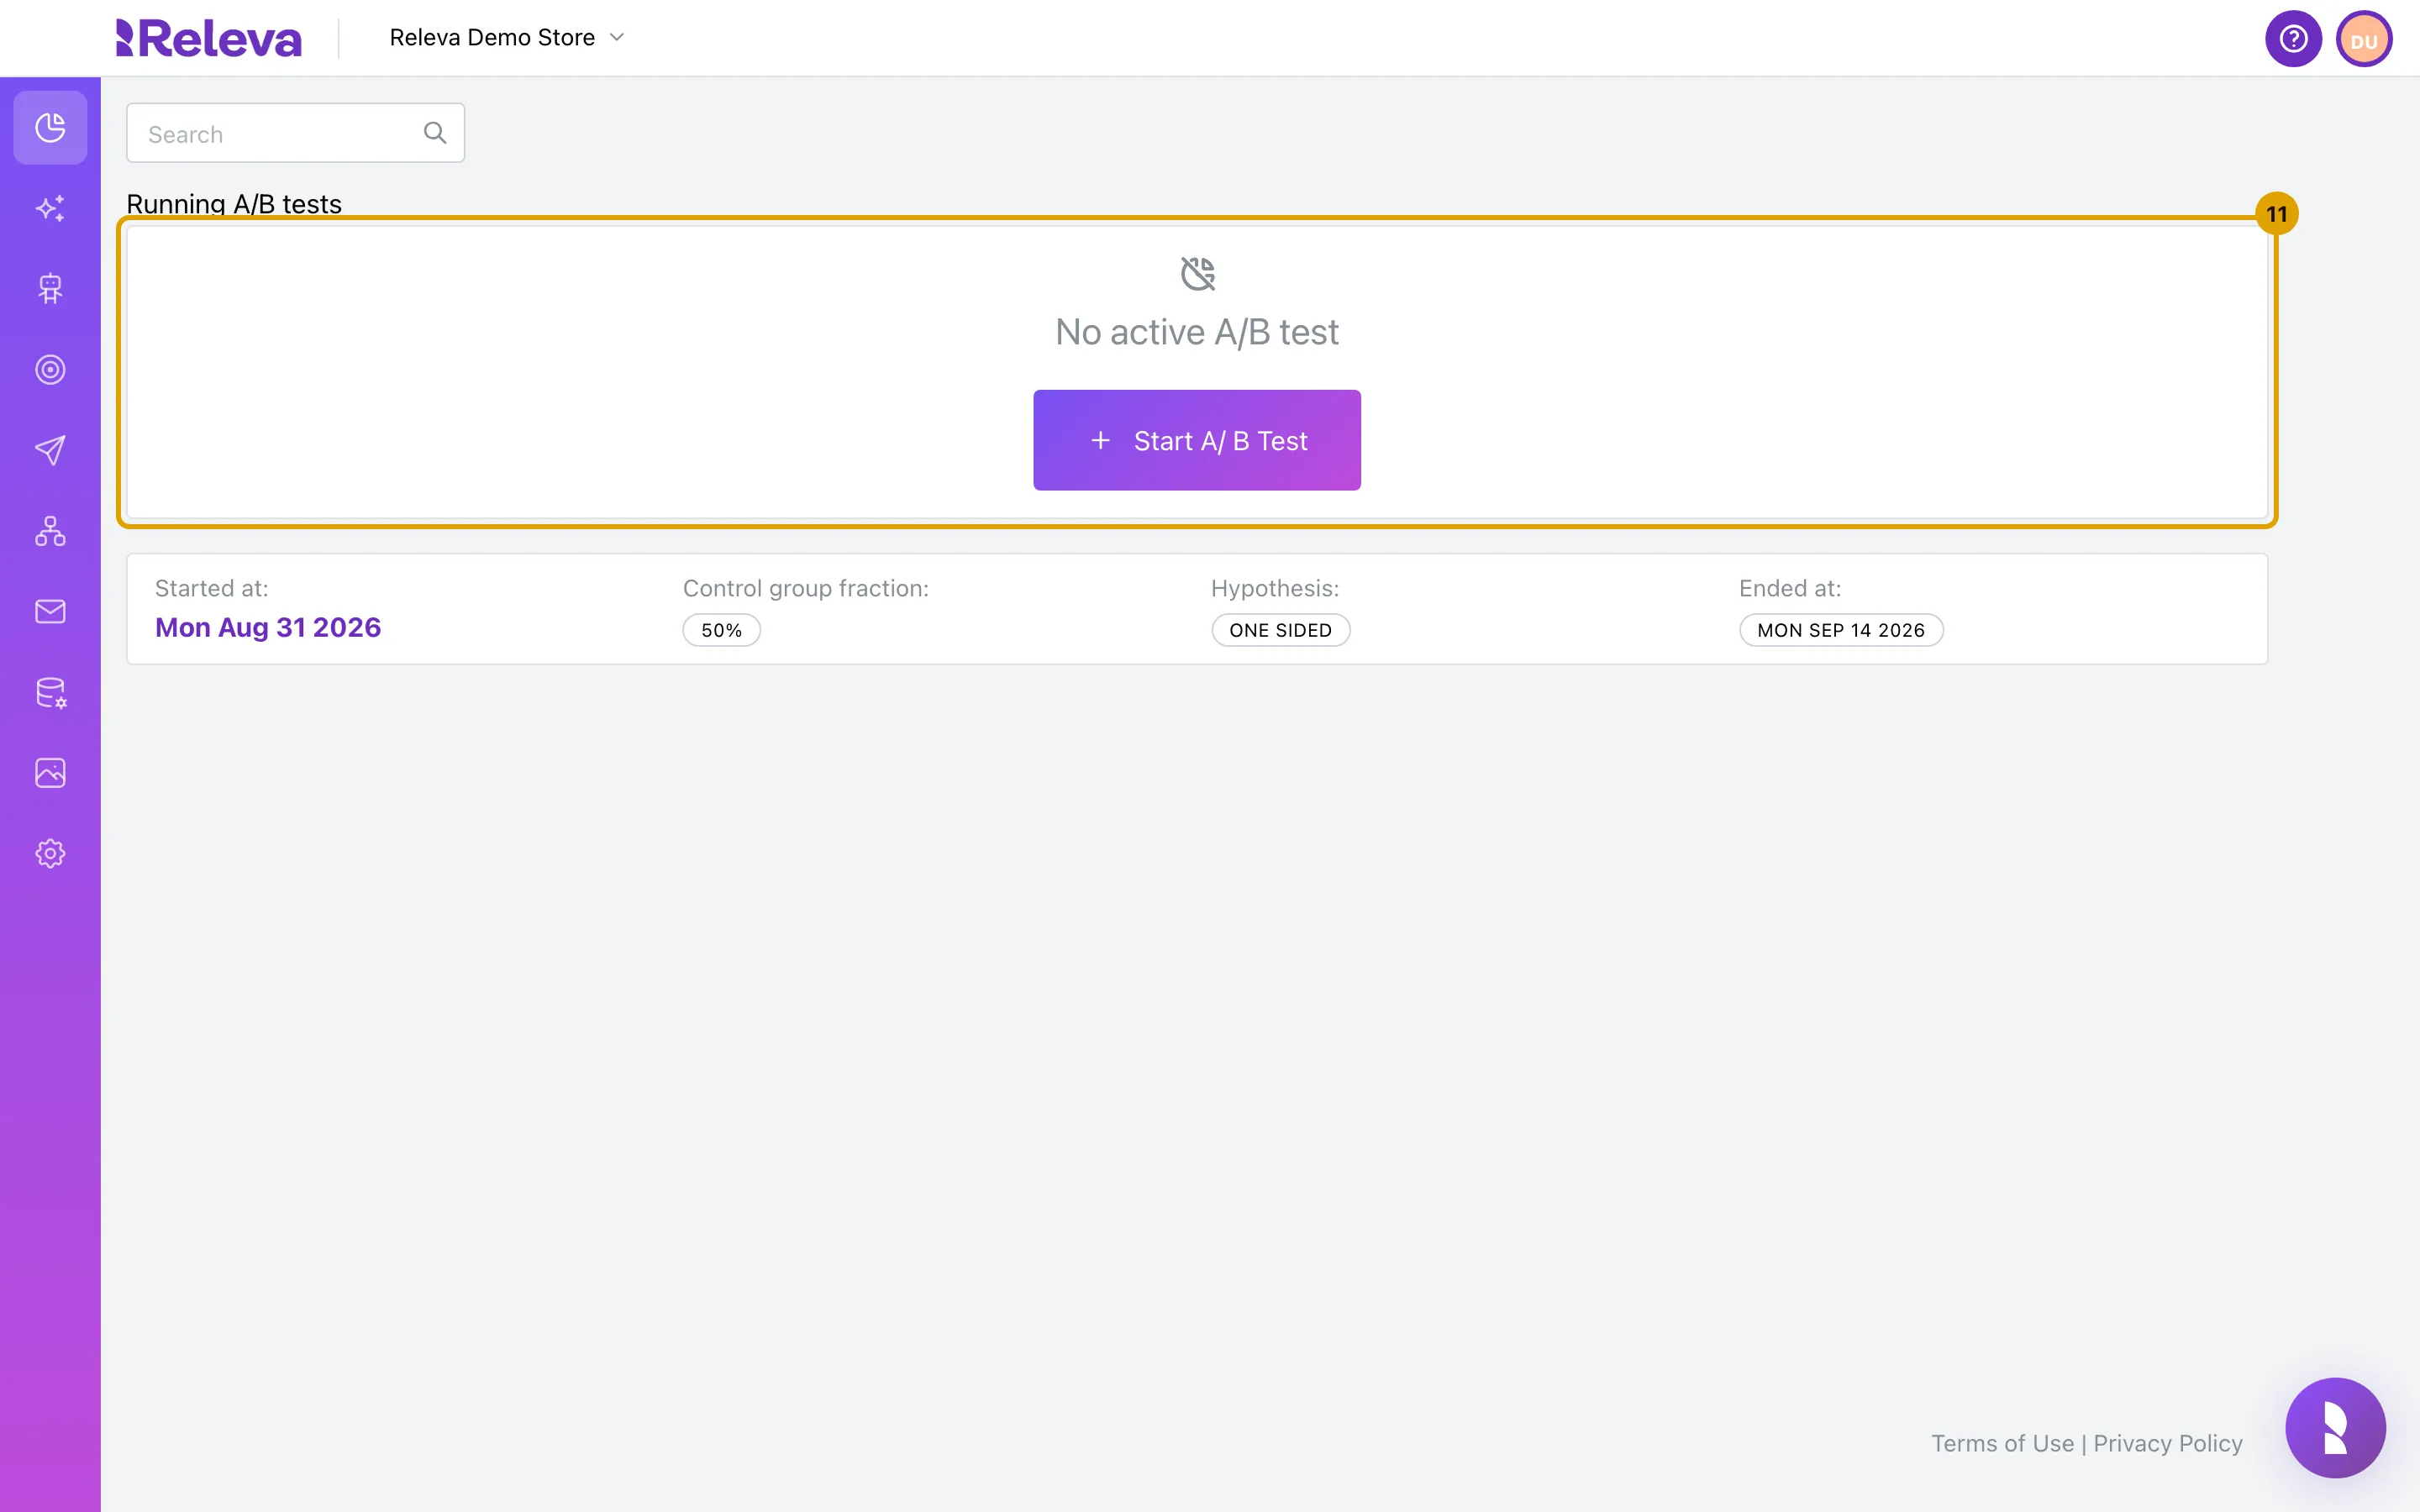
You are back on A/B Tests. Running A/B tests shows No active A/B test and Start A/ B Test is enabled again.
Check it worked
Section titled “Check it worked”- After you stop the test, its header reads A/B Test period: <start date> - <end date> and the button row shows Back and a red Delete.
- On A/B Tests, Running A/B tests shows No active A/B test and Start A/ B Test is enabled again. A stopped test you kept is listed below with Ended at: today’s date; a deleted test is gone.
- Every visitor gets Releva again as soon as you confirm the stop.
Troubleshooting
Section titled “Troubleshooting”Everything reads 0, N/A %, 0.00 % and No Data. The test is younger than three days, or there was no traffic in the counted days. The first and the last day are never counted. Come back later.
Influence says “Test needs more data to reach significance” for every indicator, even with data. This is the text shown to all users except Releva staff, whatever the numbers. Use Status and Statistical significance instead; the percent change is in each indicator’s card under Change.
I see only five indicators. Purchases By Group and Average Order Value By Group are shown to Releva staff only. The five indicators everyone sees are Product Views By Group, Revenue By Group, Page Views By Group, Time On Page By Group and Scroll Depth By Group.
Time On Page and Scroll Depth stay at No Data while page views have numbers. These two come from the SDK’s page engagement events. A storefront whose SDK does not send them has no values here.
The page shows “Cannot read properties of null (reading ‘periodStart’)”. The link points at a test that no longer exists, for example one that was deleted. Go back to A/B Tests and open a test from the list.
I stopped the test by mistake. It cannot be restarted. Start a new test with the same settings; the old results stay on the ended test’s details page.