

Check how your store is doing
Analytics › Dashboard is where you see what your store took in a period and how much of it Releva took part in. This guide picks a period, reads the At a Glance tab, opens the orders behind the attributed figure and then looks at the other seven tabs. For what “attributed” means, read How analytics works. For every card and tile, read What each Analytics metric means.
Before you start
Section titled “Before you start”- Your shop sends events and orders to Releva. Every figure on the dashboard is computed from tracked events, so a shop with no events shows zeros and empty charts. See How events get into Releva.
- Your plan includes analytics. If Dashboard and Customer Insights show a lock in the sidebar, ask your account owner to unlock them.
- Know which period you want to compare. Every figure is compared with the period of the same length that ends the day before your start date.
-
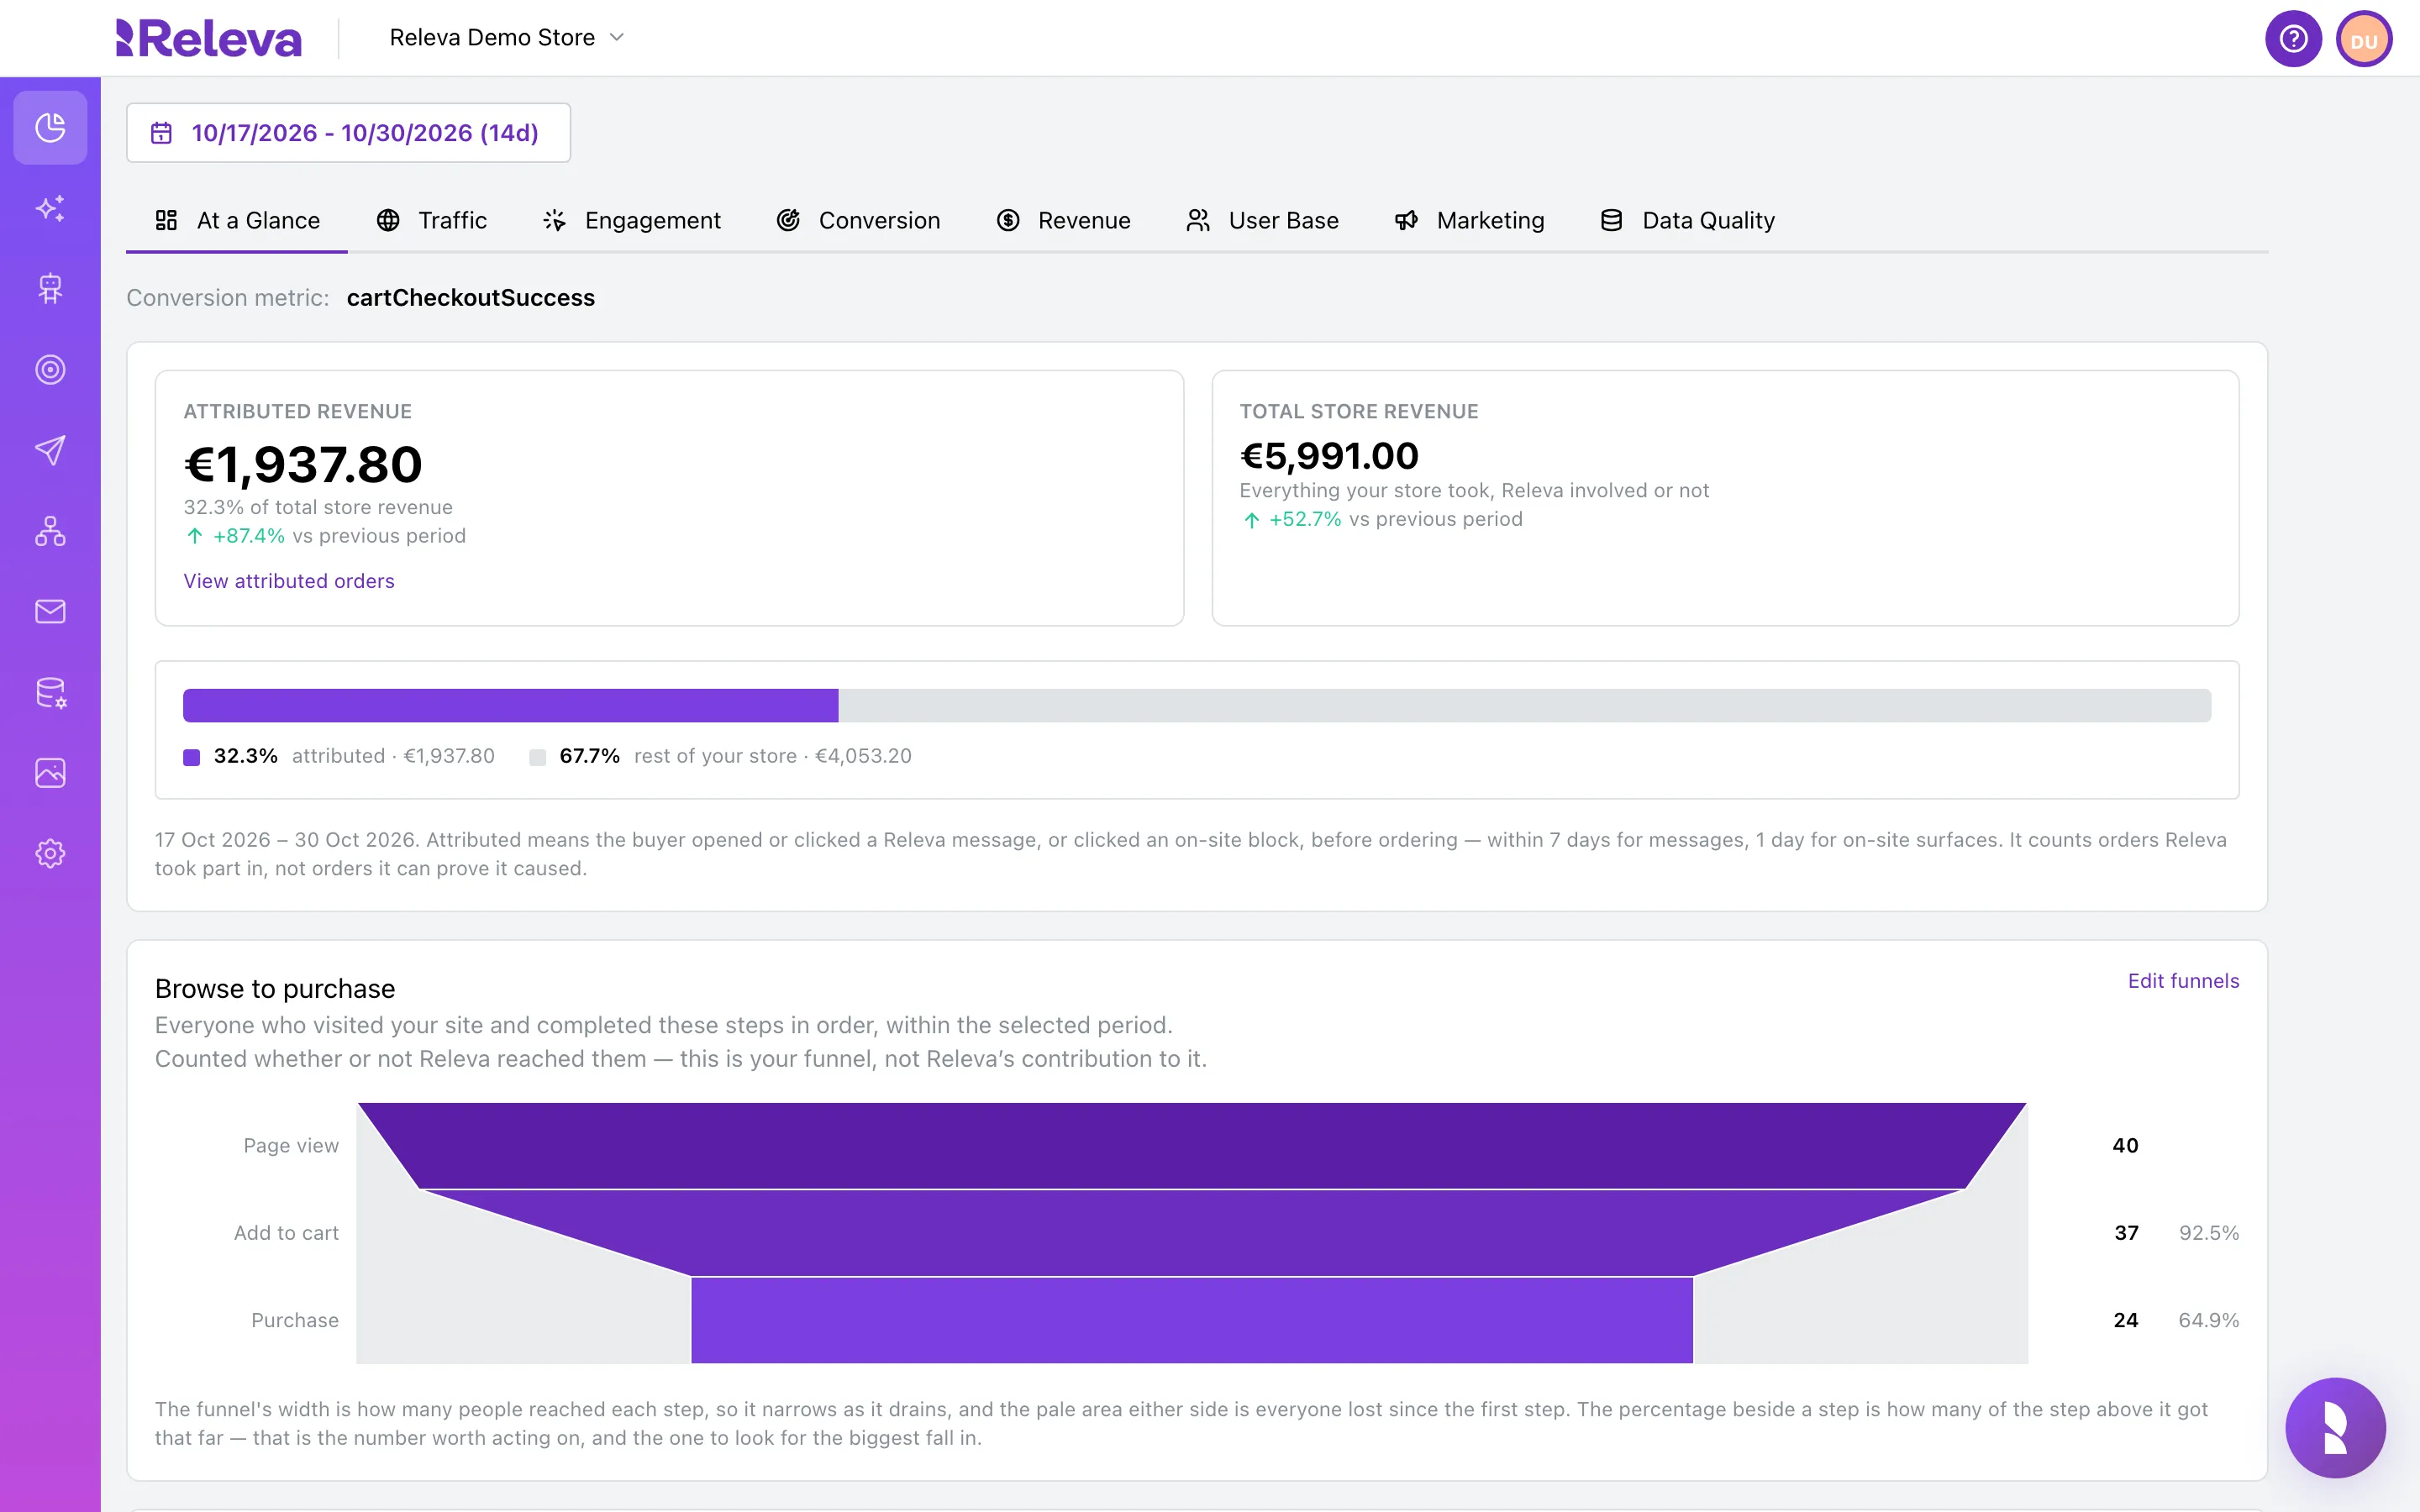
Go to Analytics › Dashboard. The At a Glance tab opens with the last 14 days.
The line Conversion metric: above the tiles names the event your shop counts as a purchase.
-
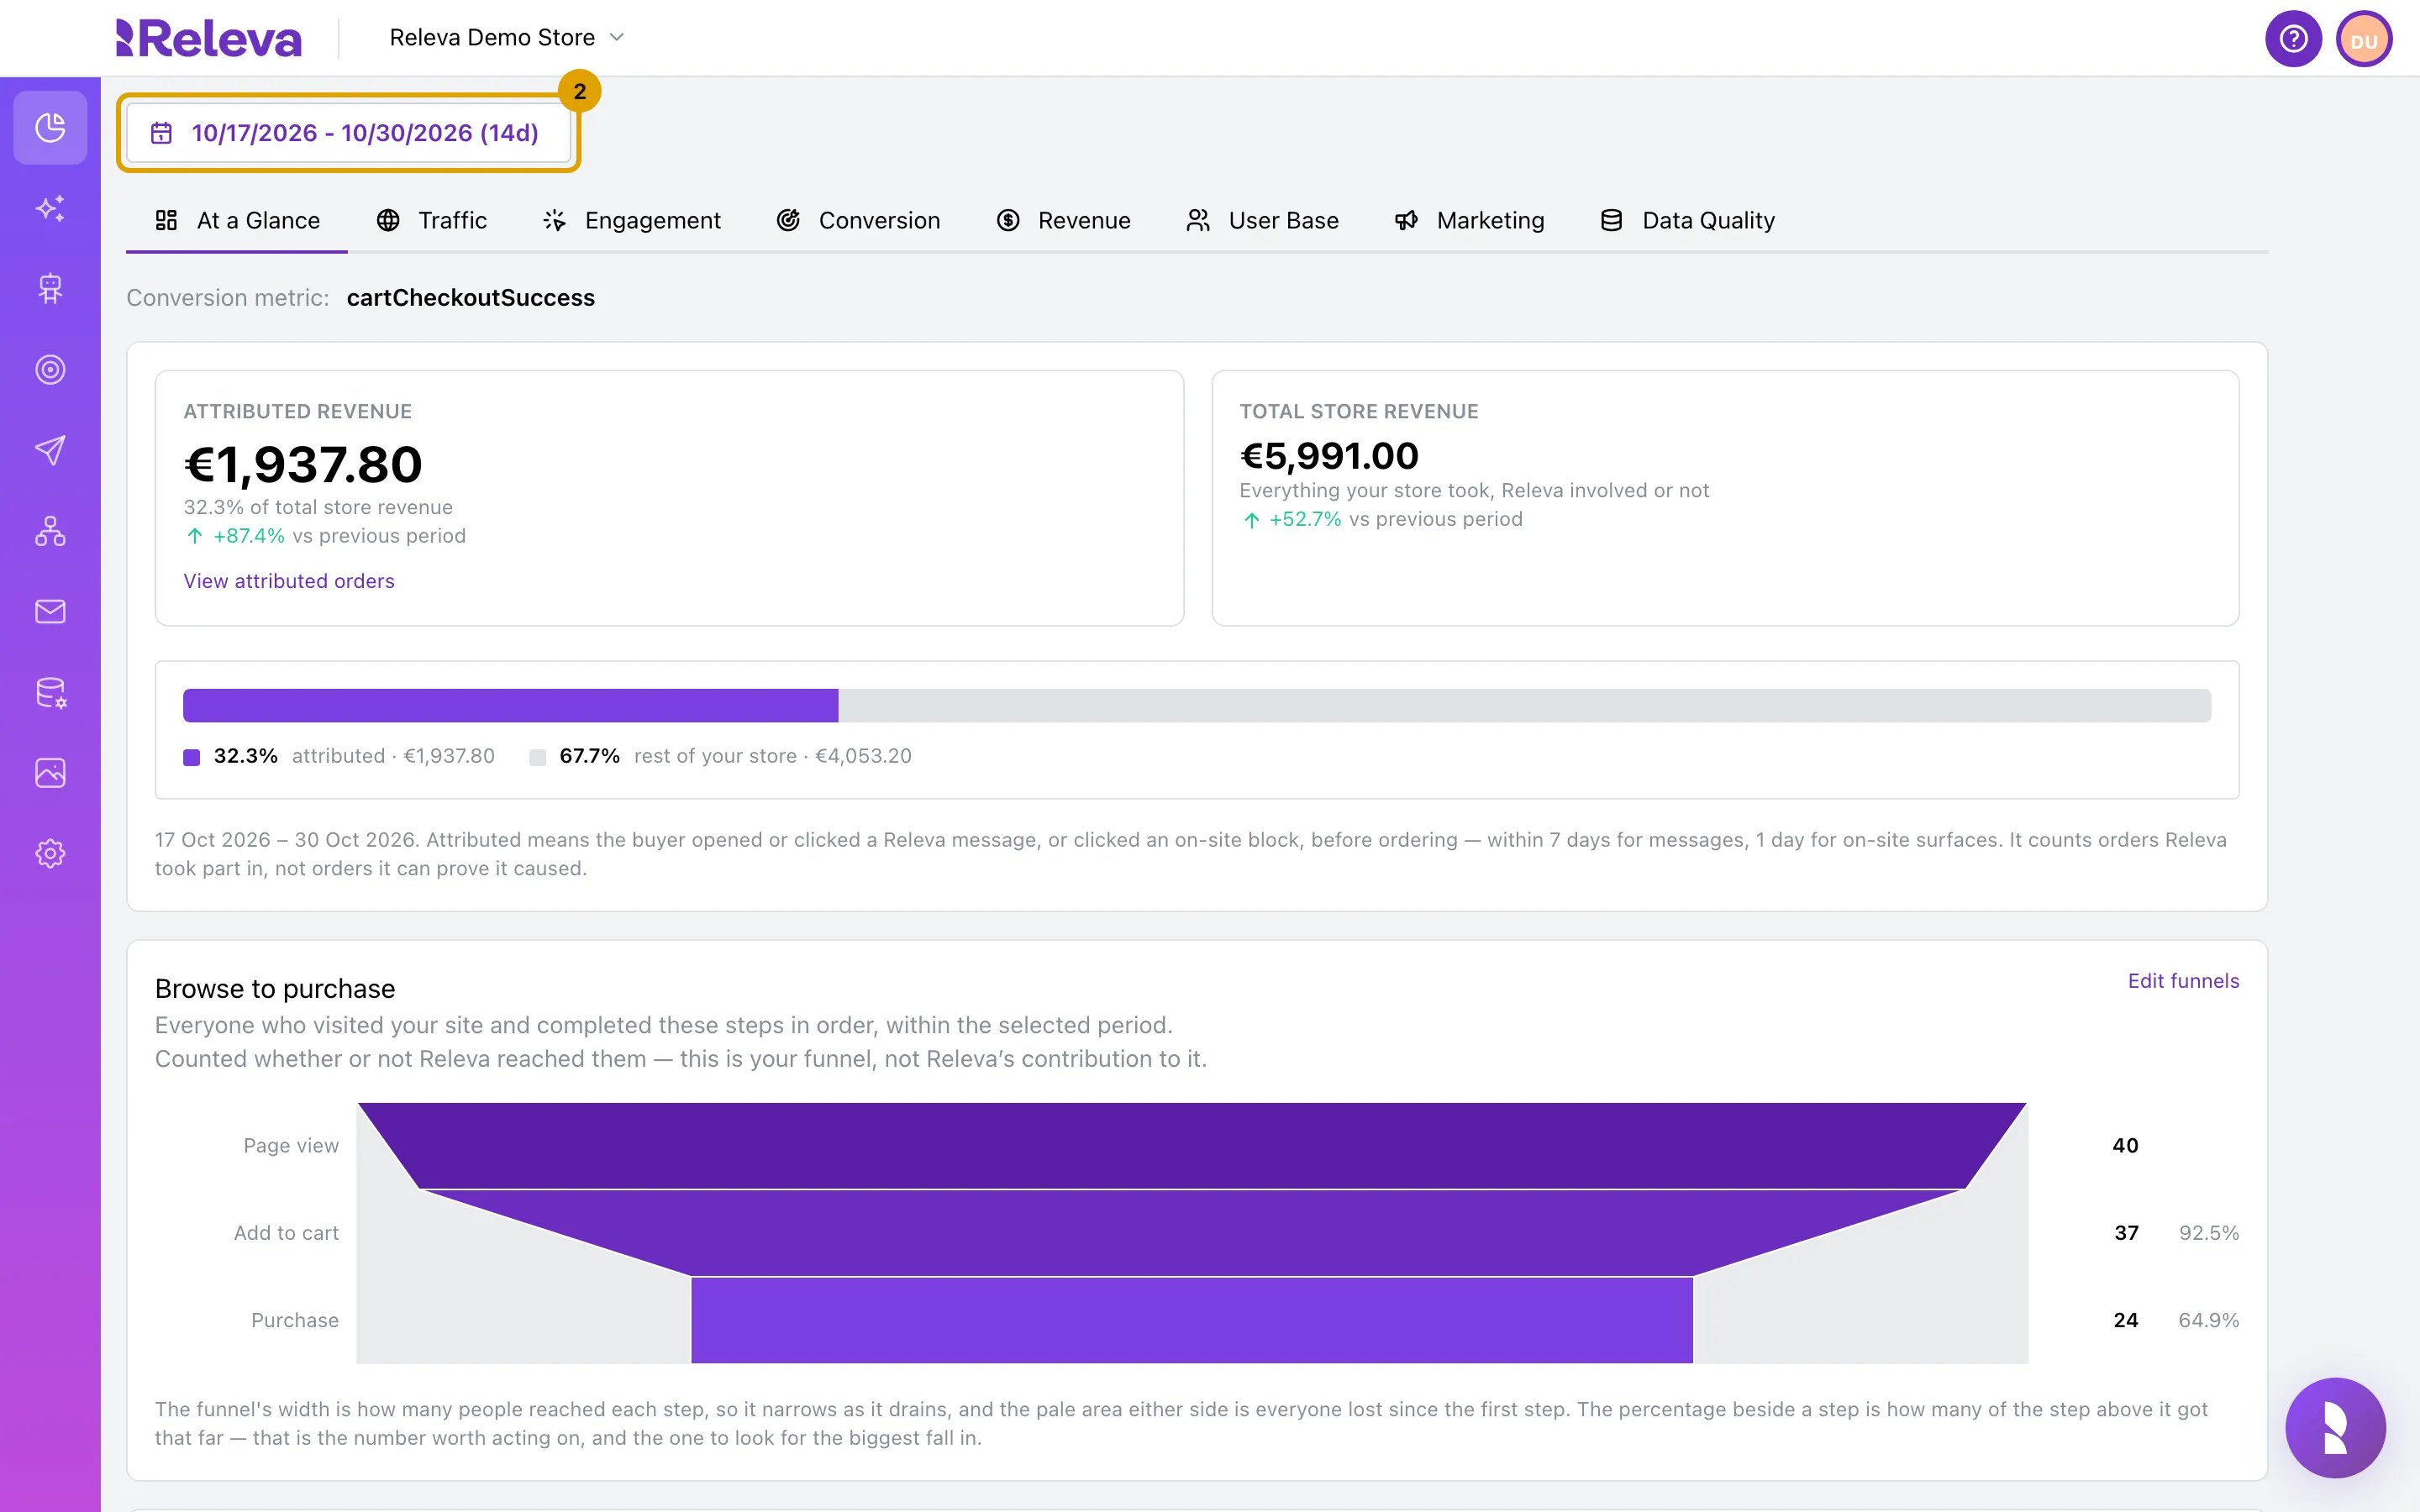
Select the date range above the tabs
-
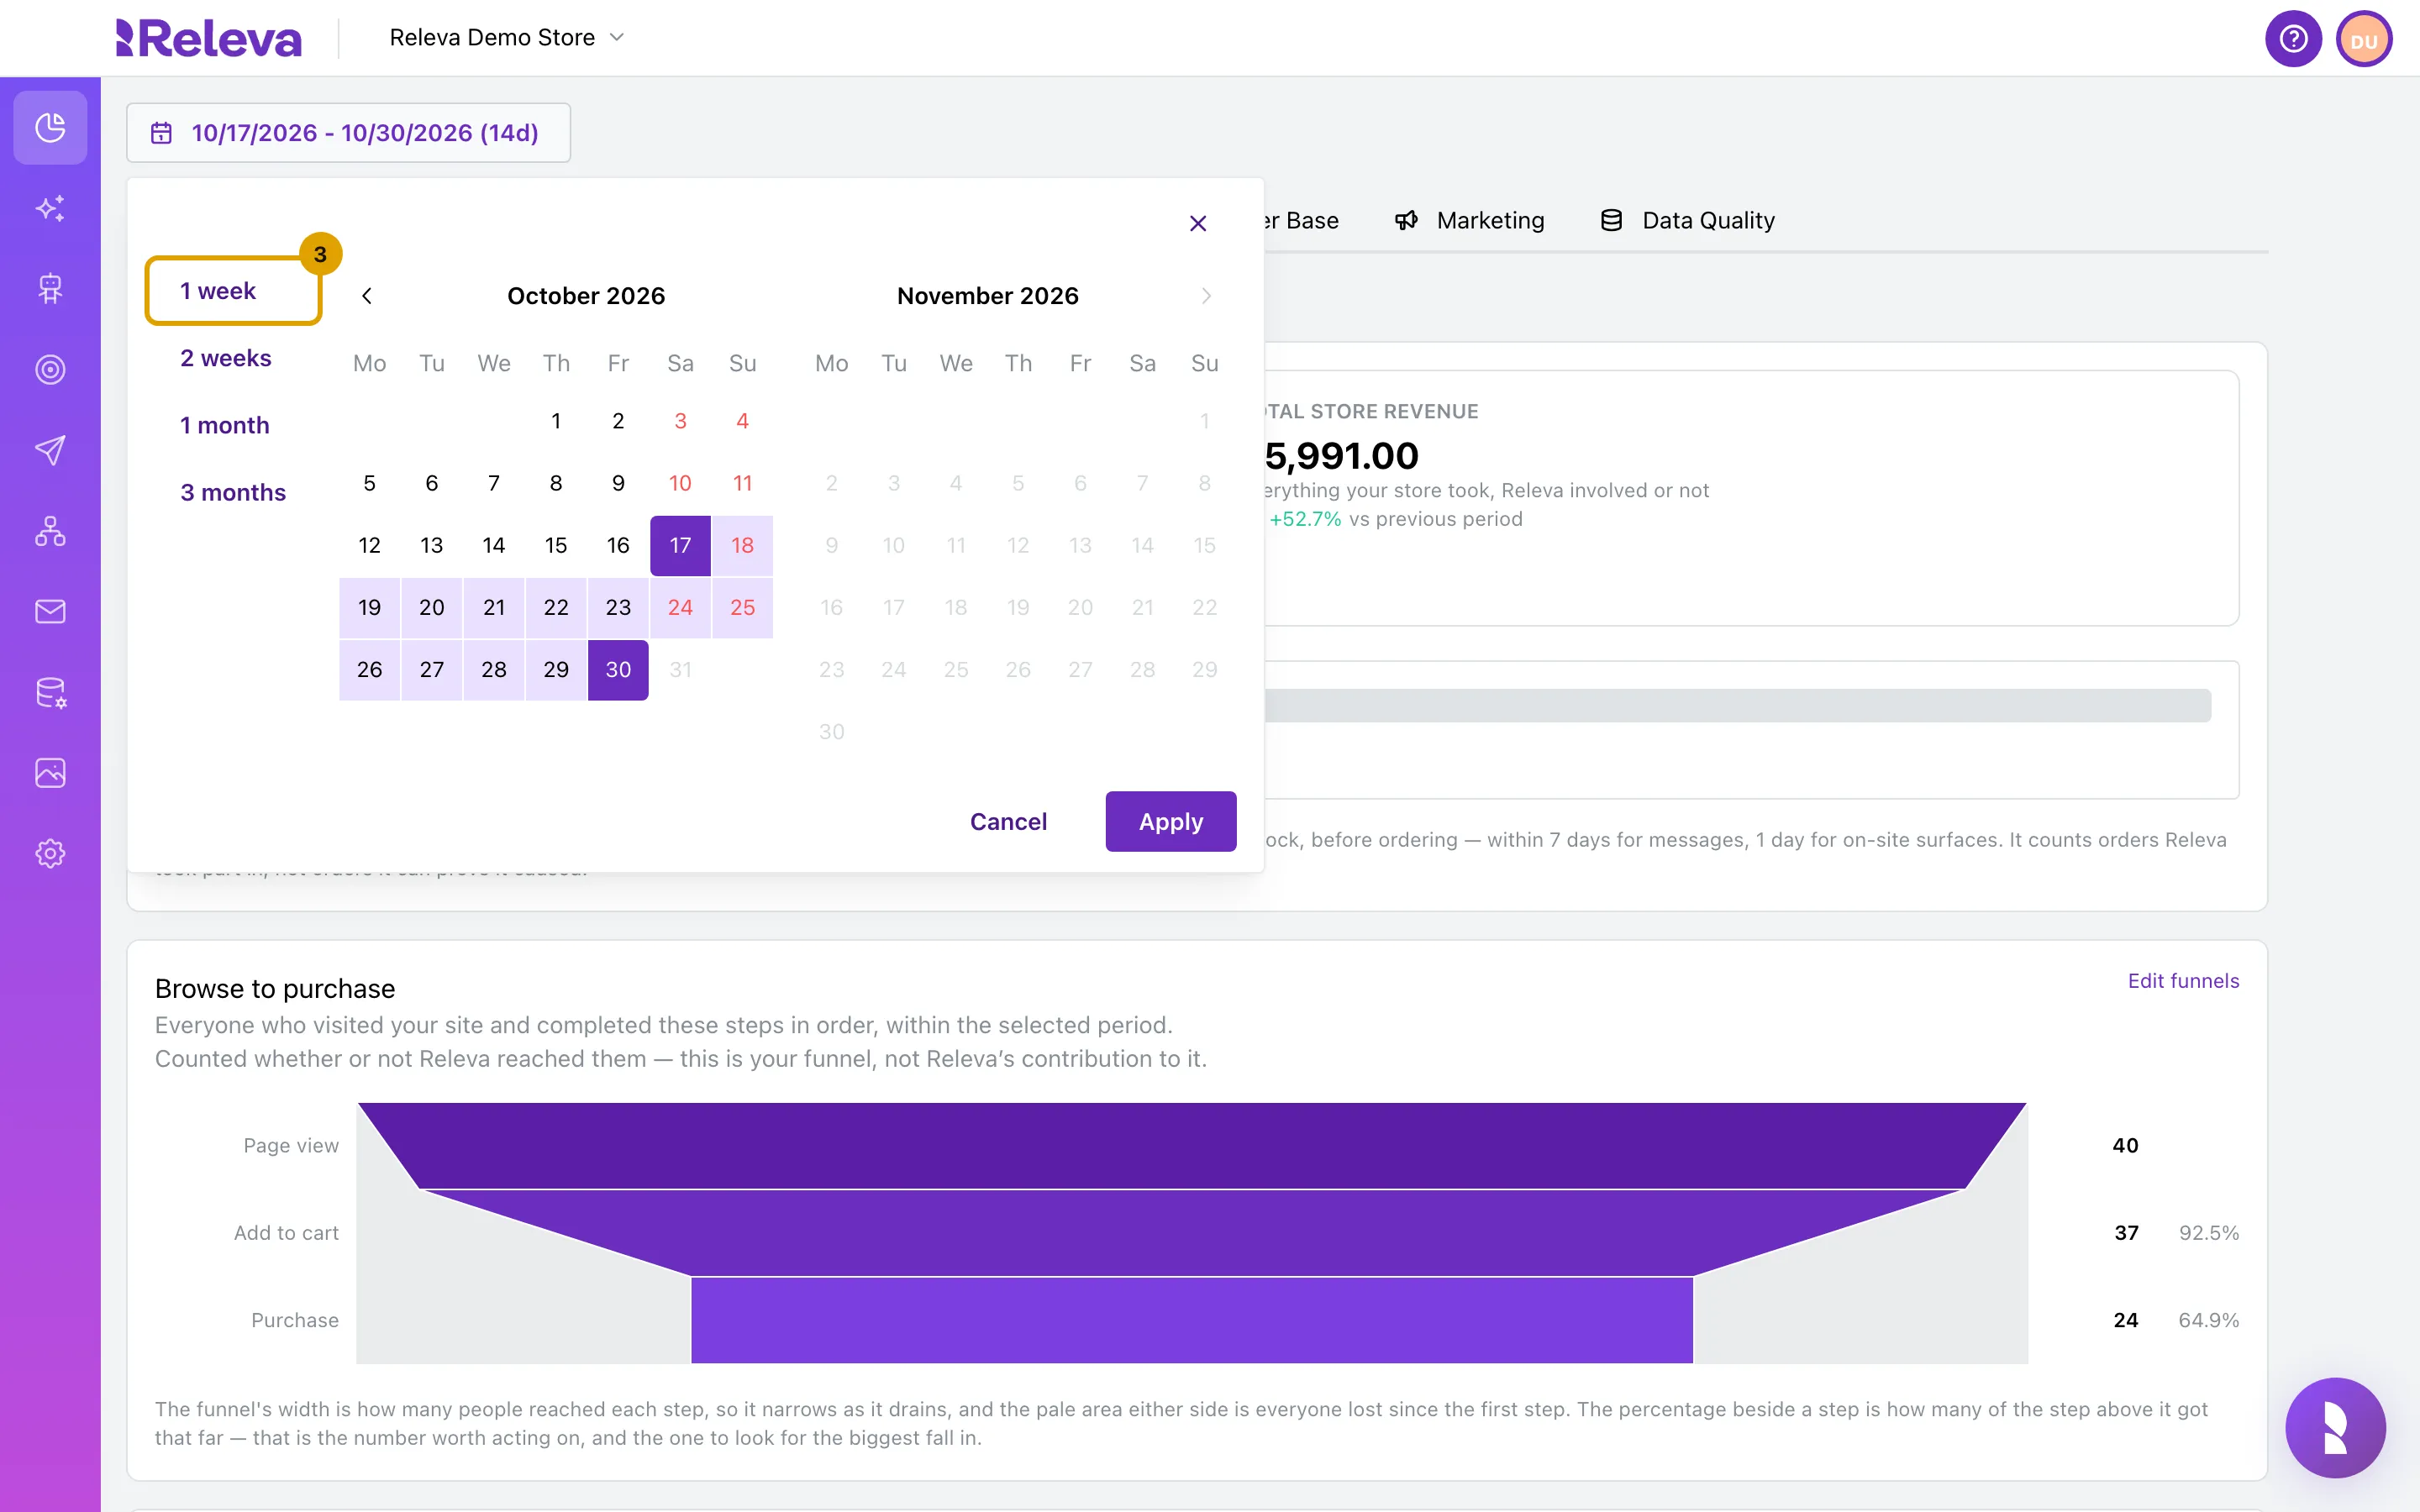
Select a preset such as 1 week, or pick a start and an end day in the calendar and select Apply
The presets 1 week, 2 weeks, 1 month and 3 months apply at once. Apply stays disabled until you have picked an end day. Future days cannot be selected.
-
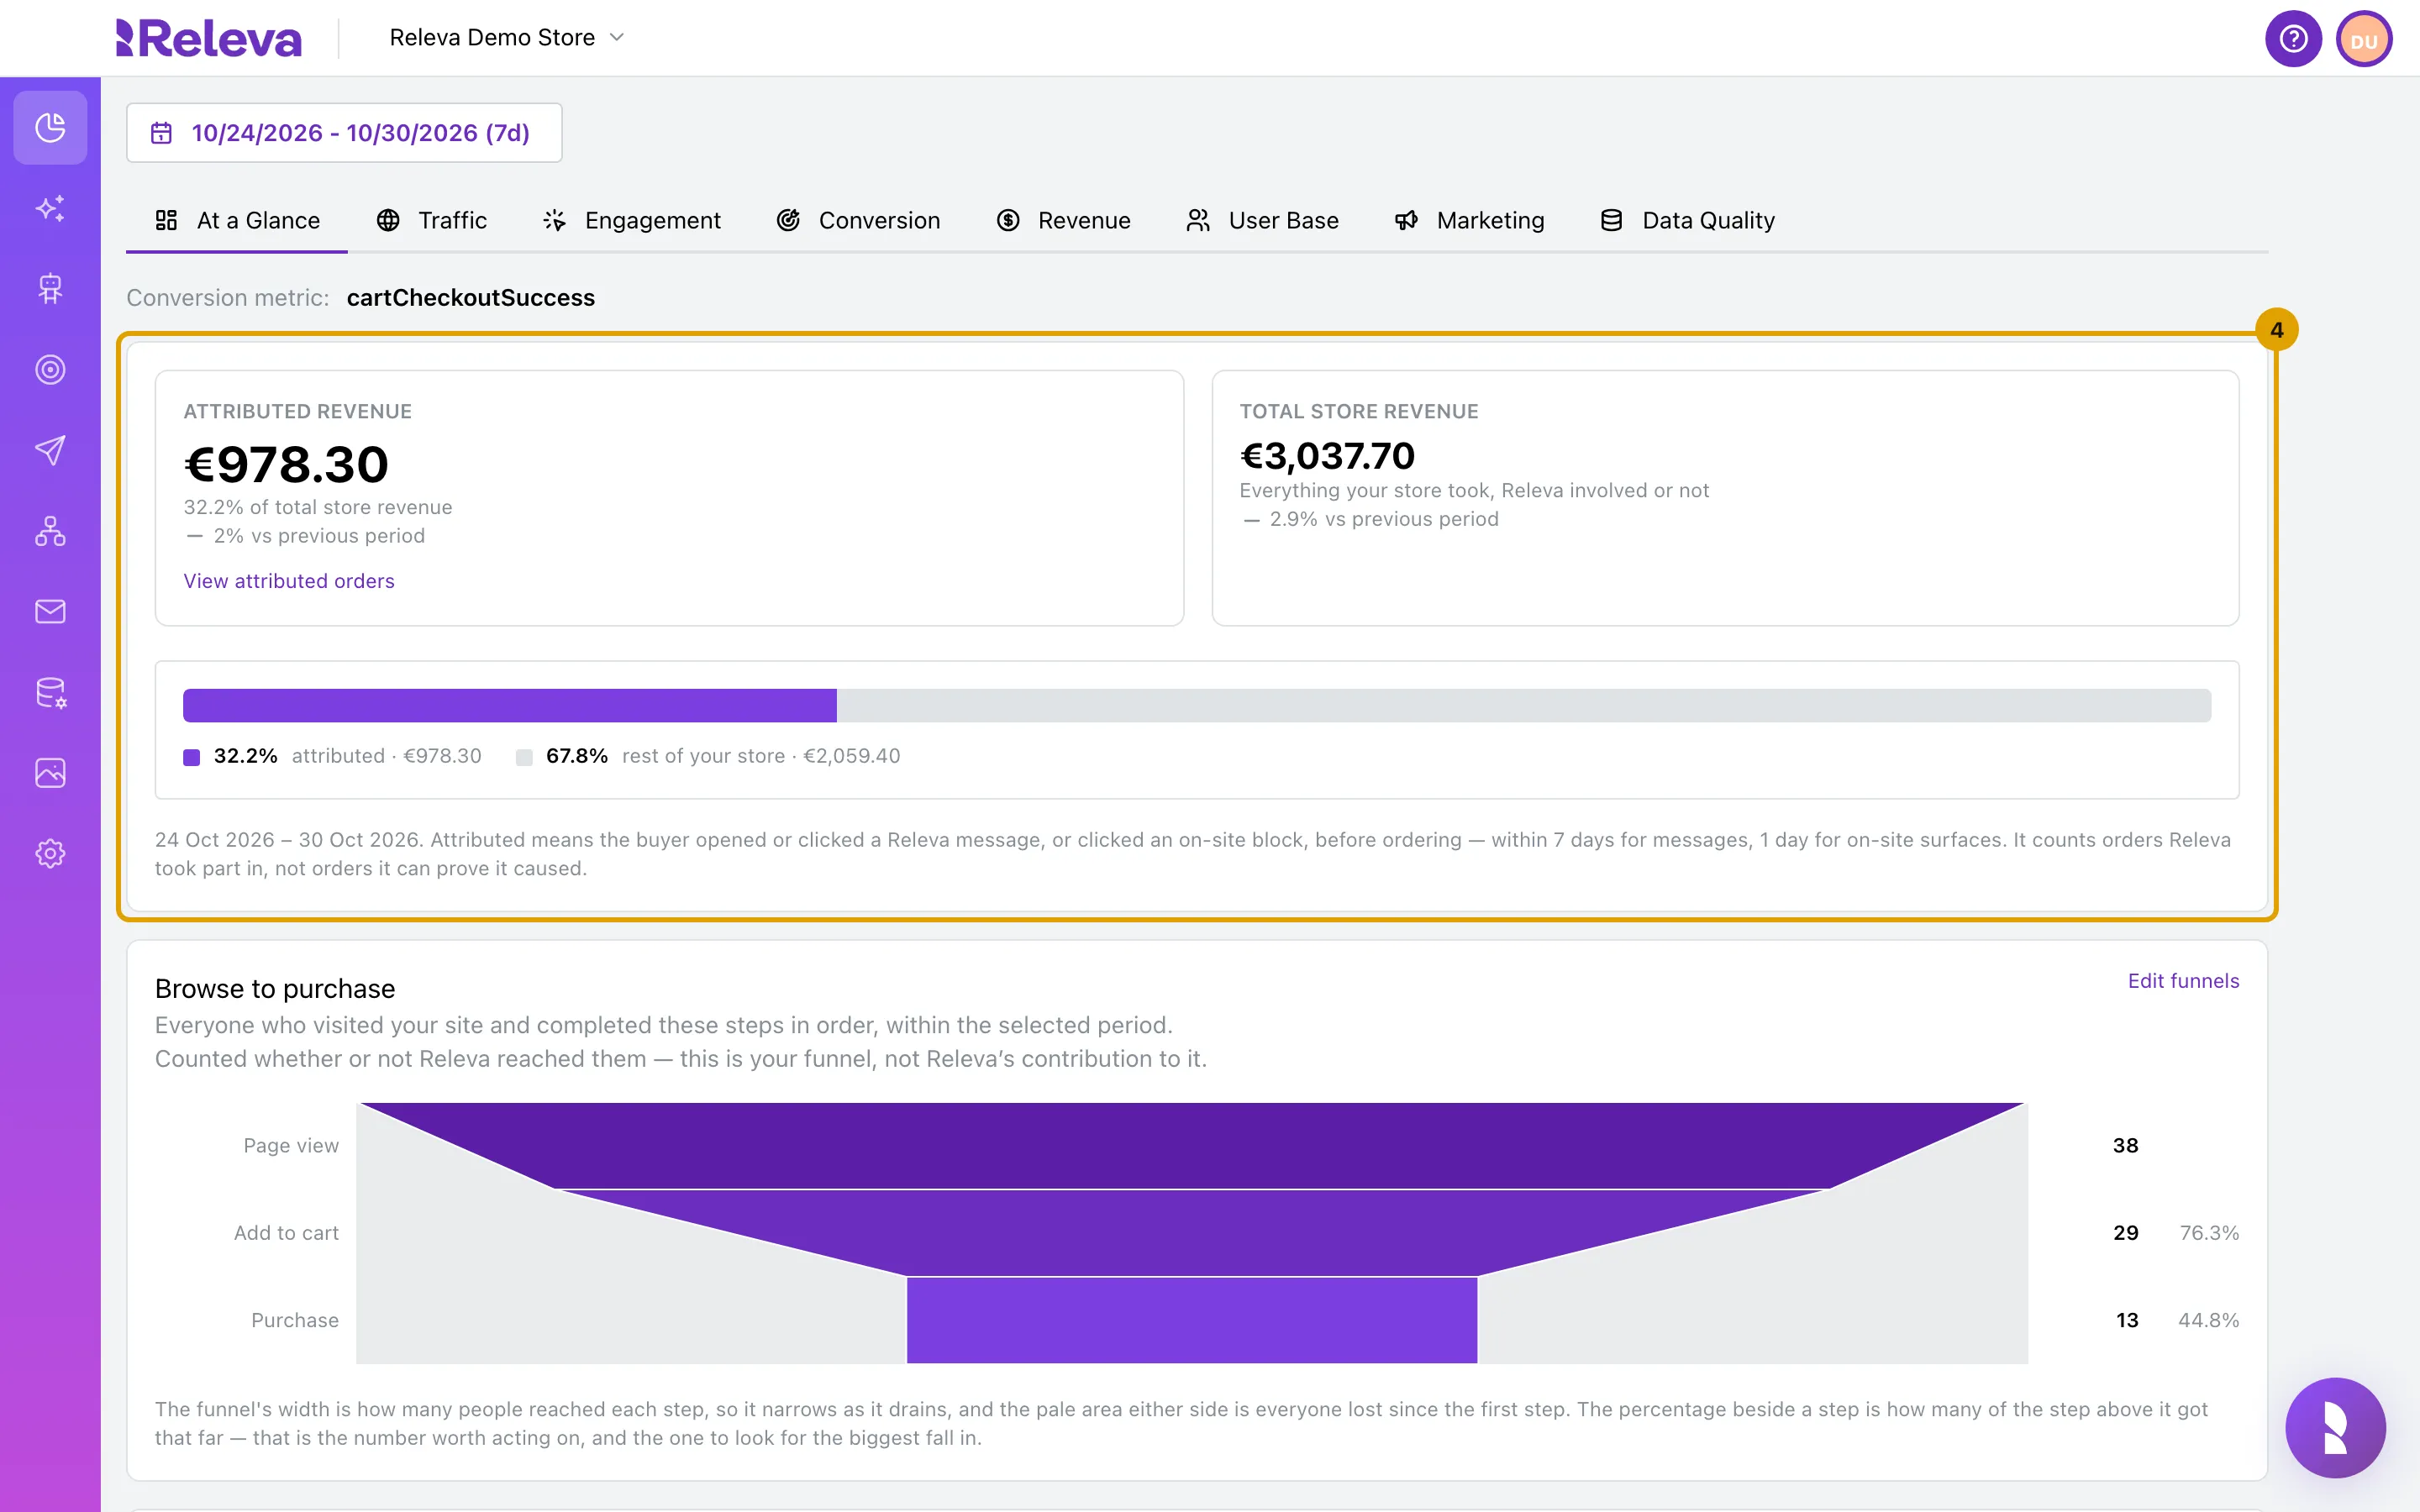
Attributed revenue is what Releva took part in. Total store revenue is everything your store took. Each tile compares the period with the one before it.
The bar under the tiles shows the attributed share of total revenue. The caption gives the dates and the attribution rule: within 7 days for messages, 1 day for on-site surfaces.
-
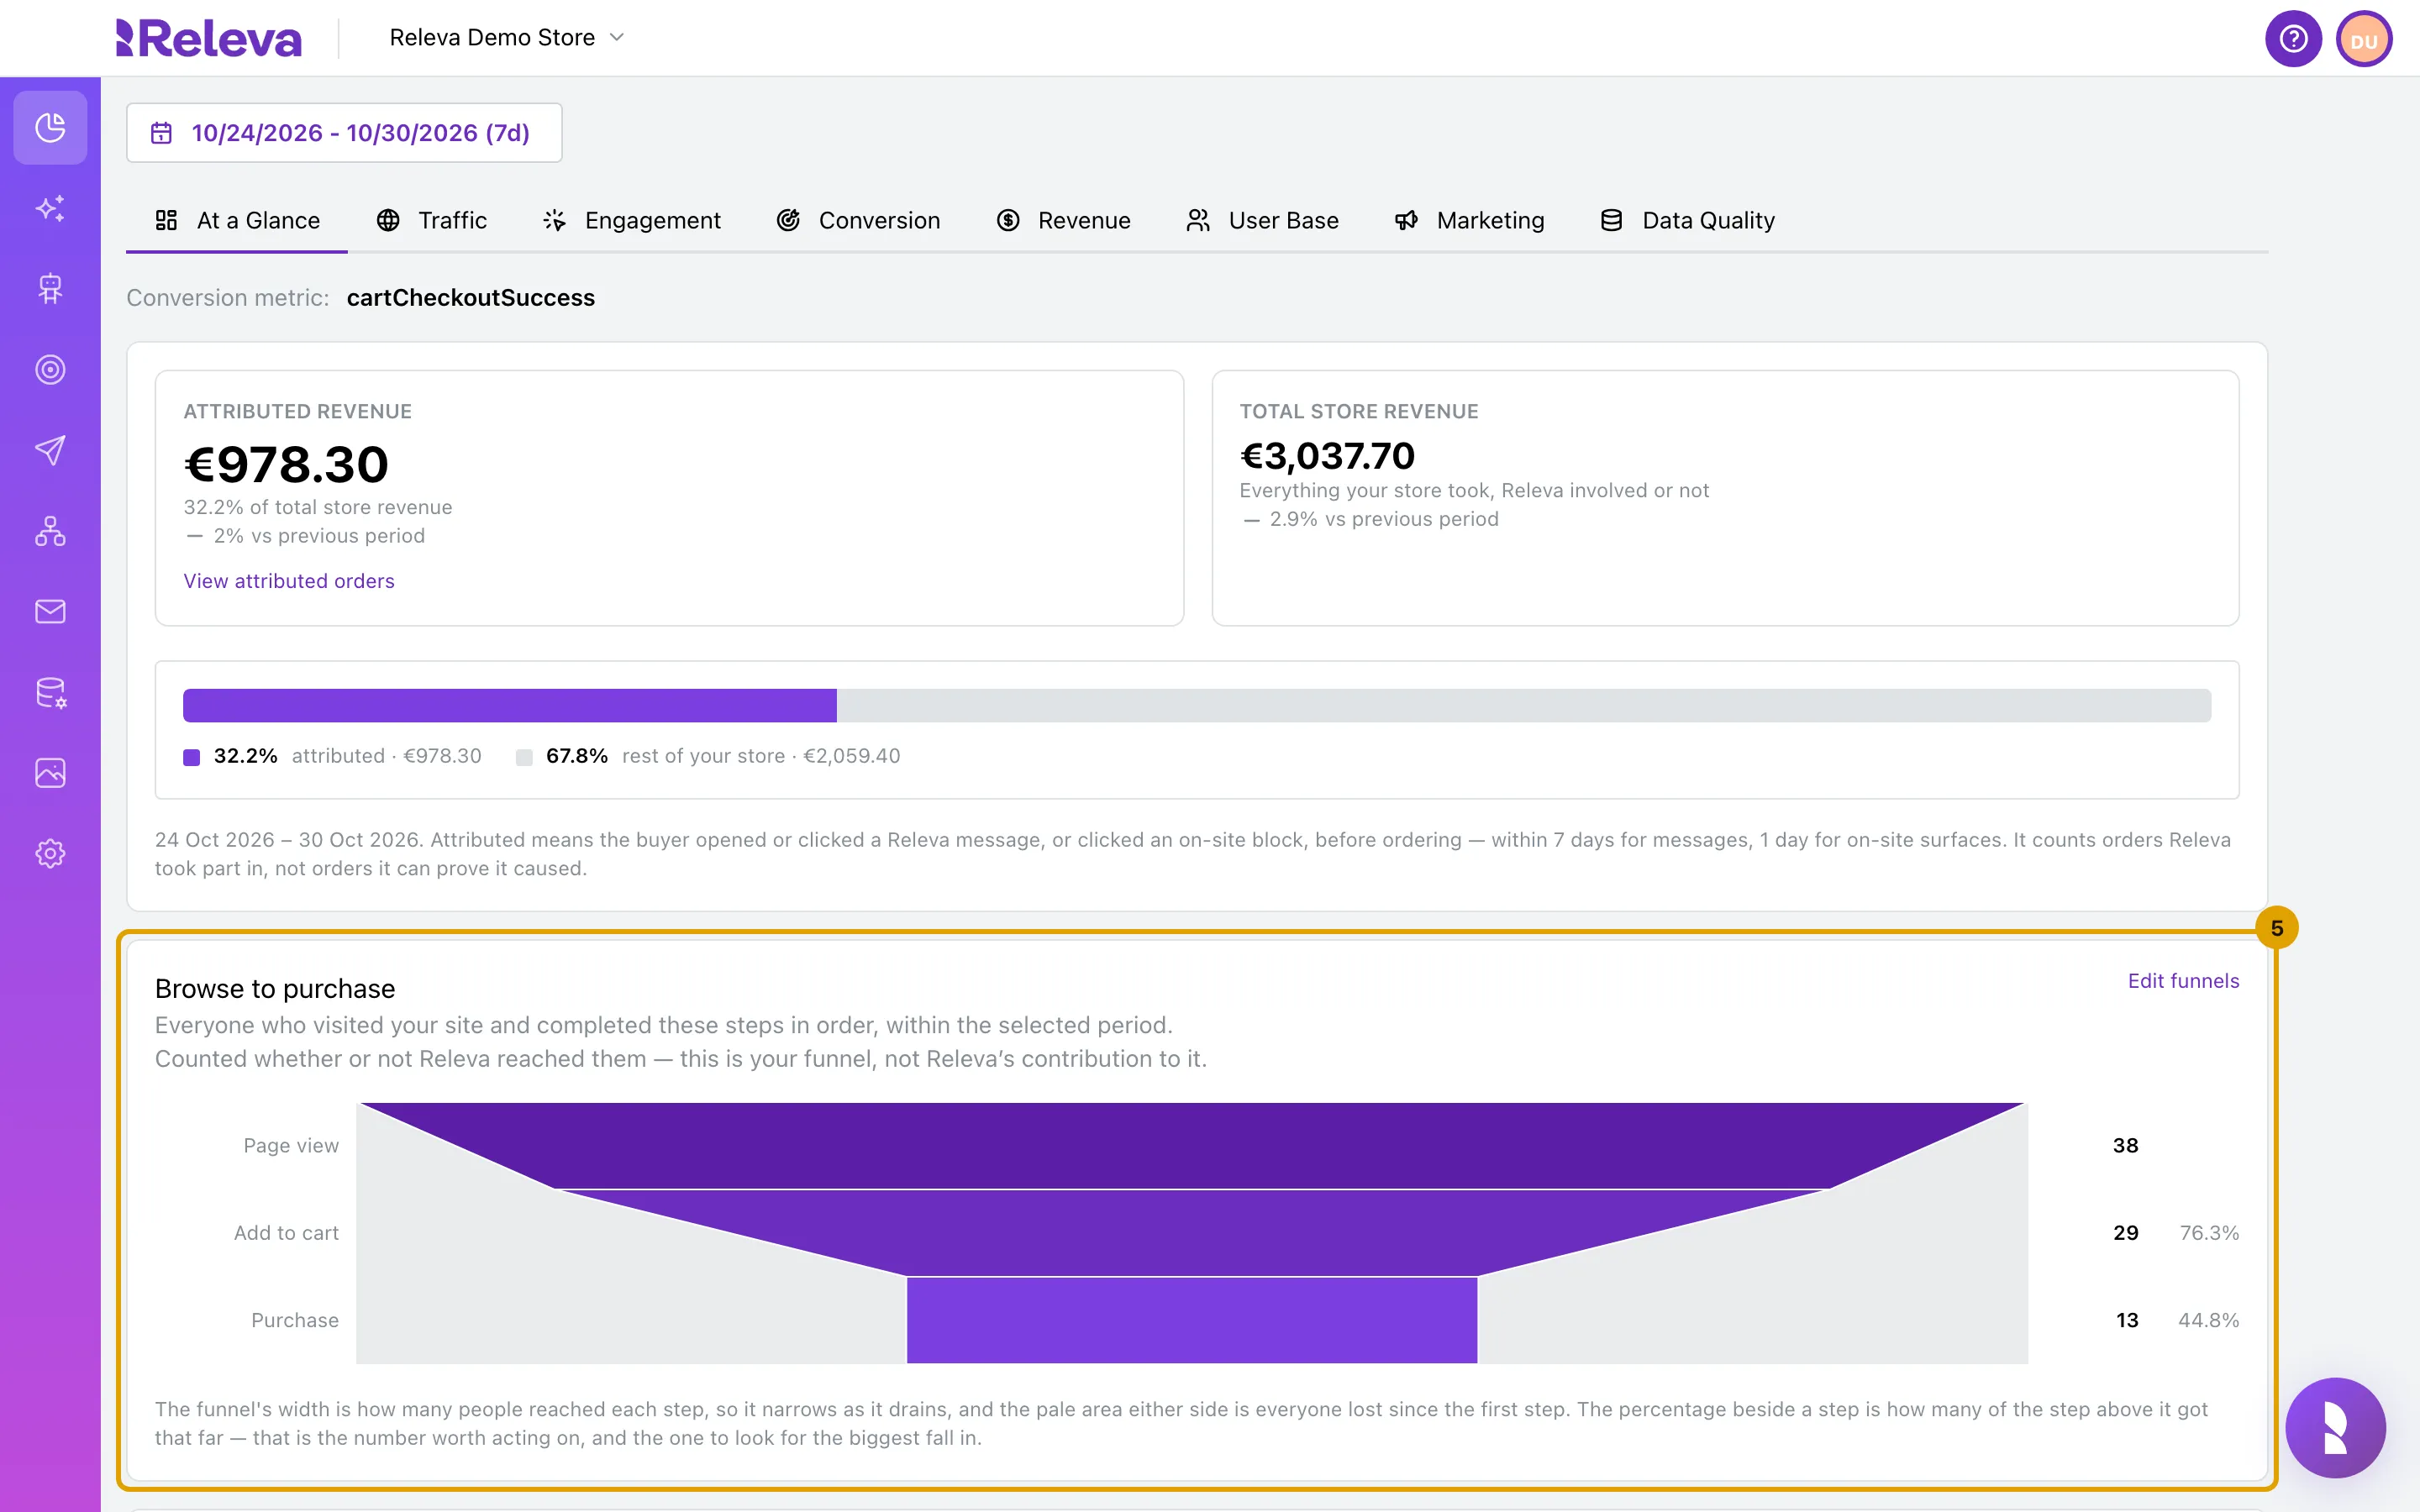
The funnel card shows how many people reached each step of your default funnel, and how many of the step above got that far
The card counts everyone, whether Releva reached them or not. Edit funnels opens Customer Insights › Funnels, where you can change the steps or create more funnels.
-
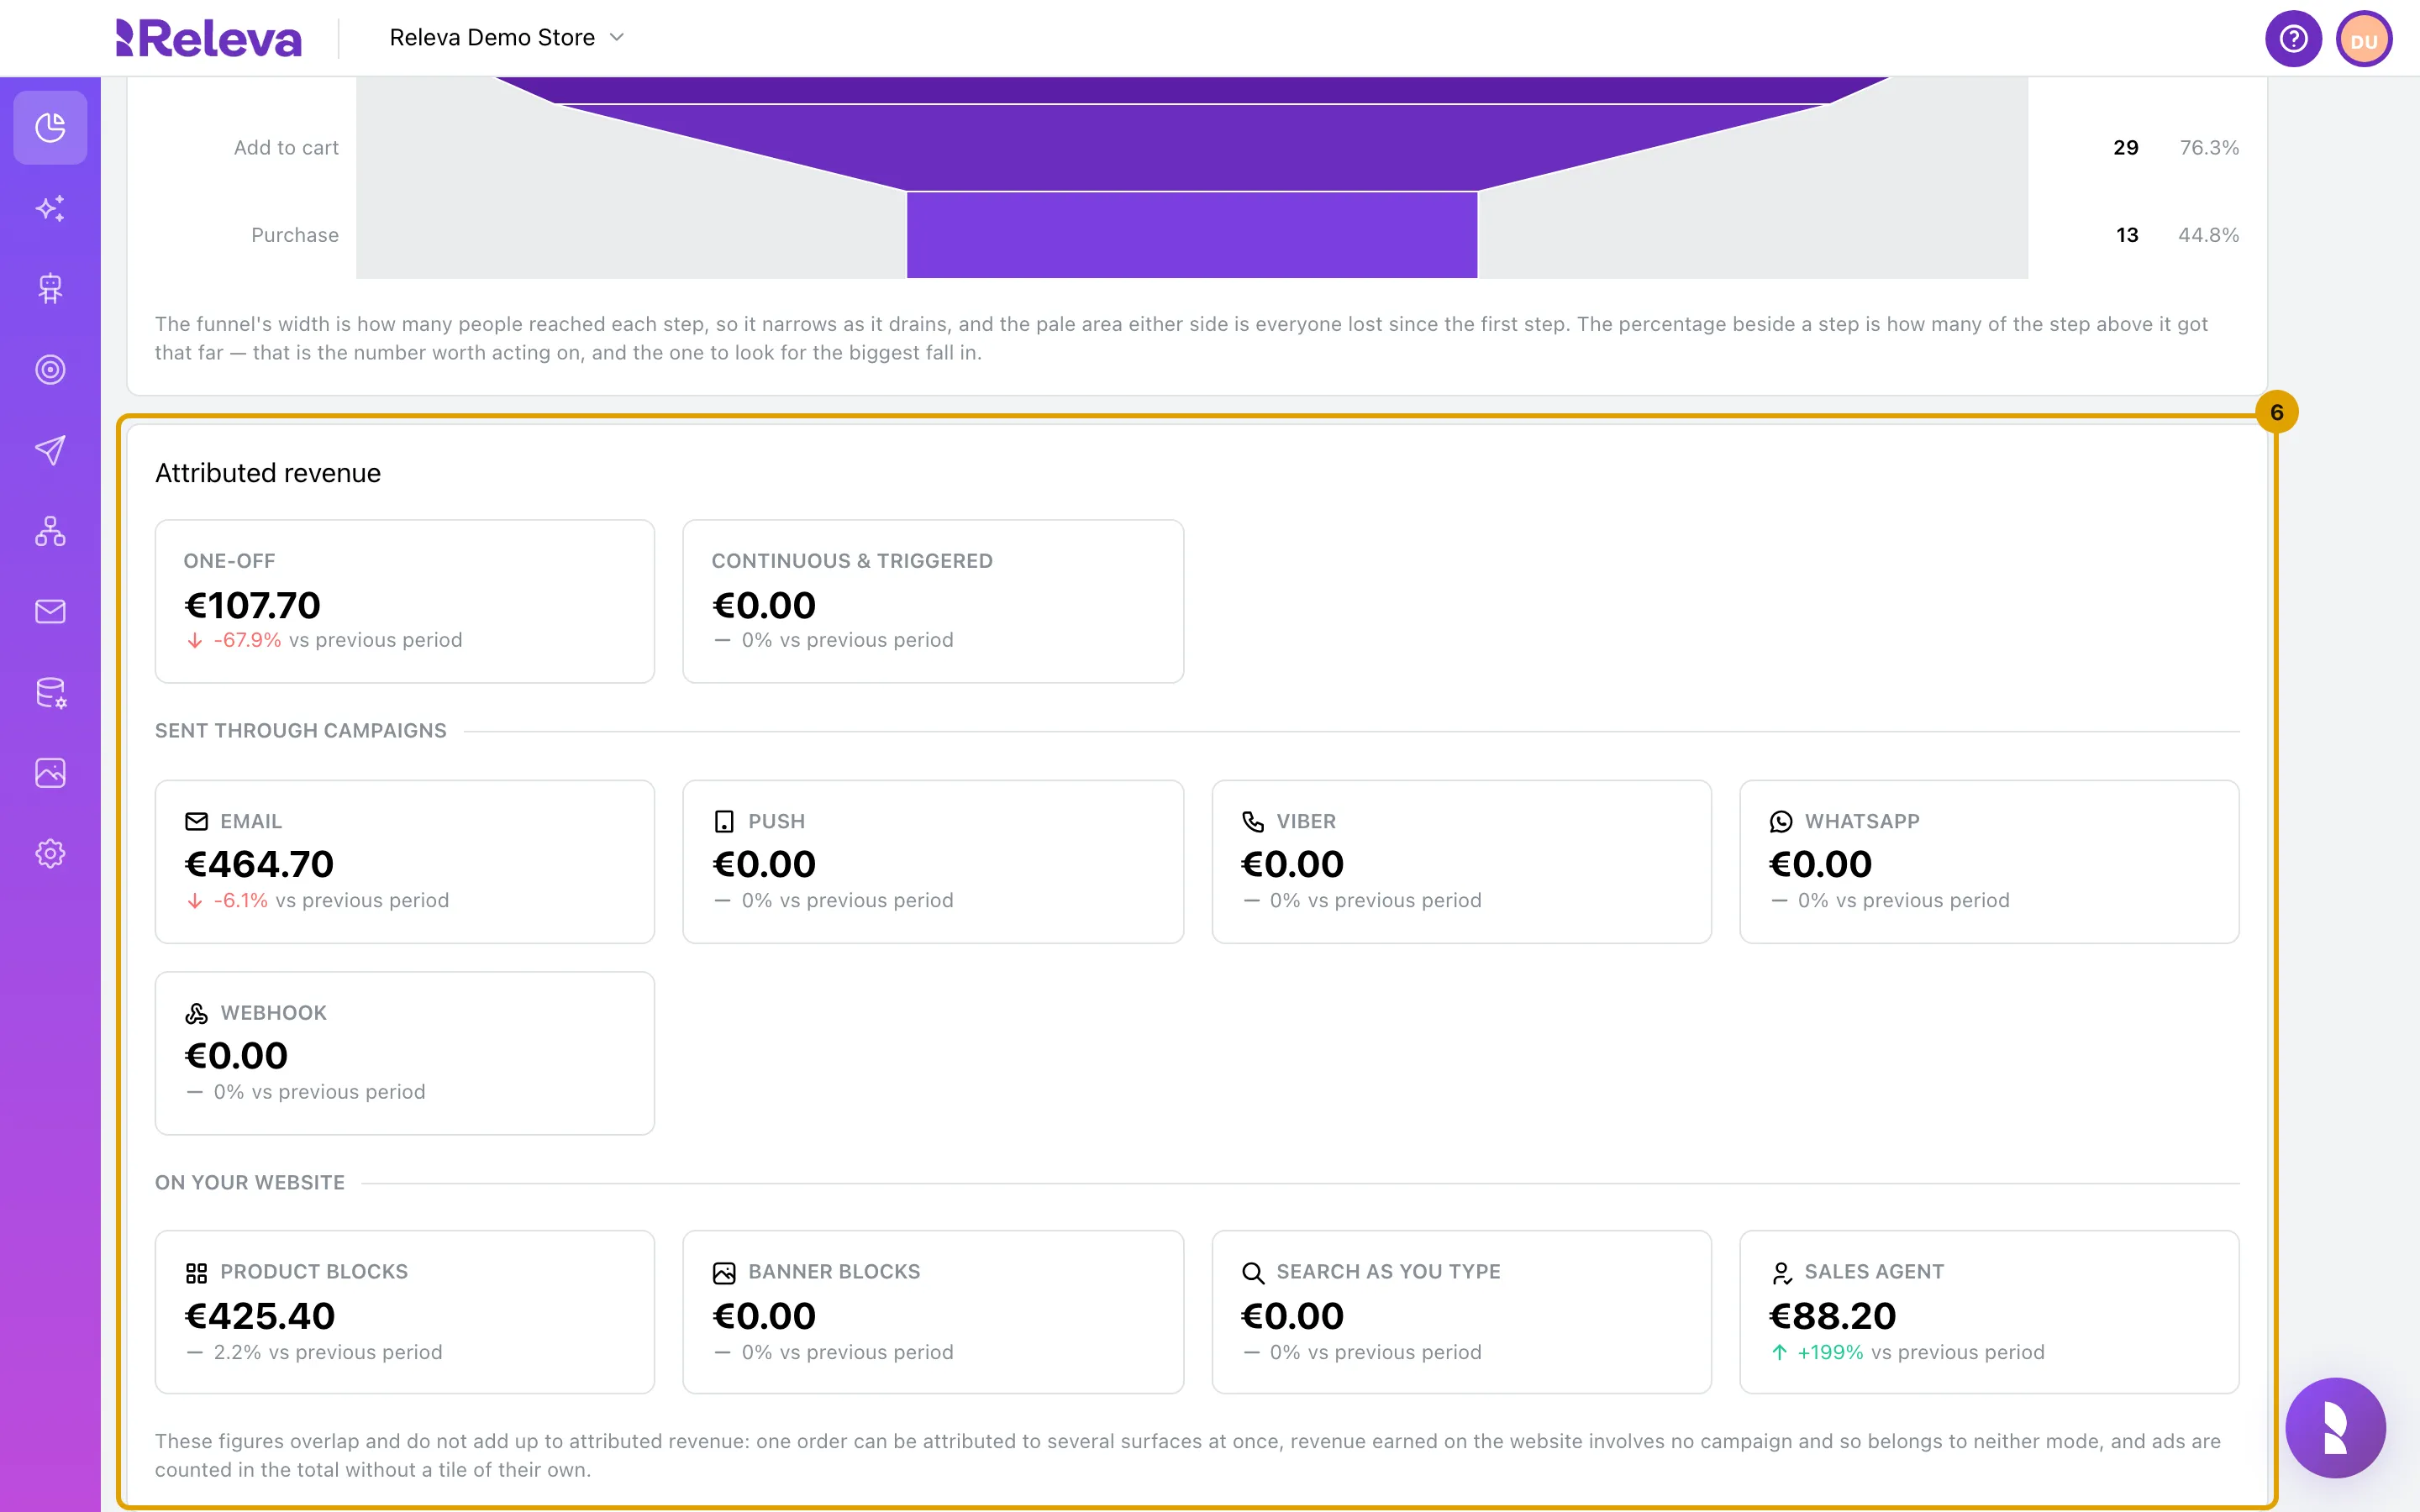
Attributed revenue splits the figure by campaign mode, by channel and by on-site surface. The tiles overlap, so they do not add up to the total.
One-off and Continuous & triggered are the campaign modes. Sent through campaigns has one tile per channel your shop has set up. On your website covers Product blocks, Banner blocks, Search as you type and Sales agent. Below the card, the tables rank the campaigns, product blocks and banners that earned the most.
-
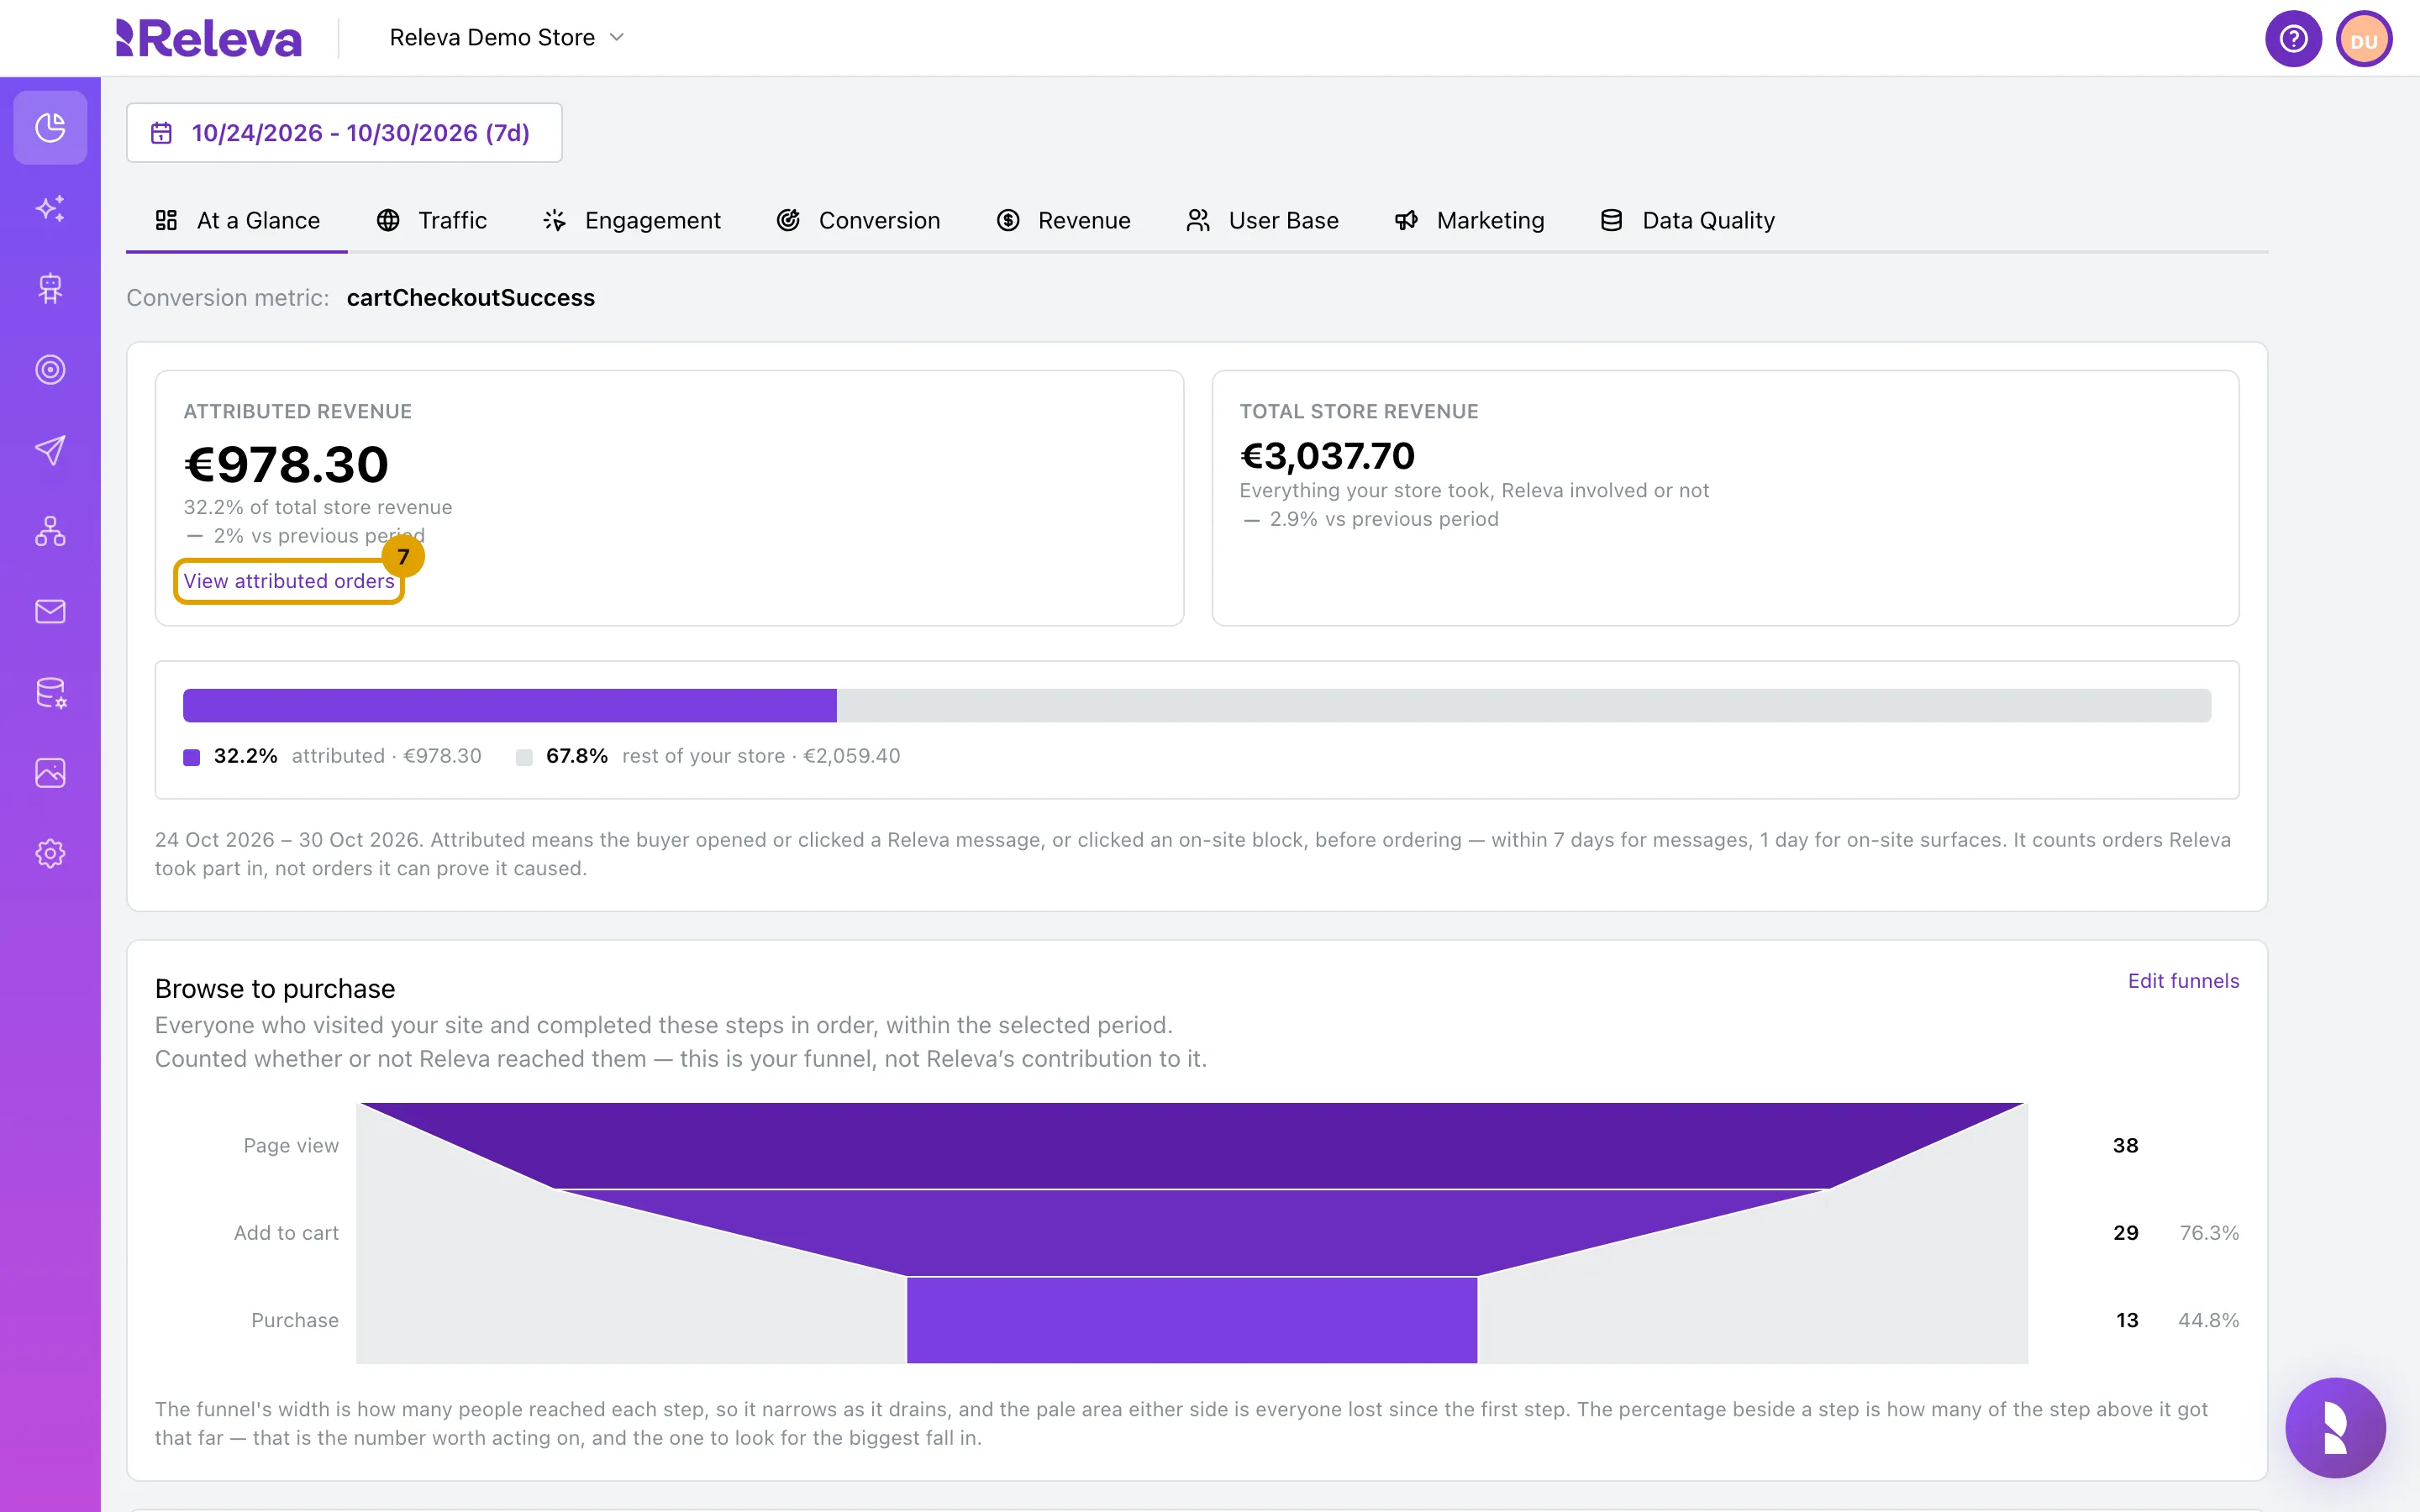
Select View attributed orders to see the orders behind the figure
-
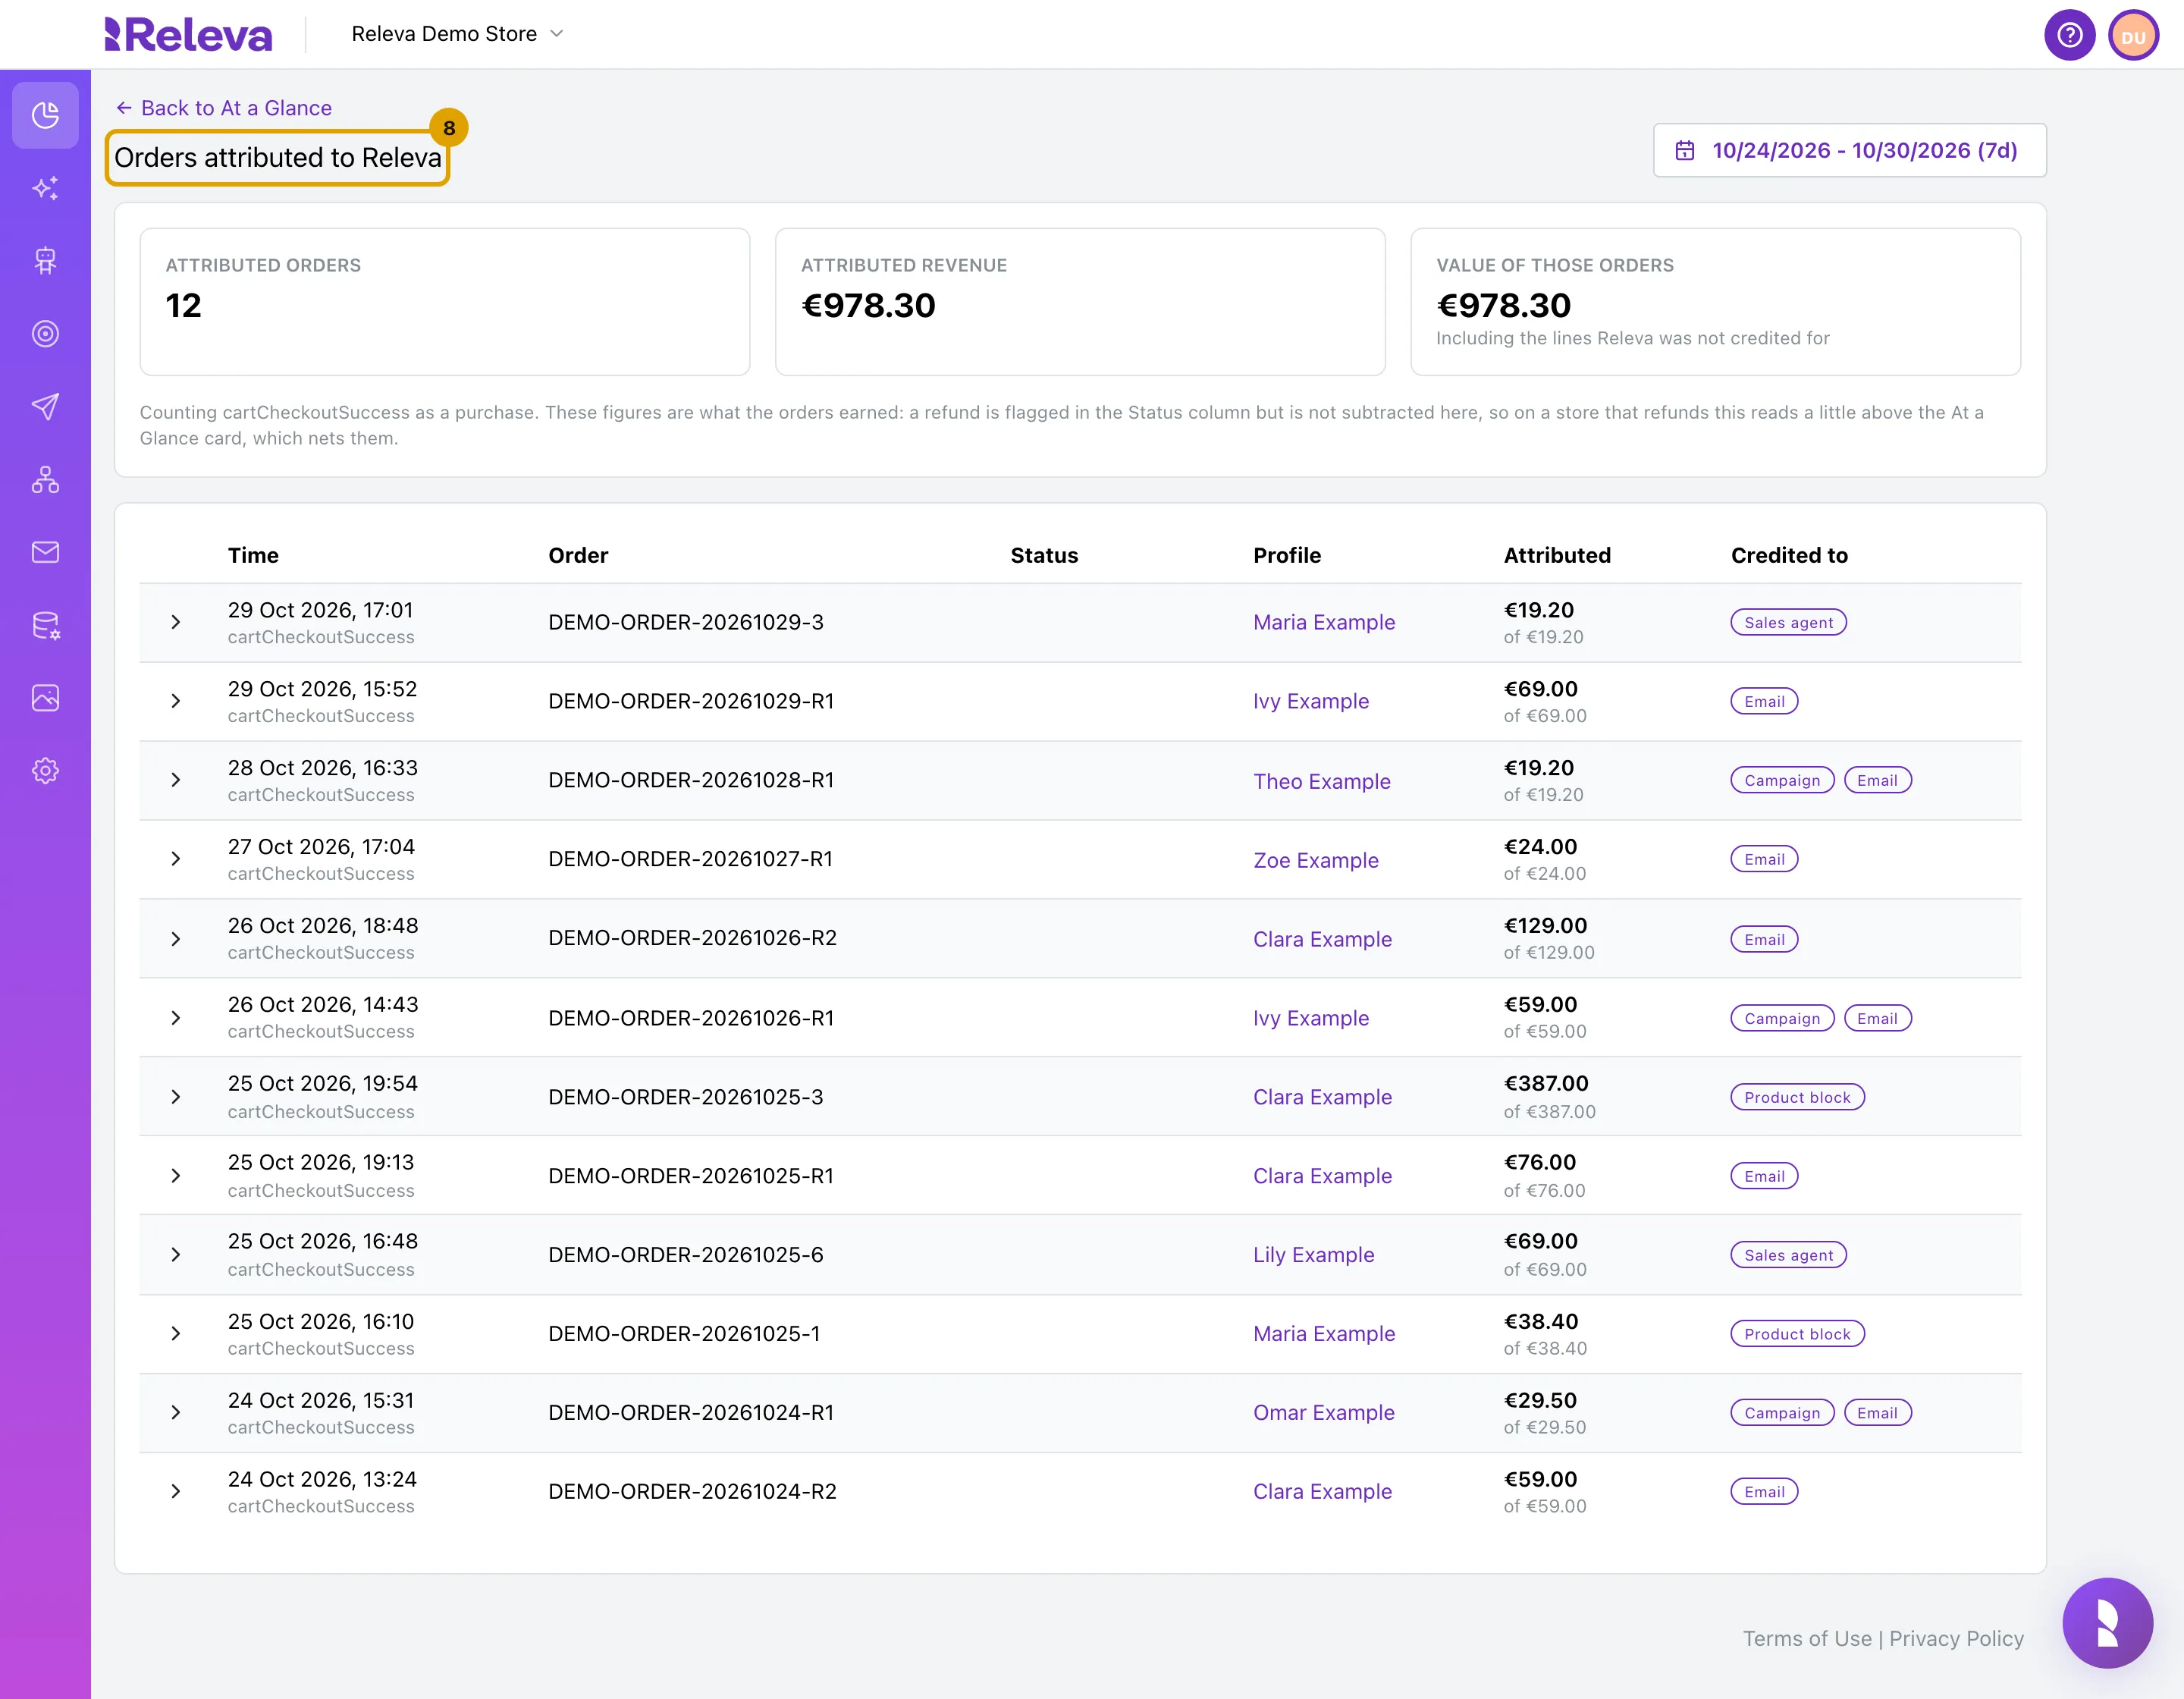
Each row is one order, with its status, the profile and what Releva was credited for. Select the arrow on a row to see its products.
The page keeps the period you had selected. The three tiles count Attributed orders, Attributed revenue and Value of those orders, which includes the order lines Releva was not credited for. A refund is flagged in Status but not subtracted here.
Look at the other tabs
Section titled “Look at the other tabs”Select Back to At a Glance first. The dashboard period is not kept when you leave the page, so it is back to 14 days; pick your period again if you need it. The seven tabs below share one period and one set of statistics, so the first tab you open after At a Glance shows a spinner for a moment while they load.
-
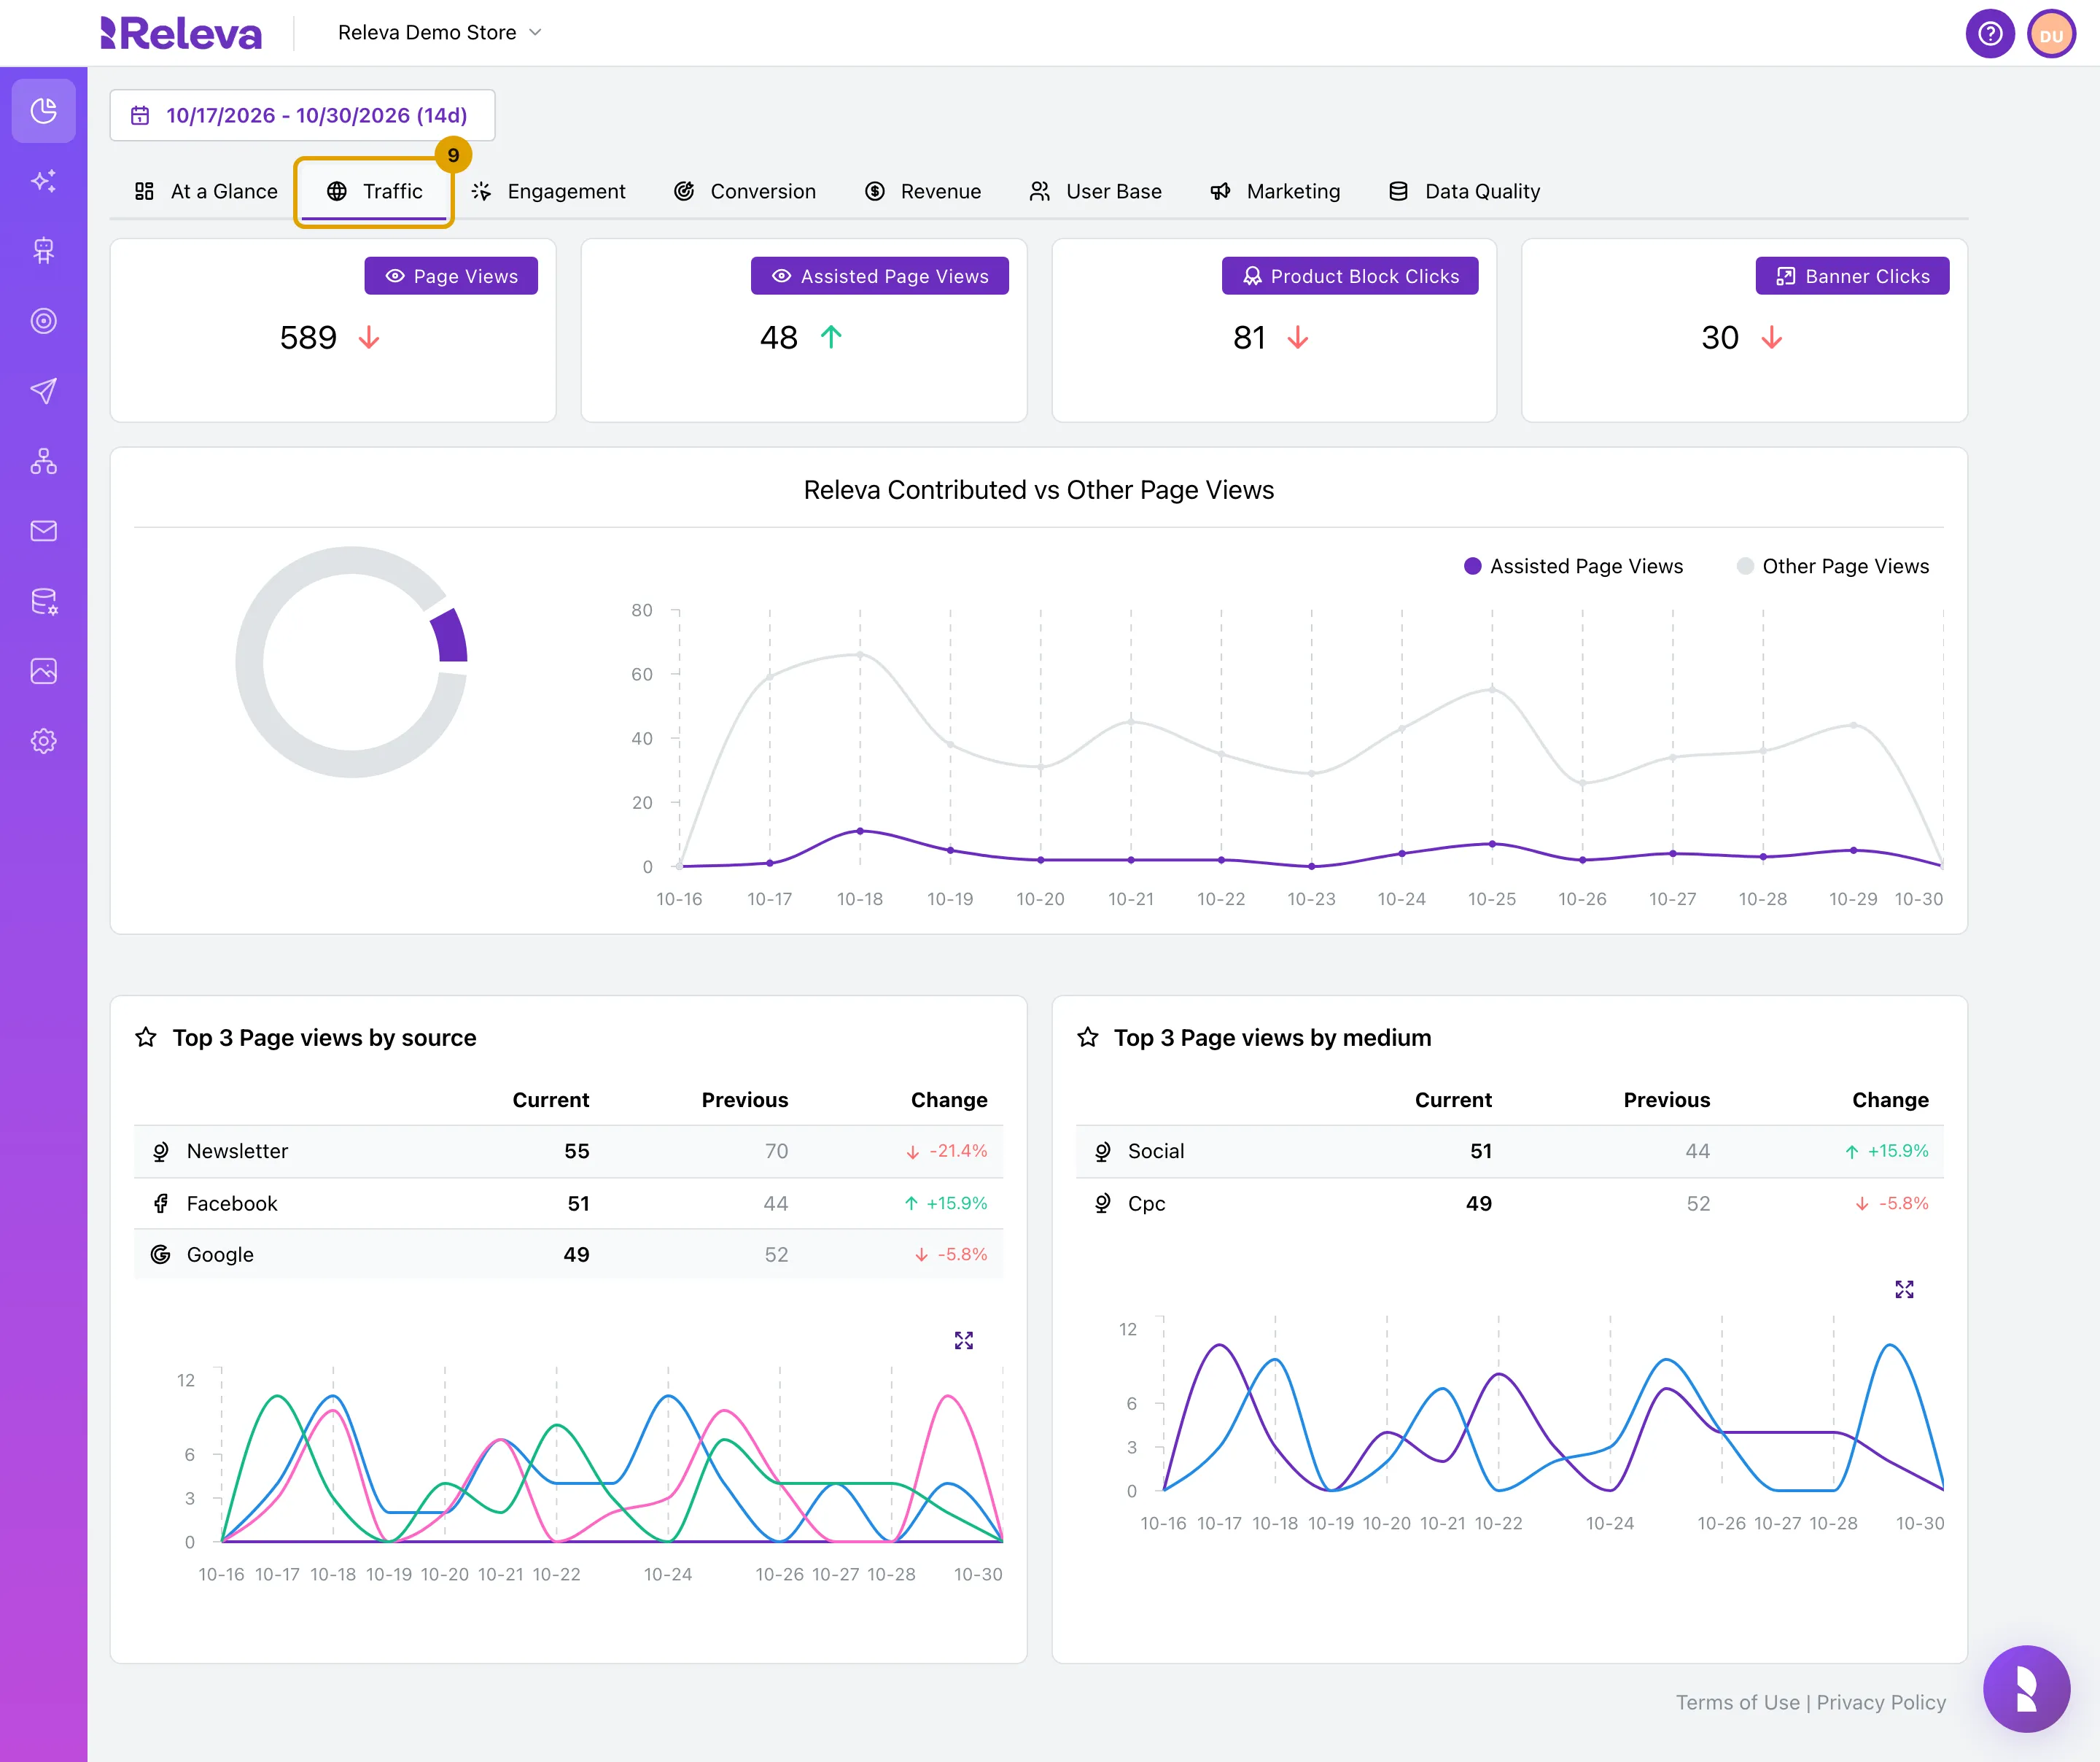
Select the Traffic tab for page views, the views Releva took part in and the top sources and media
The tiles count Page Views, Assisted Page Views, Product Block Clicks and Banner Clicks. Releva Contributed vs Other Page Views splits the views by whether a Releva surface took part. Top 3 Page views by source and Top 3 Page views by medium rank your UTM sources and media with their previous value and change. See Traffic.
-
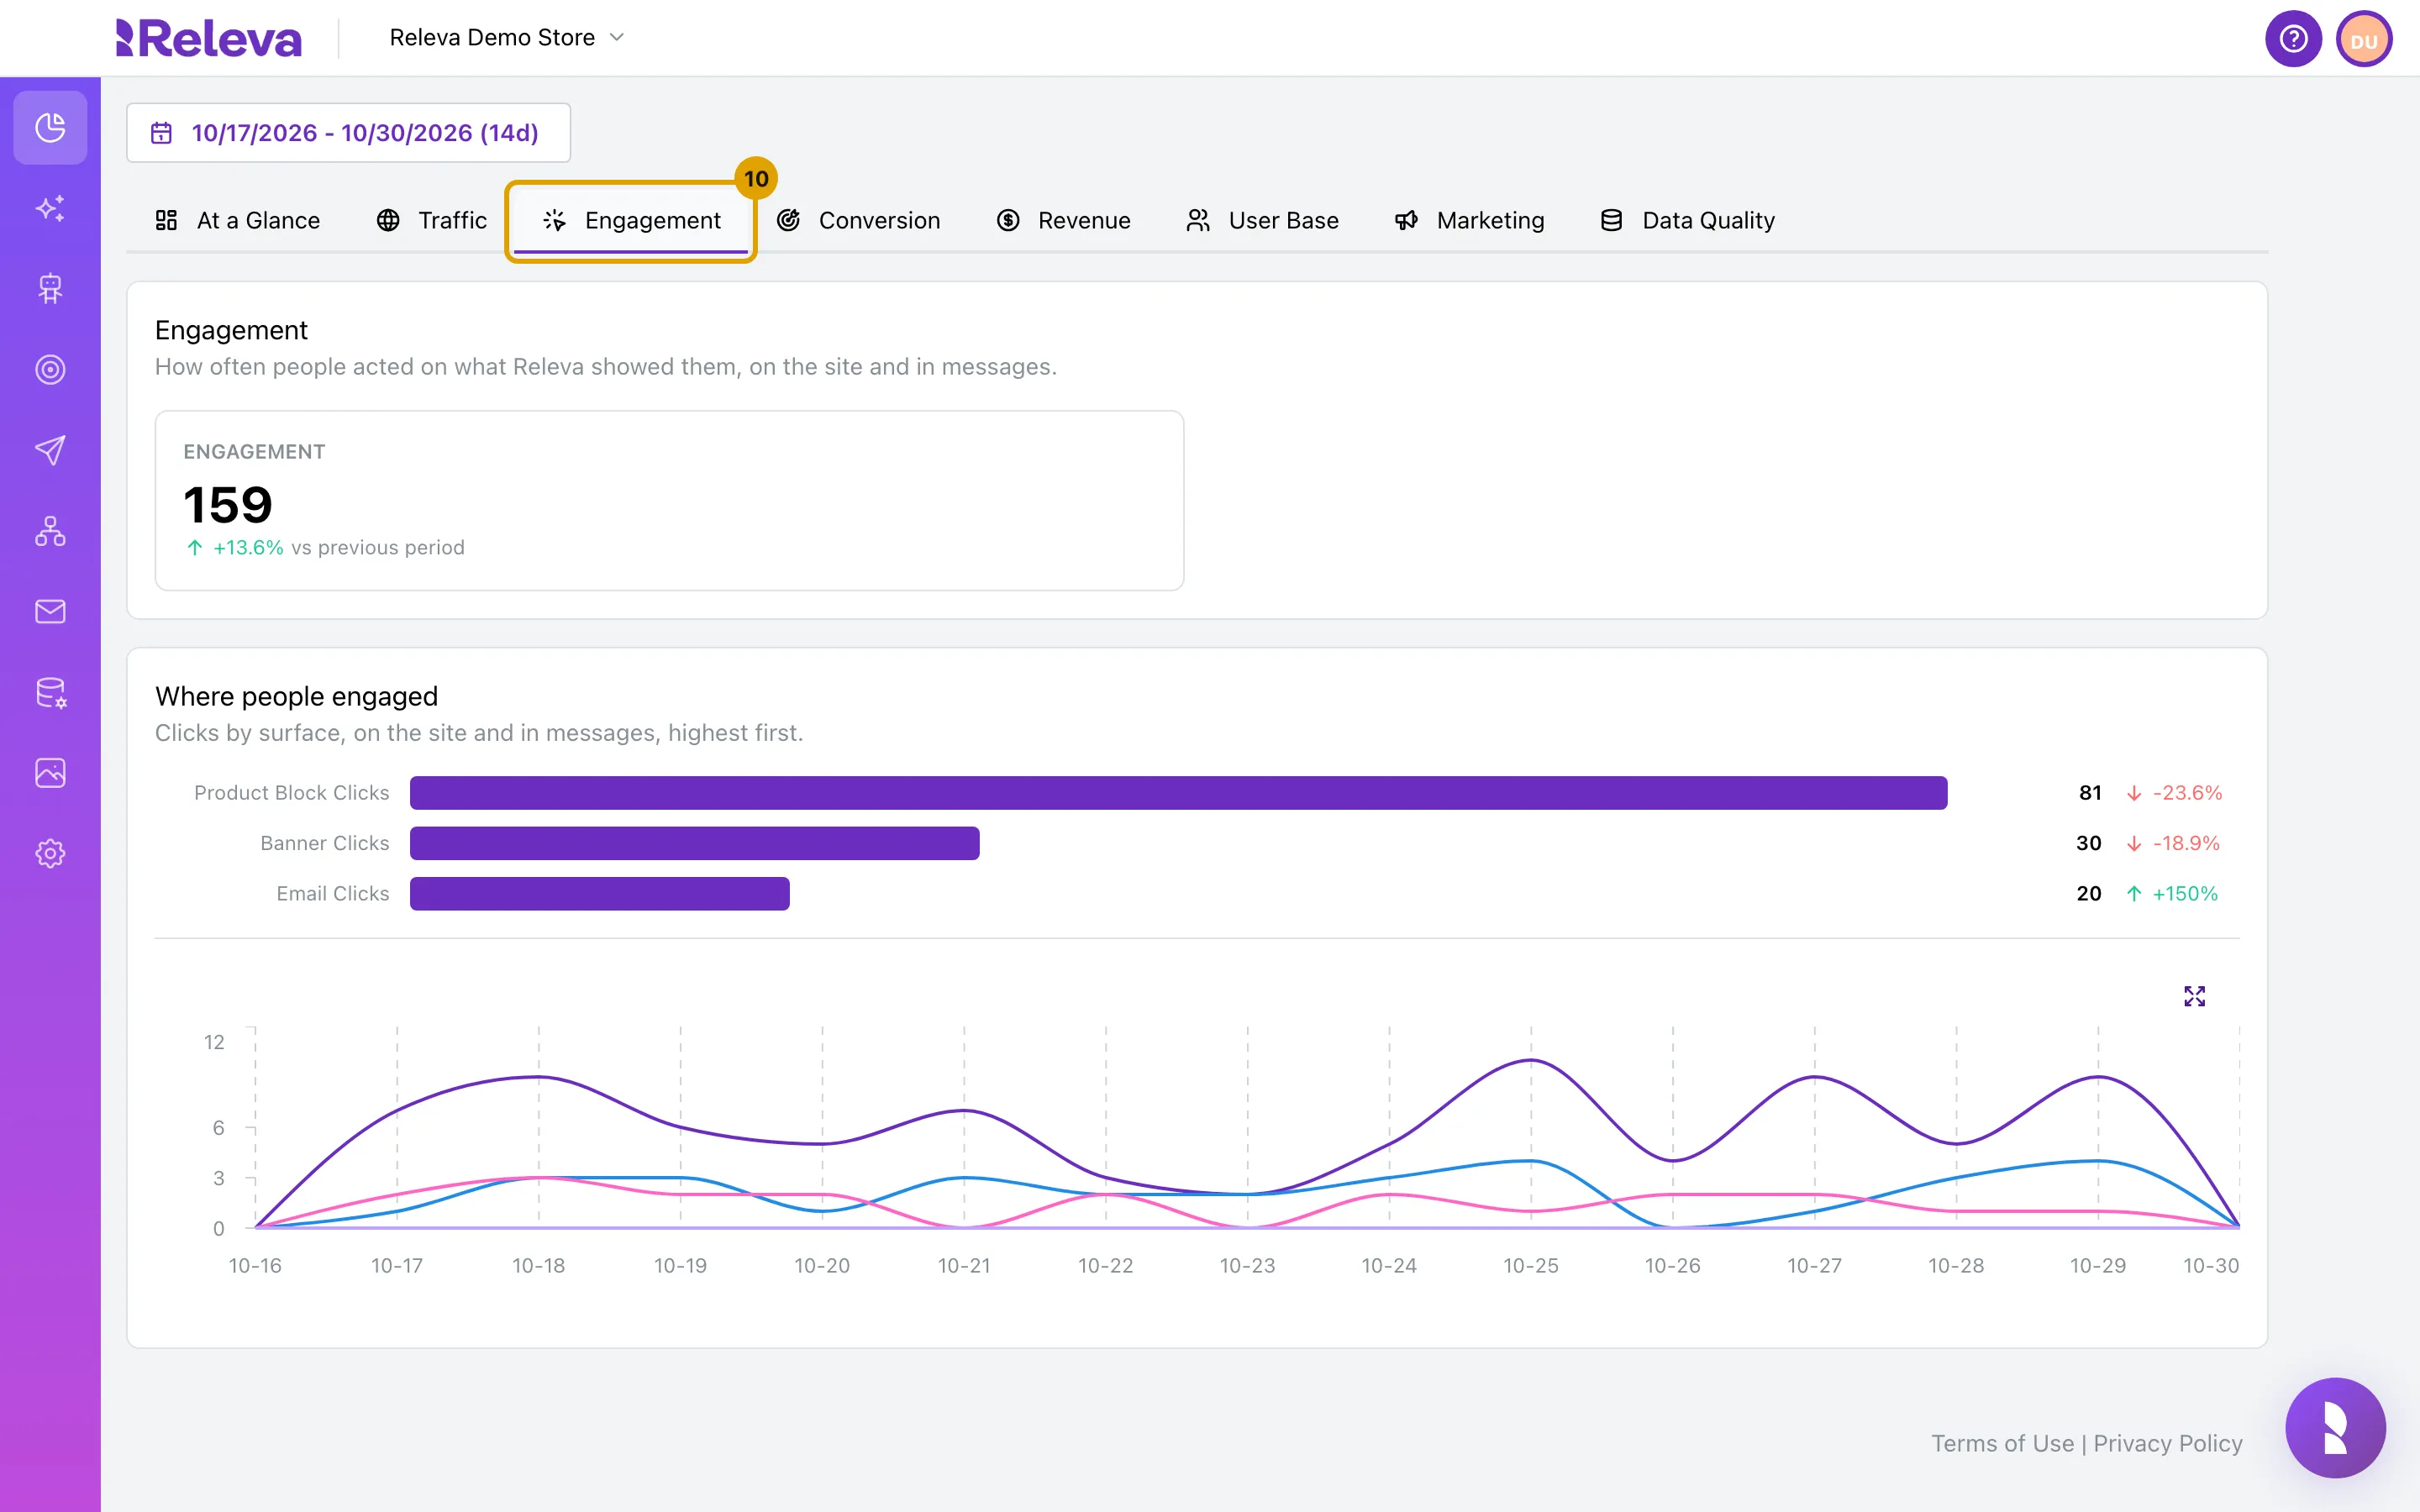
Select the Engagement tab for how often people acted on what Releva showed them, and where
Engagement counts the cart adds that followed a Releva surface. Where people engaged lists clicks by surface, on the site and in messages, highest first. See Engagement.
-
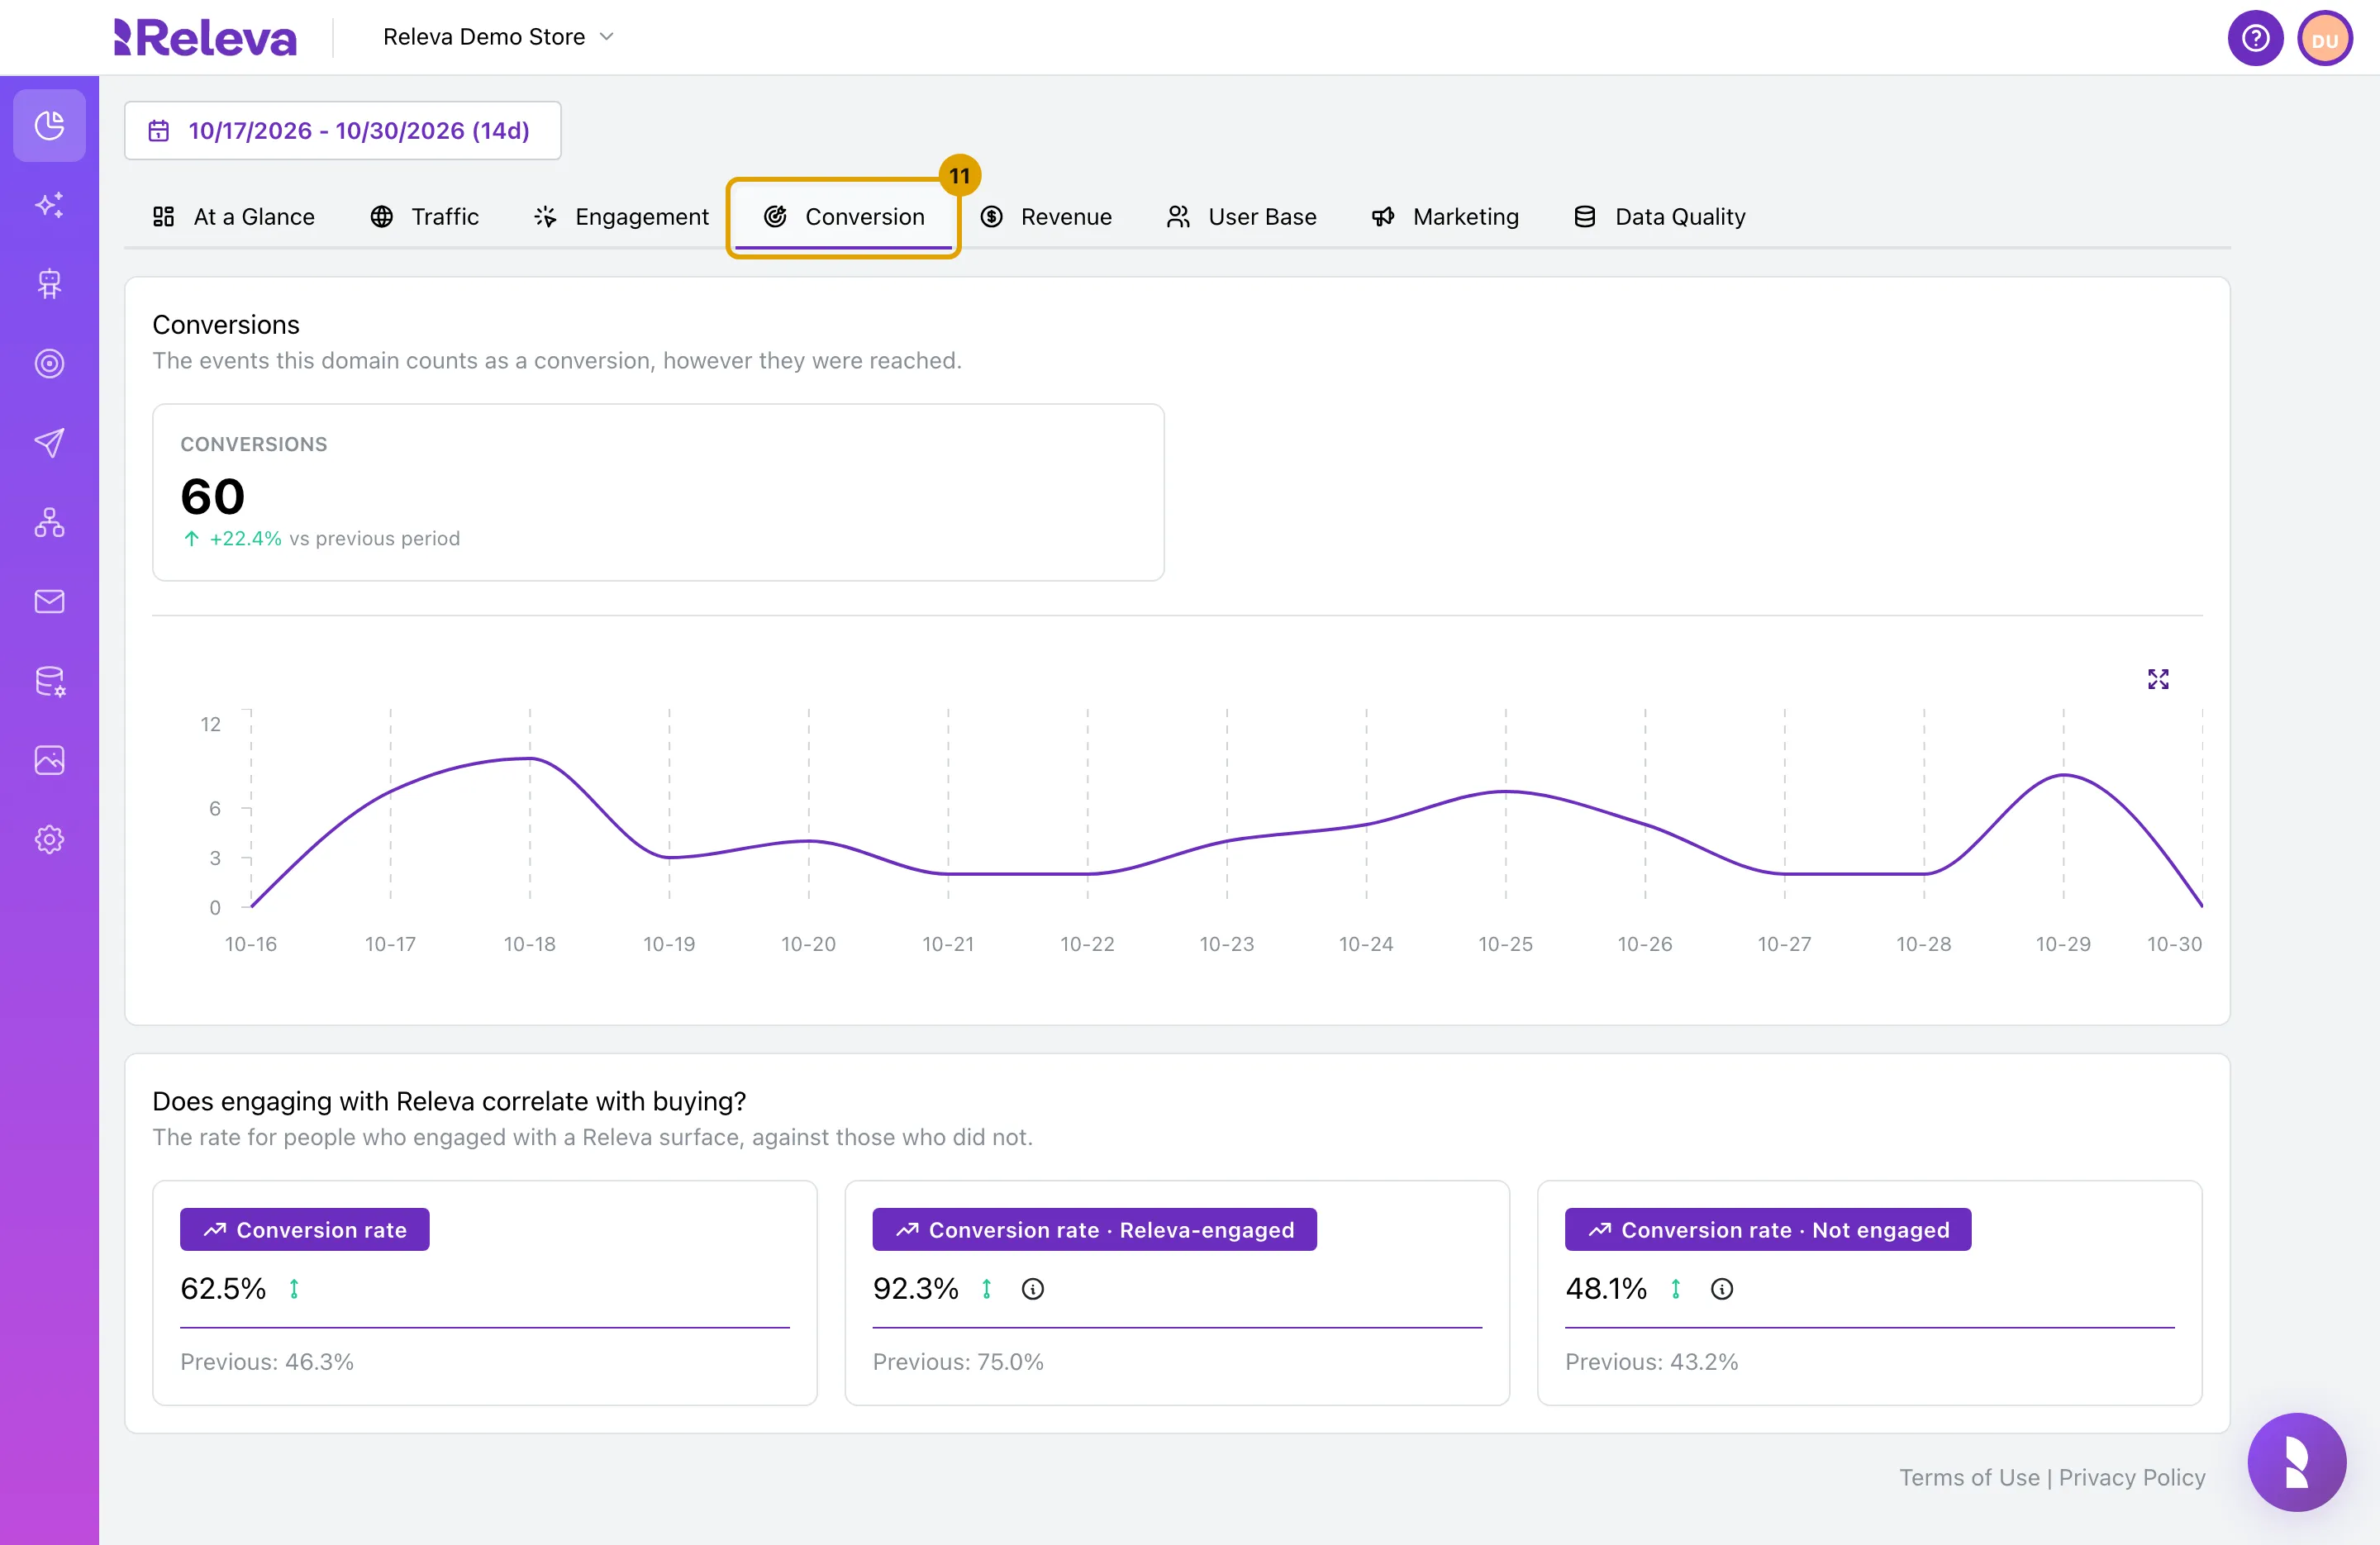
Select the Conversion tab for your conversions and the conversion rate of people who engaged with Releva against those who did not
Conversions counts the events your shop counts as a conversion, however they were reached. Does engaging with Releva correlate with buying? shows the Conversion rate, the Conversion rate · Releva-engaged and the Conversion rate · Not engaged, each with its Previous: value. The two segmented rates are a correlation, not a controlled test: for causal lift, use a control group. See Conversion.
-
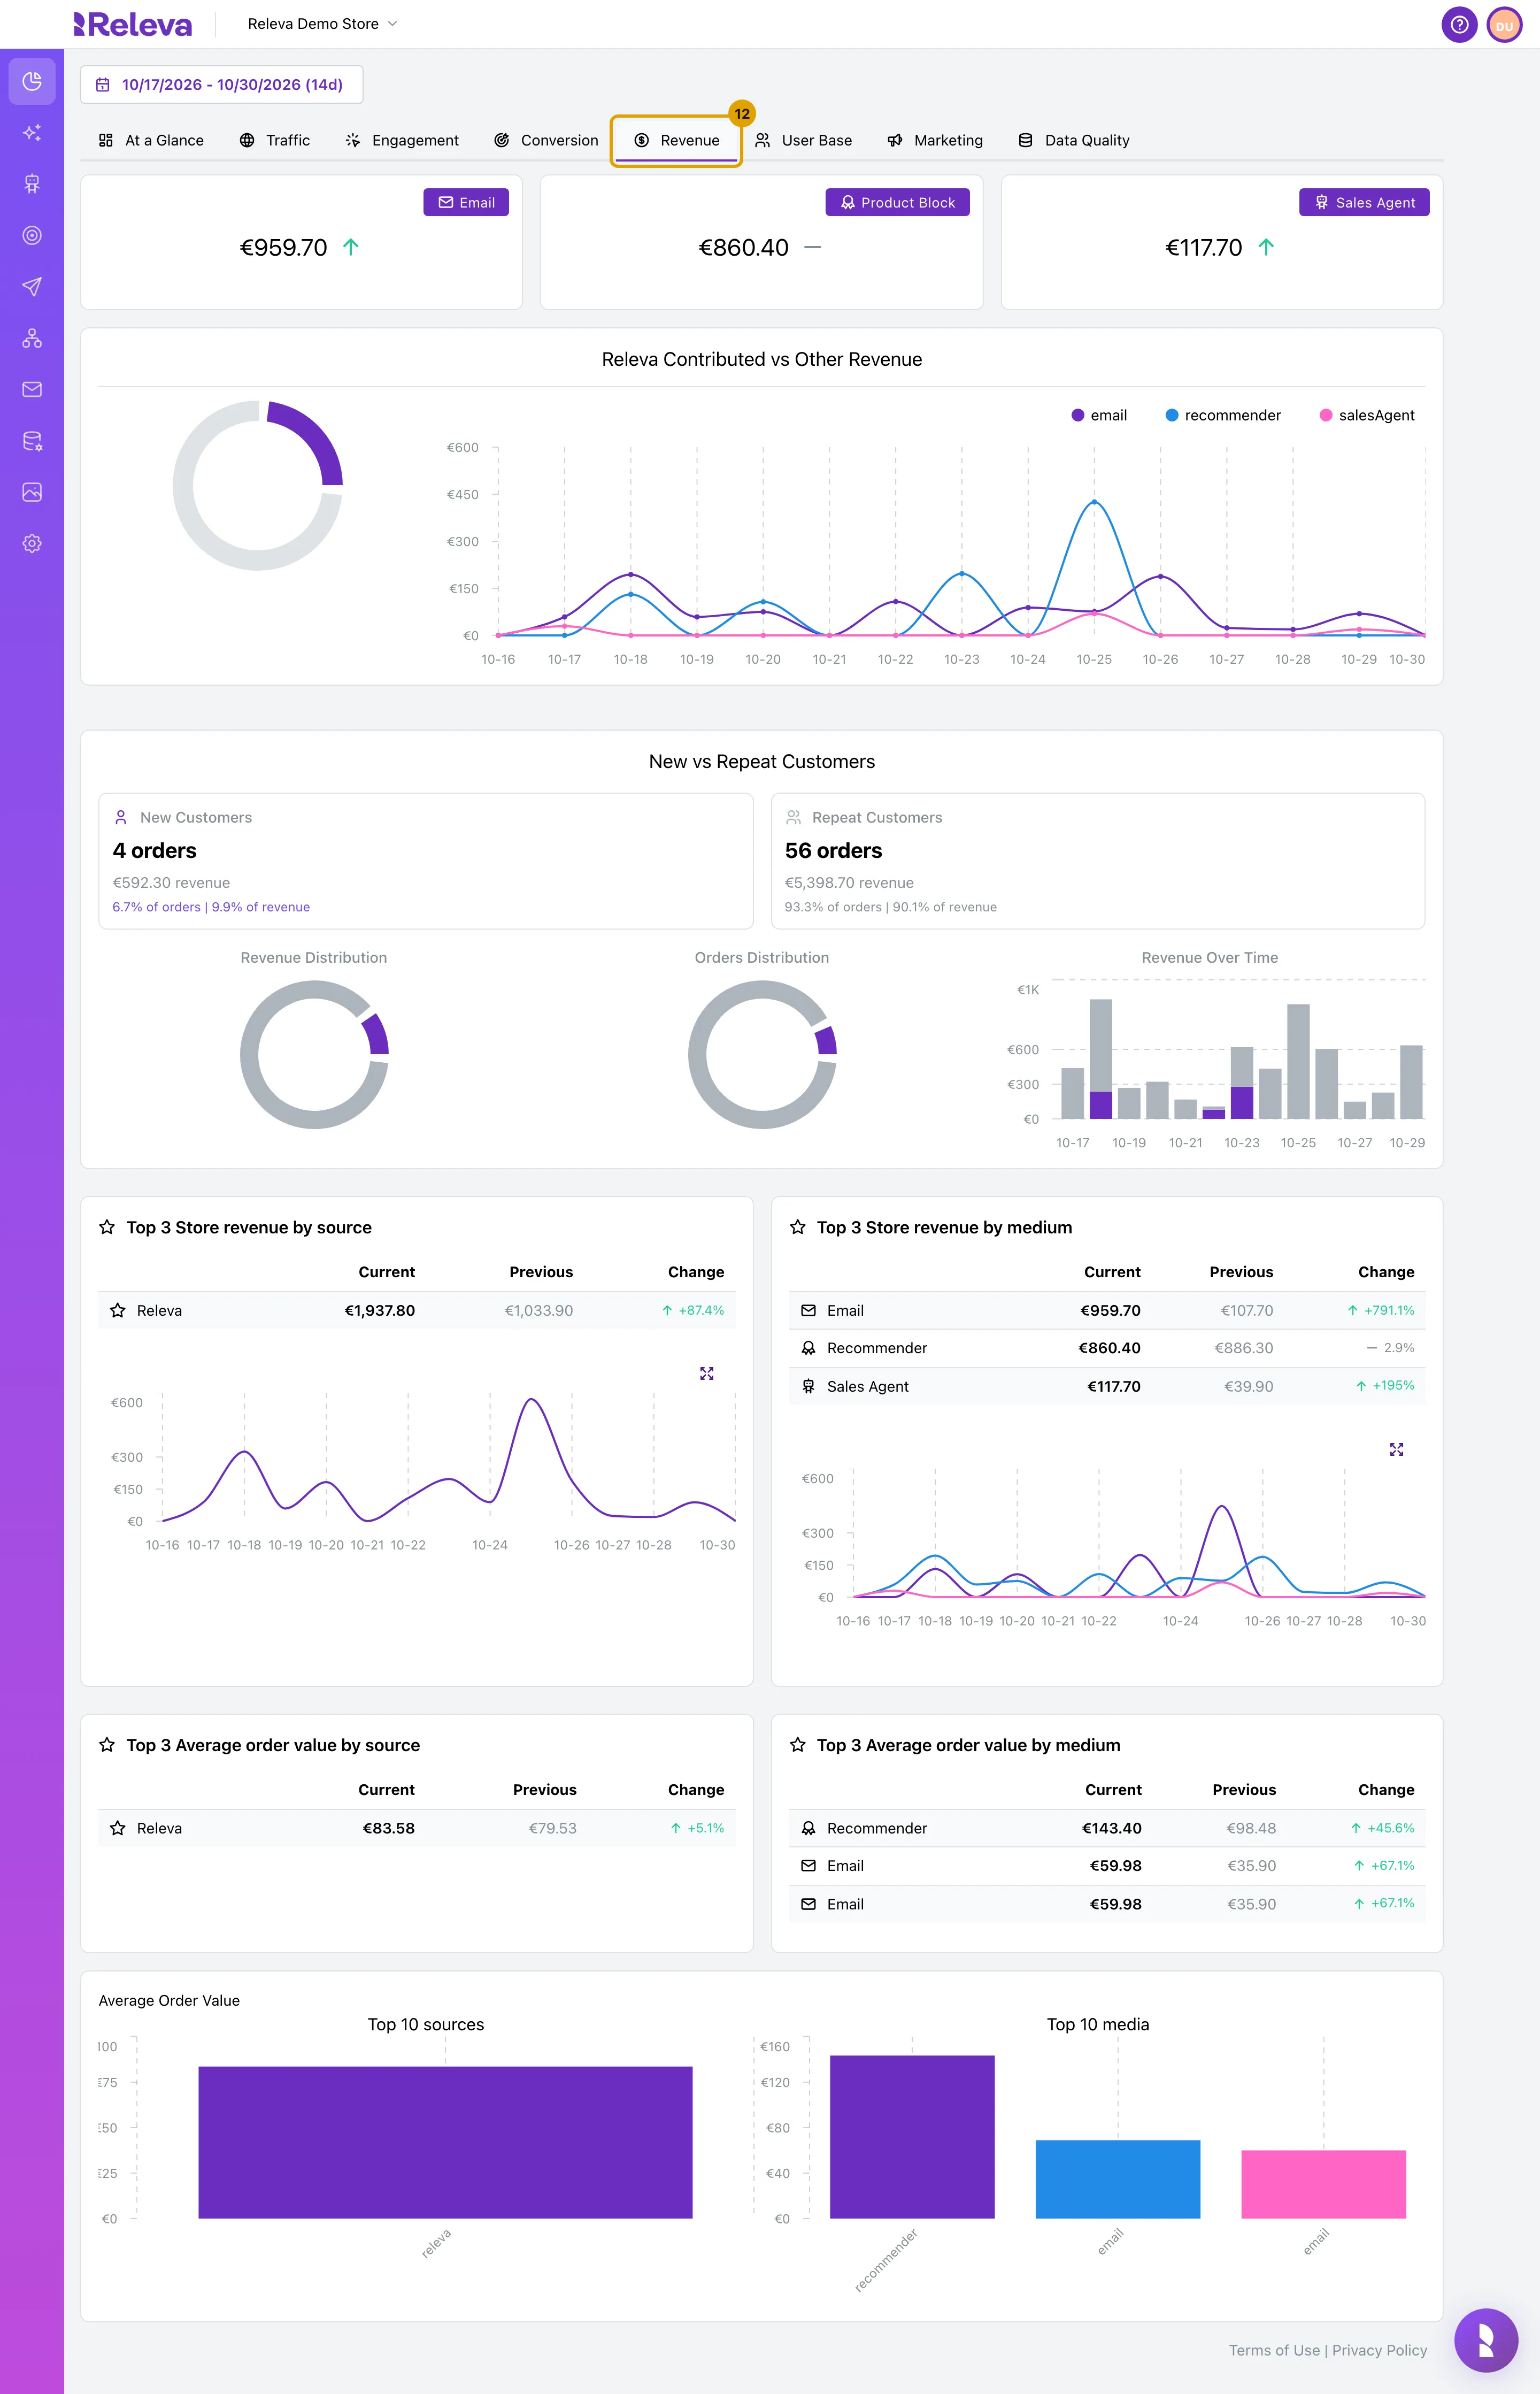
Select the Revenue tab for revenue by source, new against repeat customers and average order value
The tiles show the revenue of each Releva source, and Releva Contributed vs Other Revenue plots them over the period. See Revenue.
-
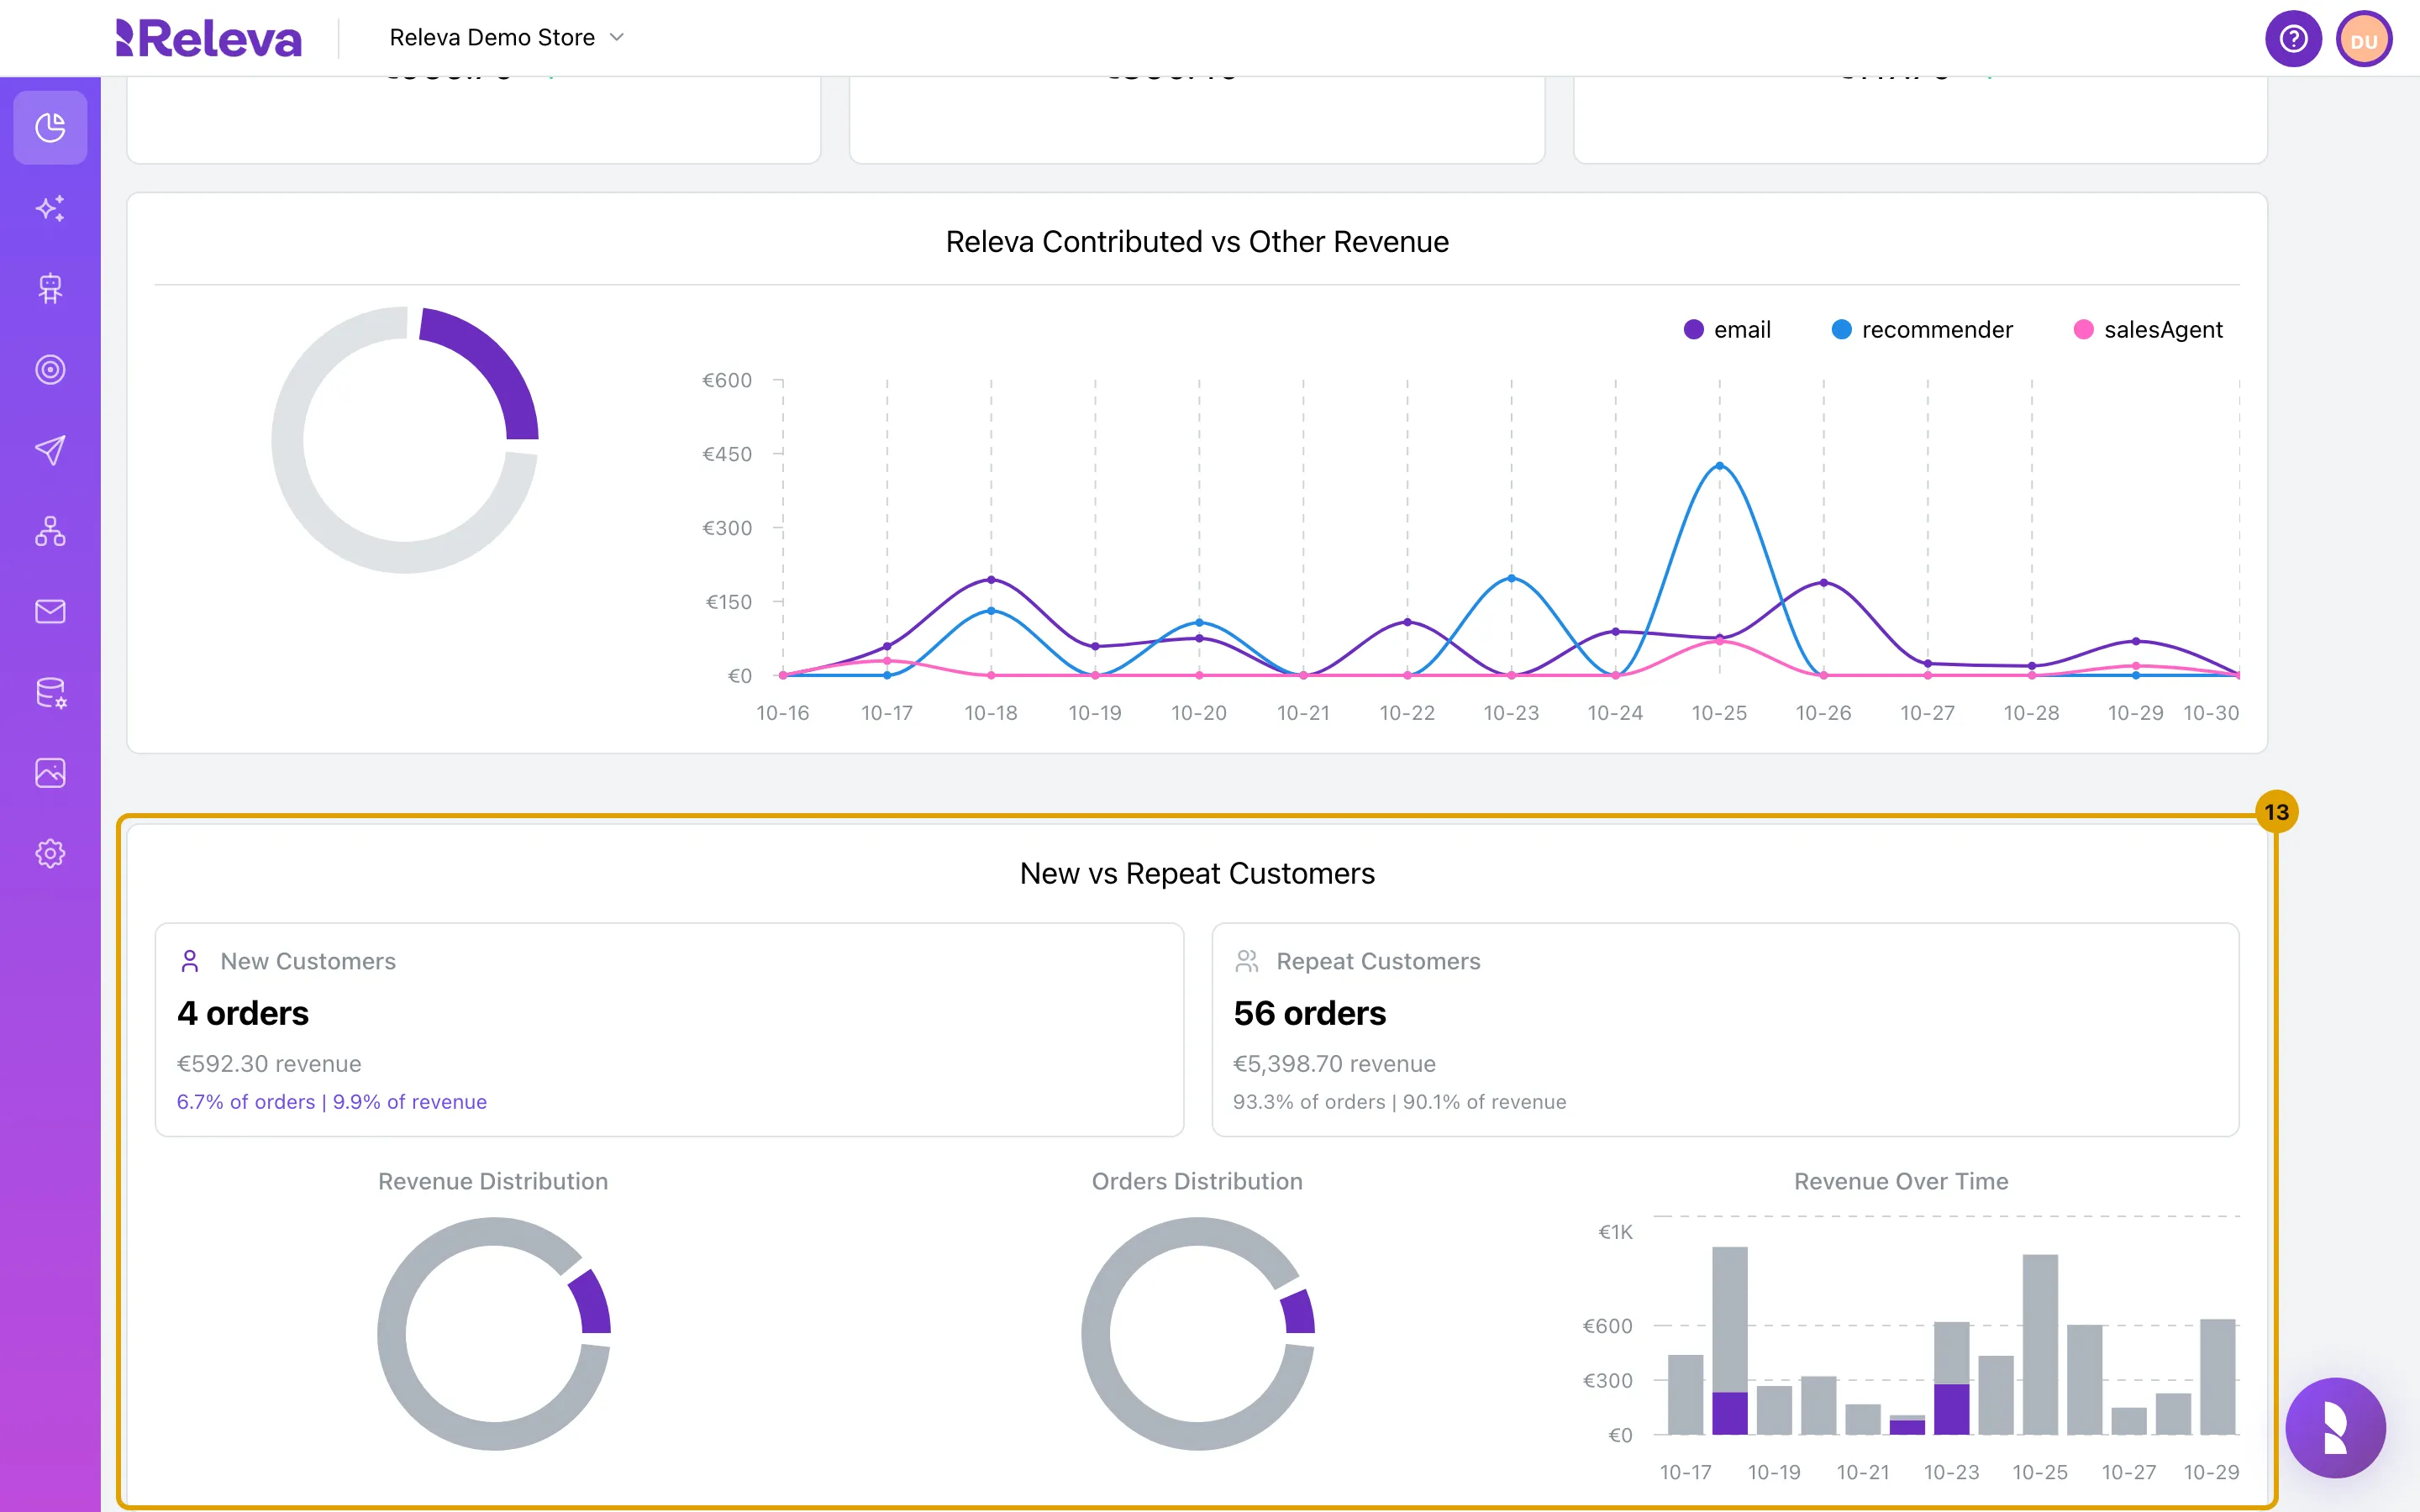
New vs Repeat Customers splits the orders and revenue of the period by whether it was the buyer’s first purchase
Each side shows the number of orders, the revenue and the share of both. Revenue Over Time is the daily total. Refunds are subtracted from revenue, not from the order counts.
-
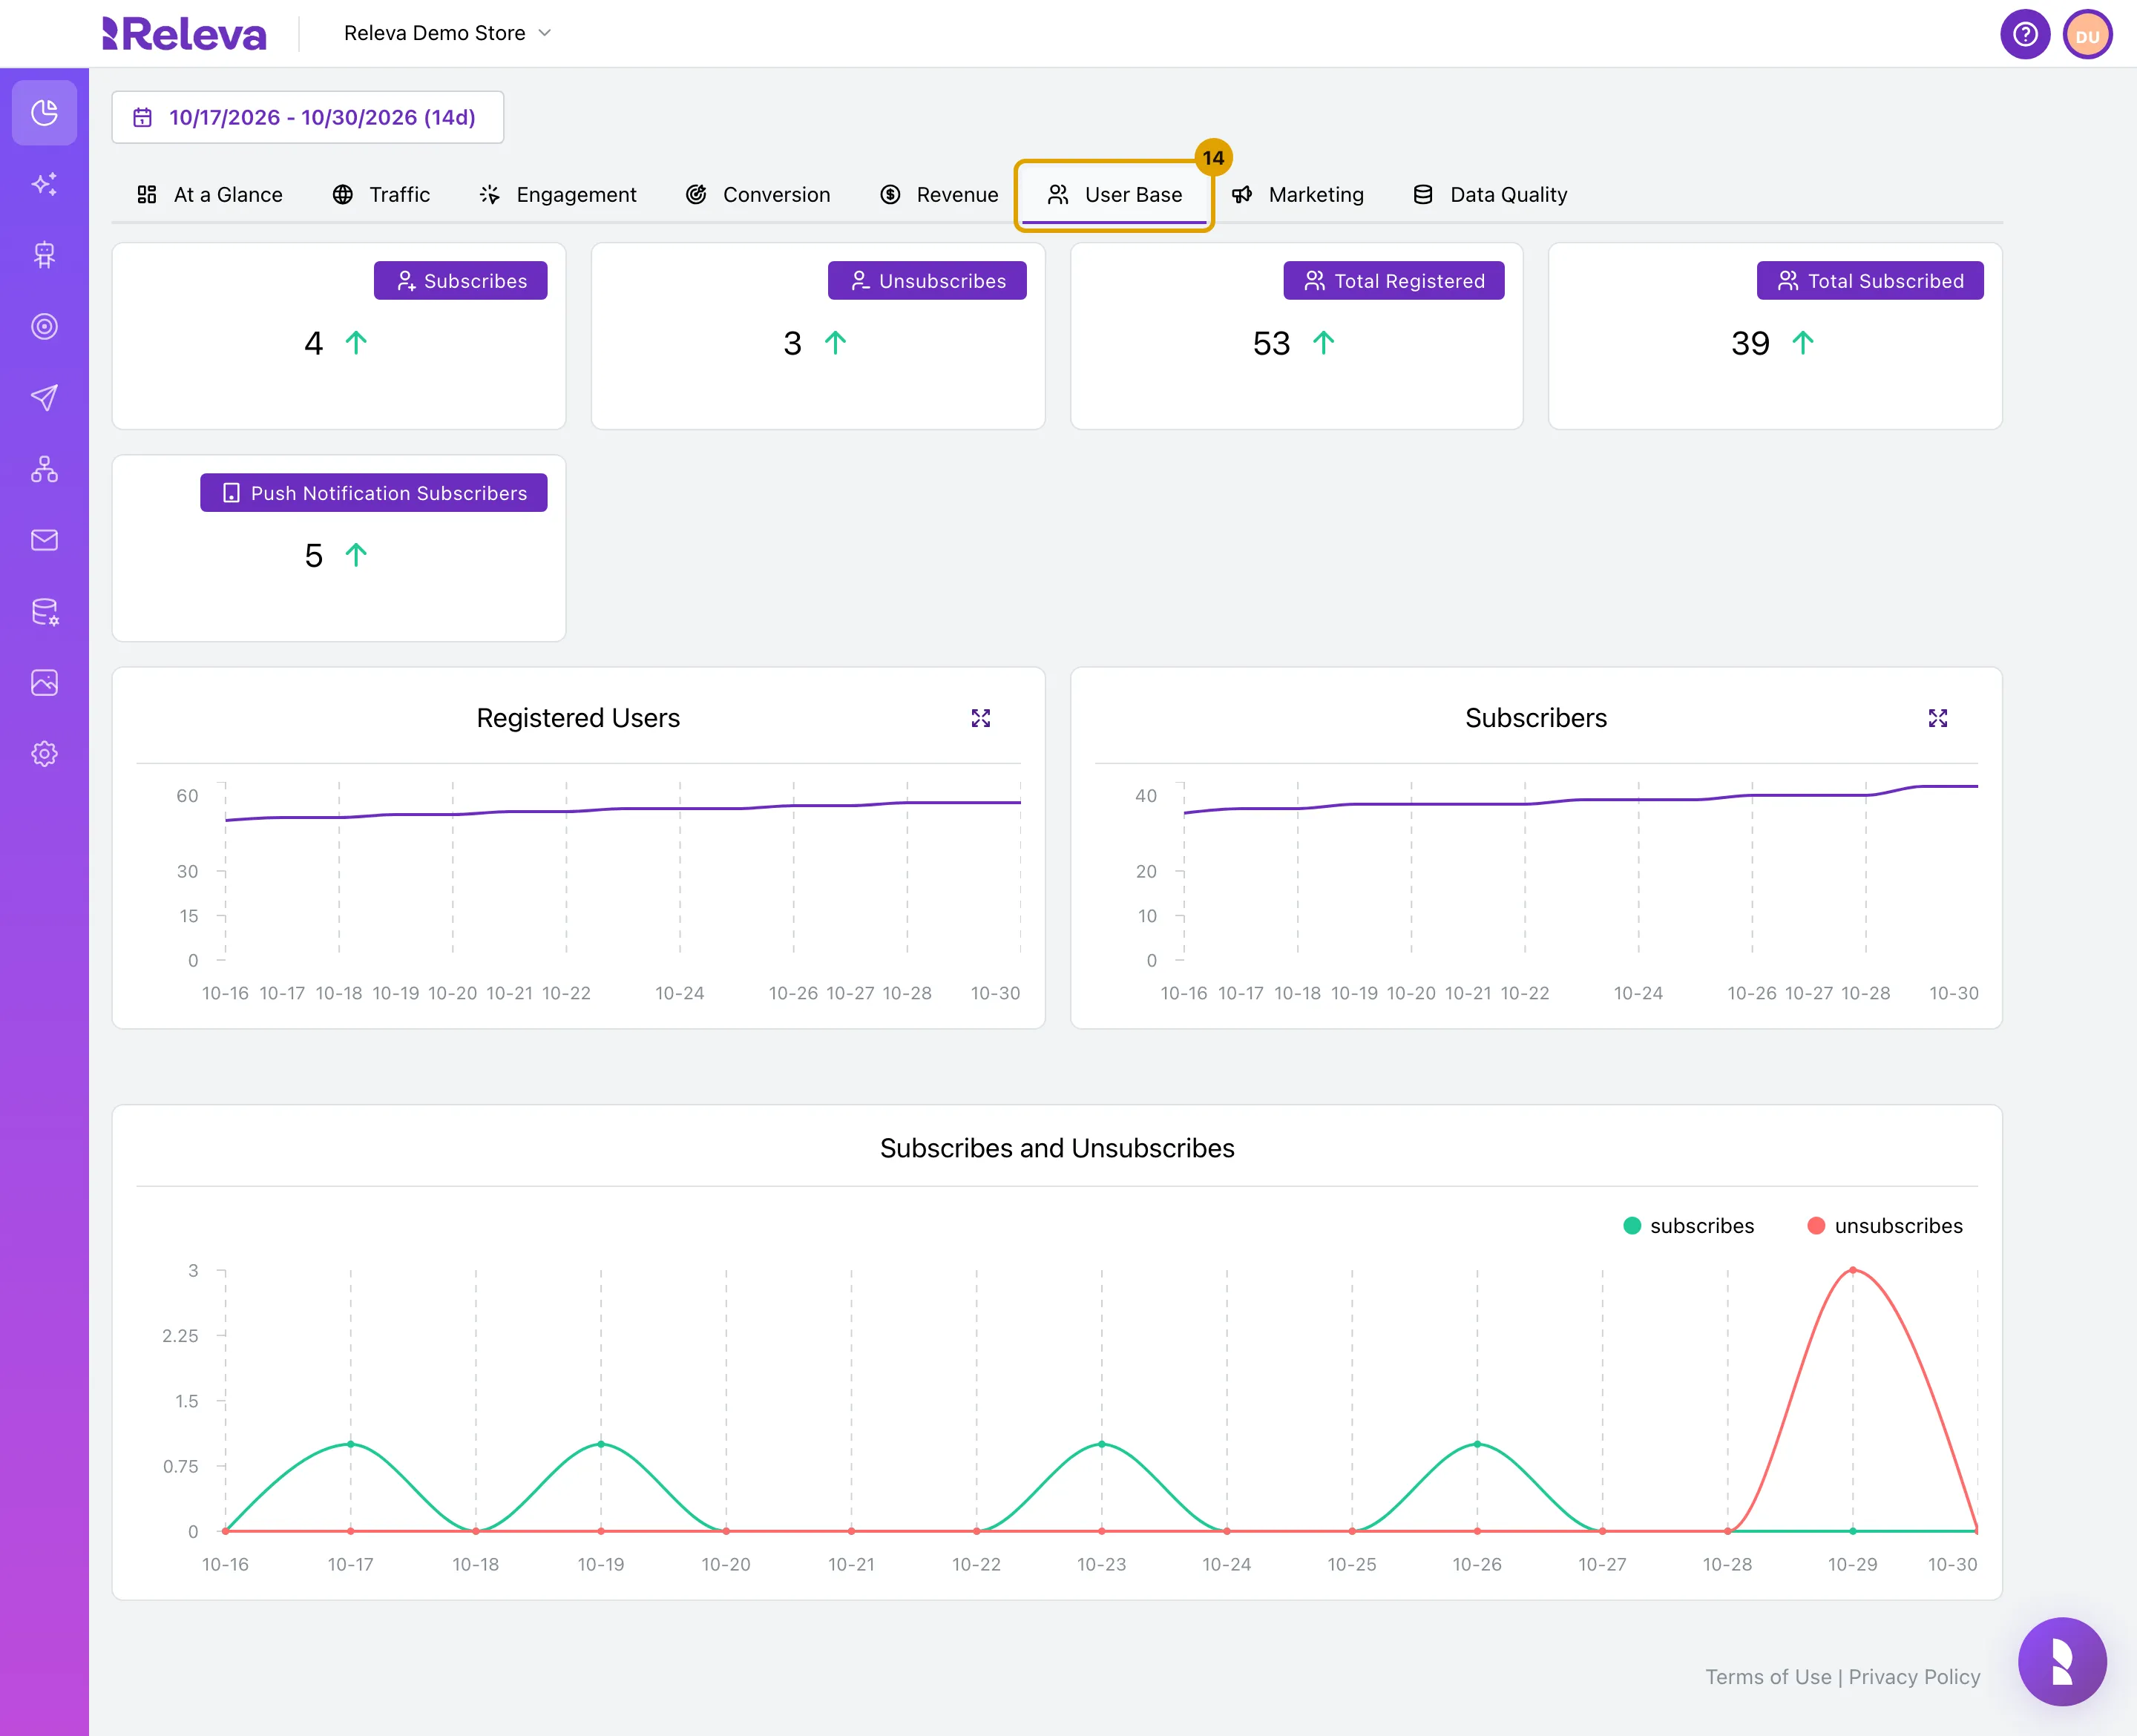
Select the User Base tab for registered users, subscribers and how many subscribed and unsubscribed
The tiles count your audience in the period; the charts Registered Users, Subscribers and Subscribes and Unsubscribes follow it day by day. See User Base.
-
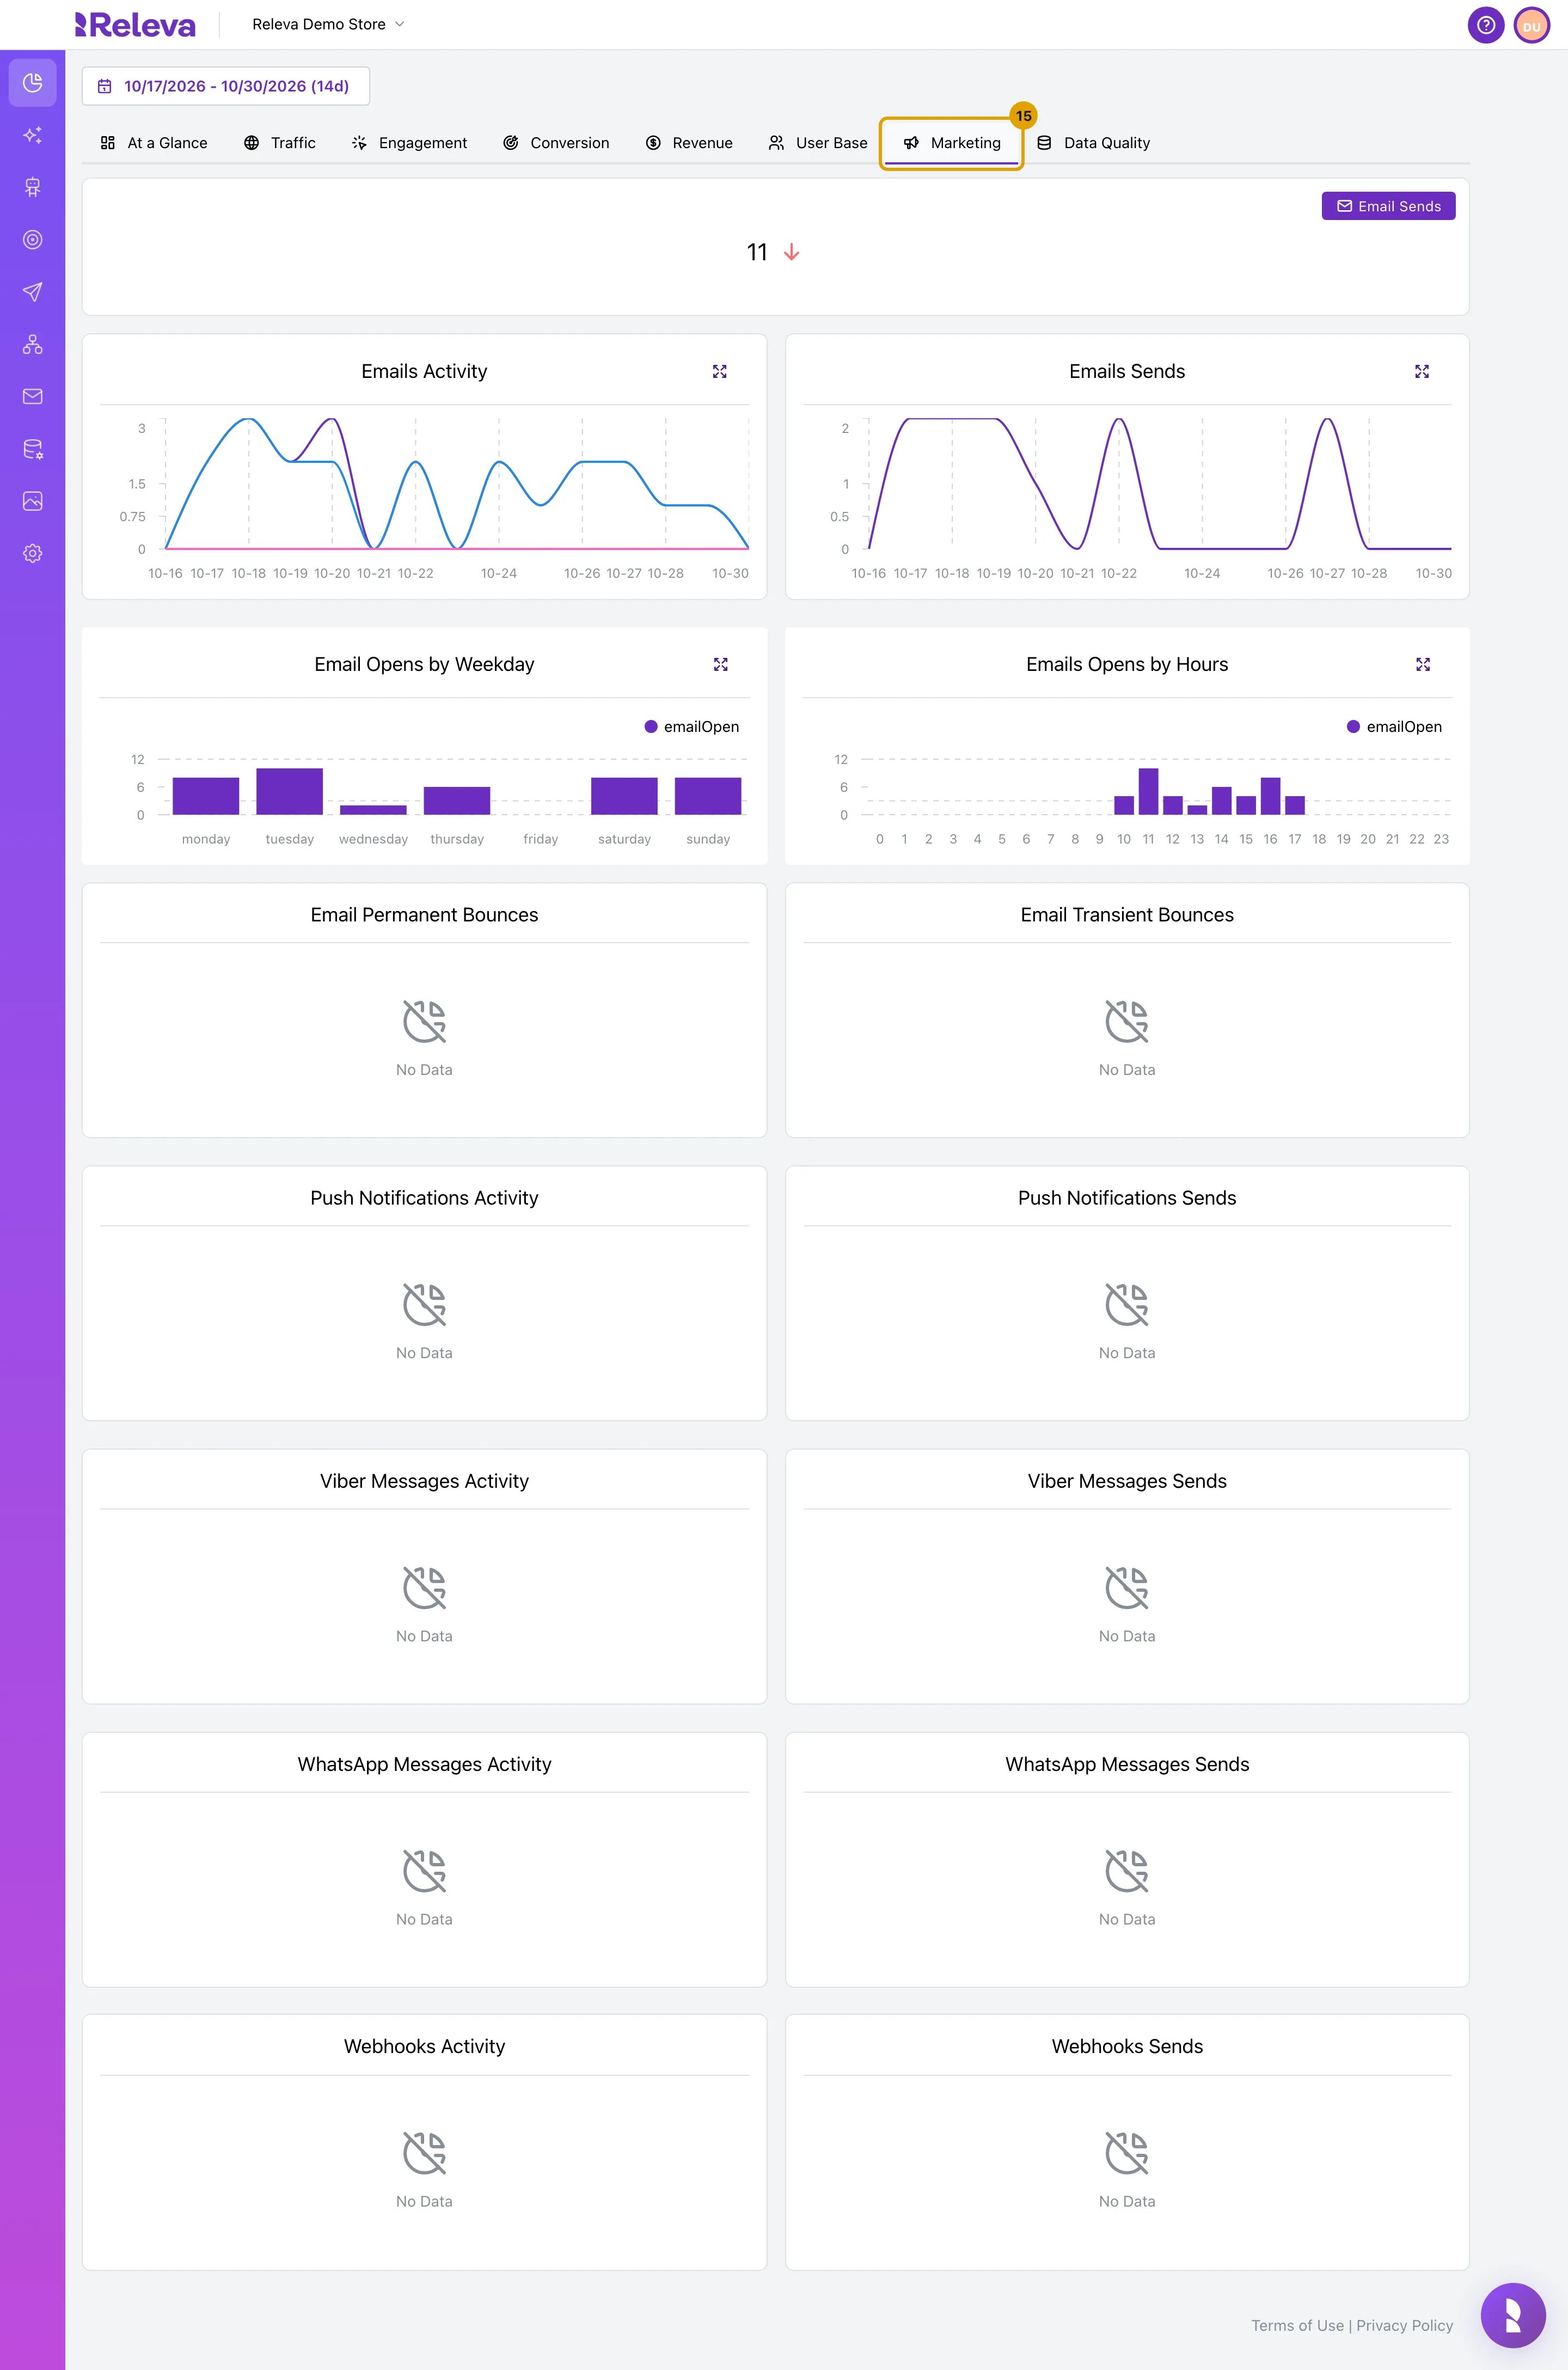
Select the Marketing tab for the activity and sends of each messaging channel
Emails get Emails Activity, Emails Sends, opens by weekday and by hour and bounces. Push notifications and webhooks get an activity and a sends chart. SMS, Viber and WhatsApp charts appear only once the channel is set up. See Marketing.
-
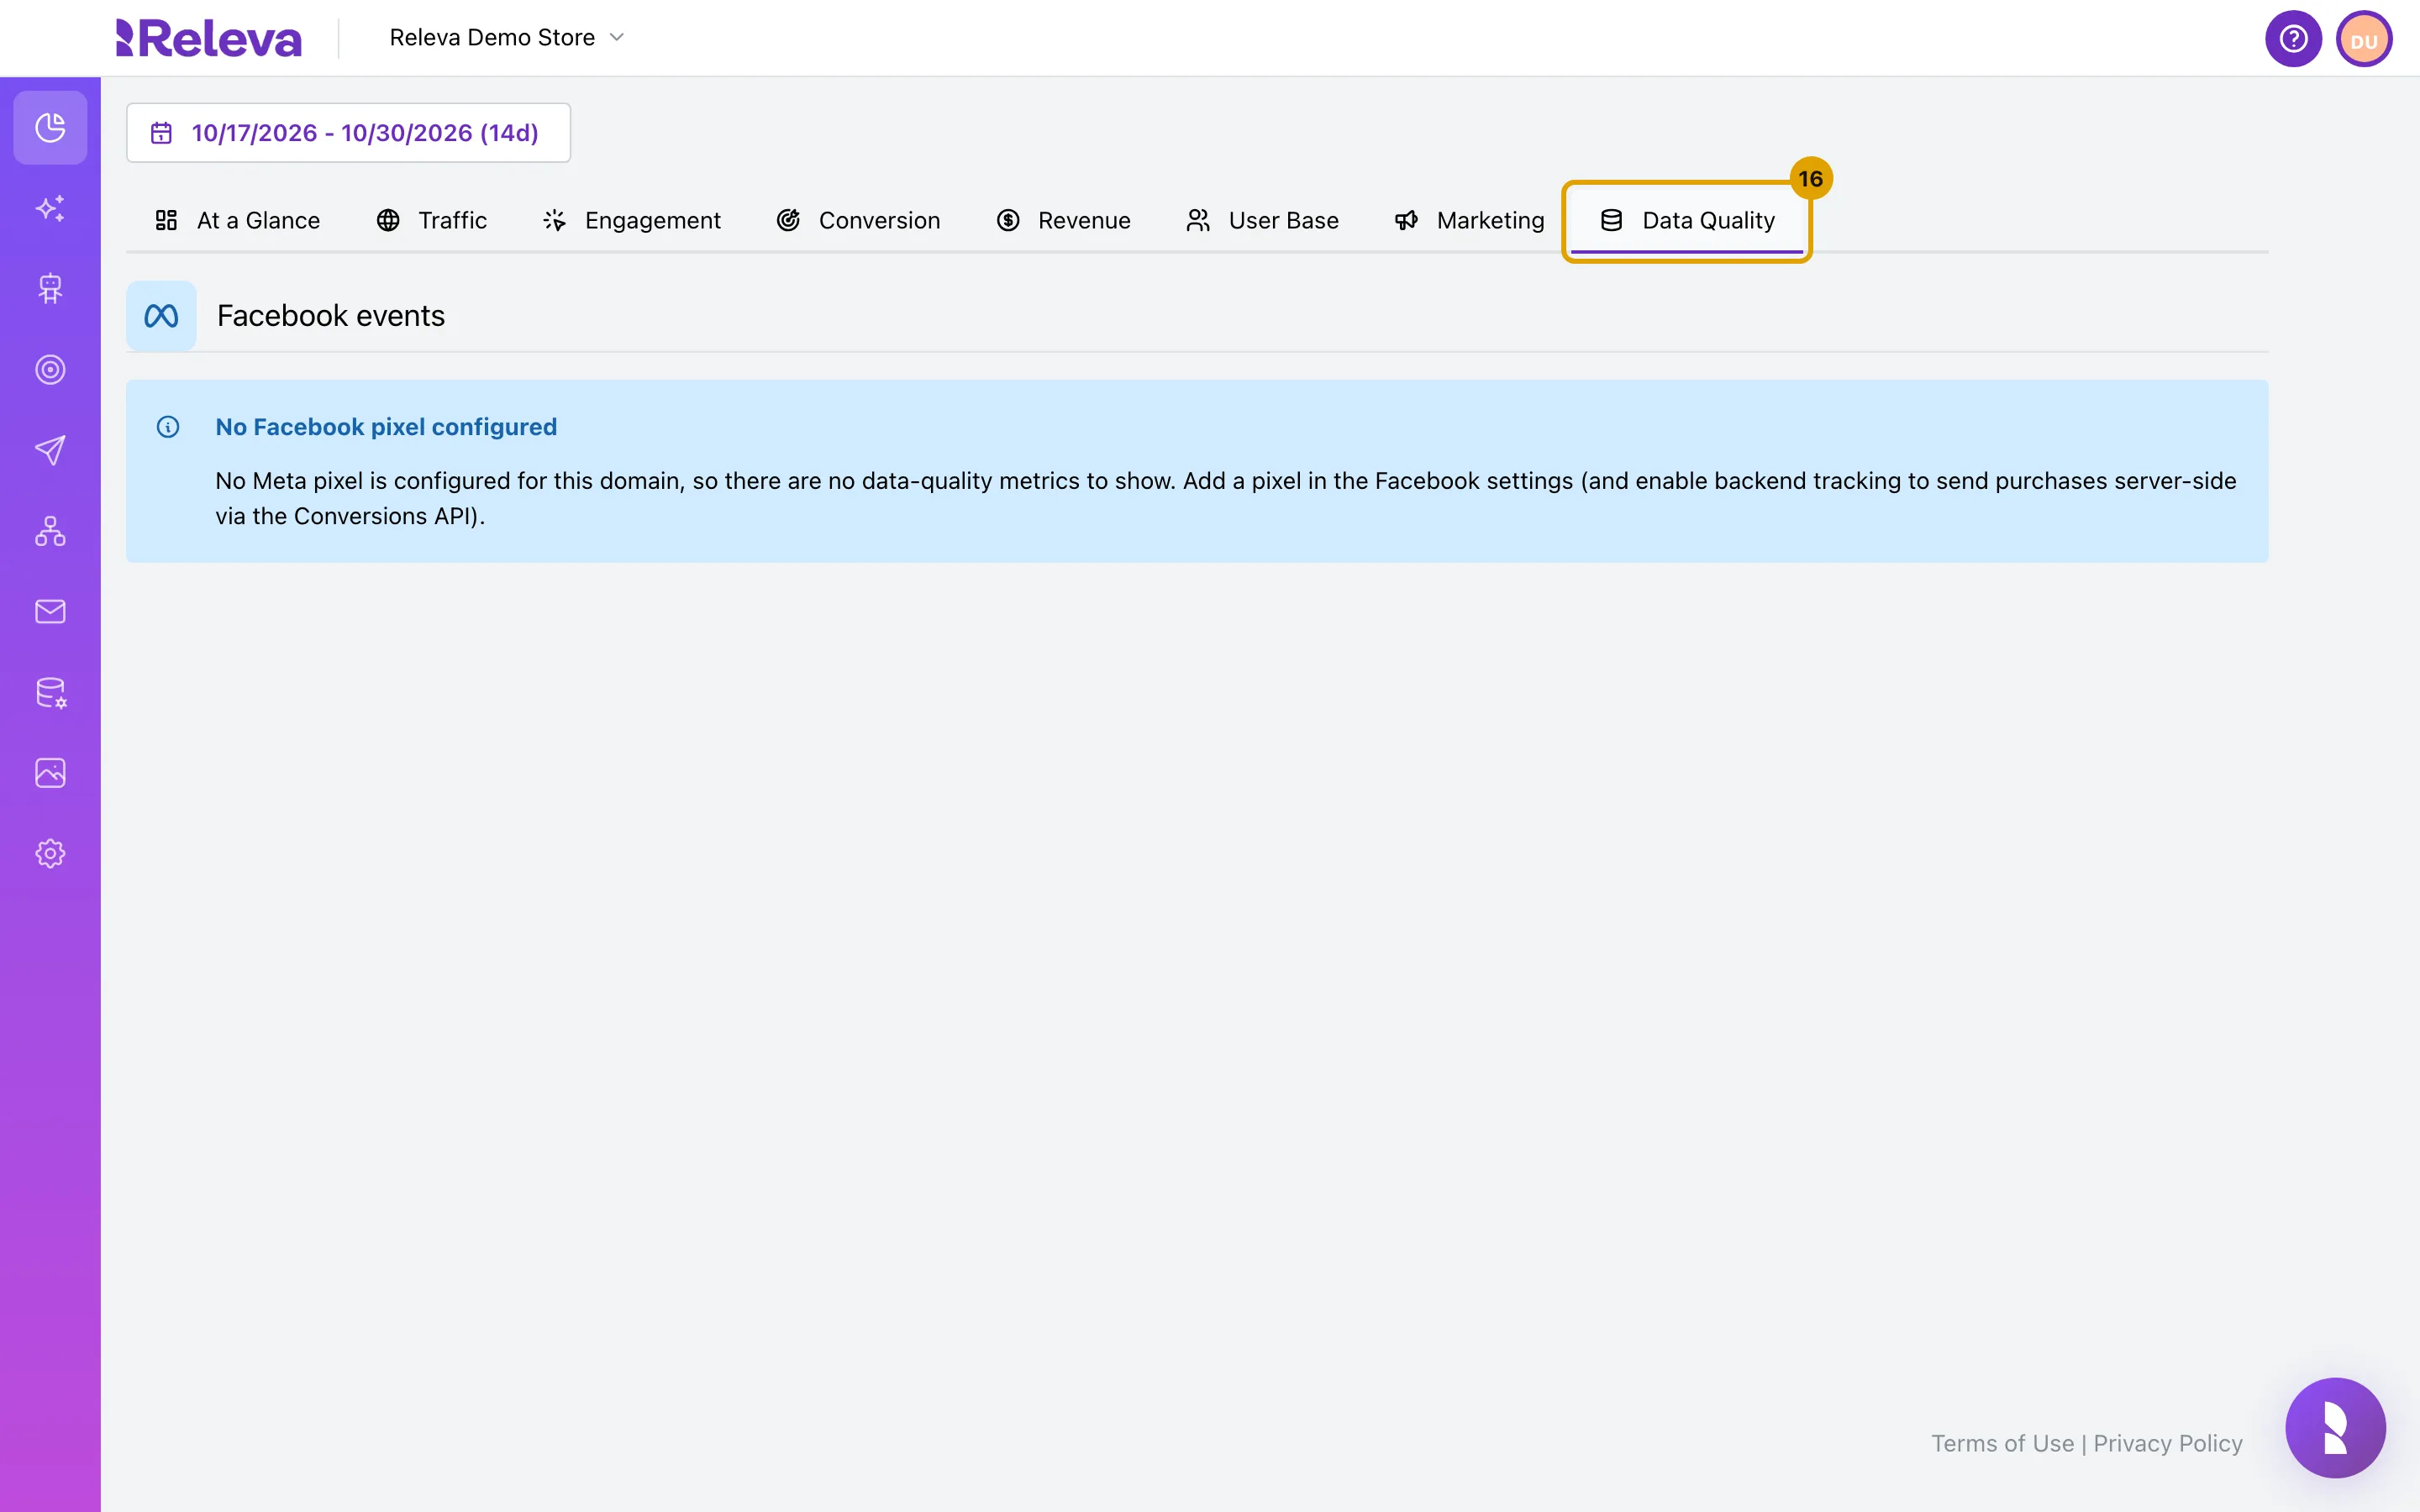
Select the Data Quality tab to check your Meta pixel and Conversions API tracking
On a shop without a Meta pixel the tab reads No Facebook pixel configured, as in the screenshot. Once a pixel is set on the Facebook tab of Settings › Facebook & Whatsapp, the tab shows the event match quality (EMQ · Purchase, out of 10), the hashed email coverage (Email match · Purchase), the Attribution divergence between the purchases the pixel received and the purchases Releva saw, and the trends per event type. See Data Quality and How Facebook Ads work.
Check it worked
Section titled “Check it worked”- The date range button shows the period you picked, for example
(7d), and the caption under the revenue tiles repeats the same dates. - Total store revenue matches what your shop took in the period. If it is far off, orders are not reaching Releva: see Check that an event reached Releva.
- Attributed orders on the orders page equals the number of rows in the table, and the sum of the Attributed column equals Attributed revenue.
- Every tab shows the same period in the date range button, and each tile carries an arrow against the previous period.
Troubleshooting
Section titled “Troubleshooting”Apply is disabled. You have picked a start day but not an end day. Select the end day in the calendar, or use a preset.
The funnel card says it could not be measured. The funnel is the slowest report on the page and timed out for the period. Pick a shorter period.
The funnel card says no events were recorded for a step. The event the step starts from is not being tracked. Check that the event reaches Releva, or edit the funnel to start from one that is.
The funnel card is missing. The shop has no starred funnel. Only one funnel is shown on At a Glance.
The attributed orders list is empty. No order in the period followed a Releva message or an on-site click within the attribution window, or the events that record it are not reaching Releva. The Data Quality tab reports the latter for Meta pixel tracking.
A channel tile is missing from “Sent through campaigns”. Only channels your shop has set up get a tile. Set the channel up under Marketing Channels and it appears.
The period reset to 14 days. The dashboard period lives on the page only. Leaving the page, including through View attributed orders, resets it. The attributed orders page keeps its own period in the URL.
A tab shows a spinner for a moment. The first tab you open after At a Glance loads the period’s statistics for all seven tabs. The next tabs open at once.
Data Quality says No Facebook pixel configured. The tab reports Meta pixel tracking only. Add a pixel on the Facebook tab of Settings › Facebook & Whatsapp, and enable backend tracking to send purchases server-side through the Conversions API.
A comparison reads +100% or a very large percentage. The previous period had little or no data, for example because tracking started inside it. Pick a period that leaves a full previous period of tracked events.