

See which products are trending
Product Trends ranks your categories and products for a period: which ones were viewed most, bought most, earned most, were viewed while out of stock, or were added to carts but never bought. This guide shows you how to read the page. For how each trend is counted, read How product trends work.
Before you start
Section titled “Before you start”- Your shop tracks product views, cart additions and orders. Every trend is built from these events, so a shop that only sends page views gets empty cards. See How events get into Releva.
- Your plan includes Product Trends. If Product Trends in the Analytics menu is greyed out, ask your account owner to unlock it. The lock icon next to the entry only appears for users who can manage the subscription.
-
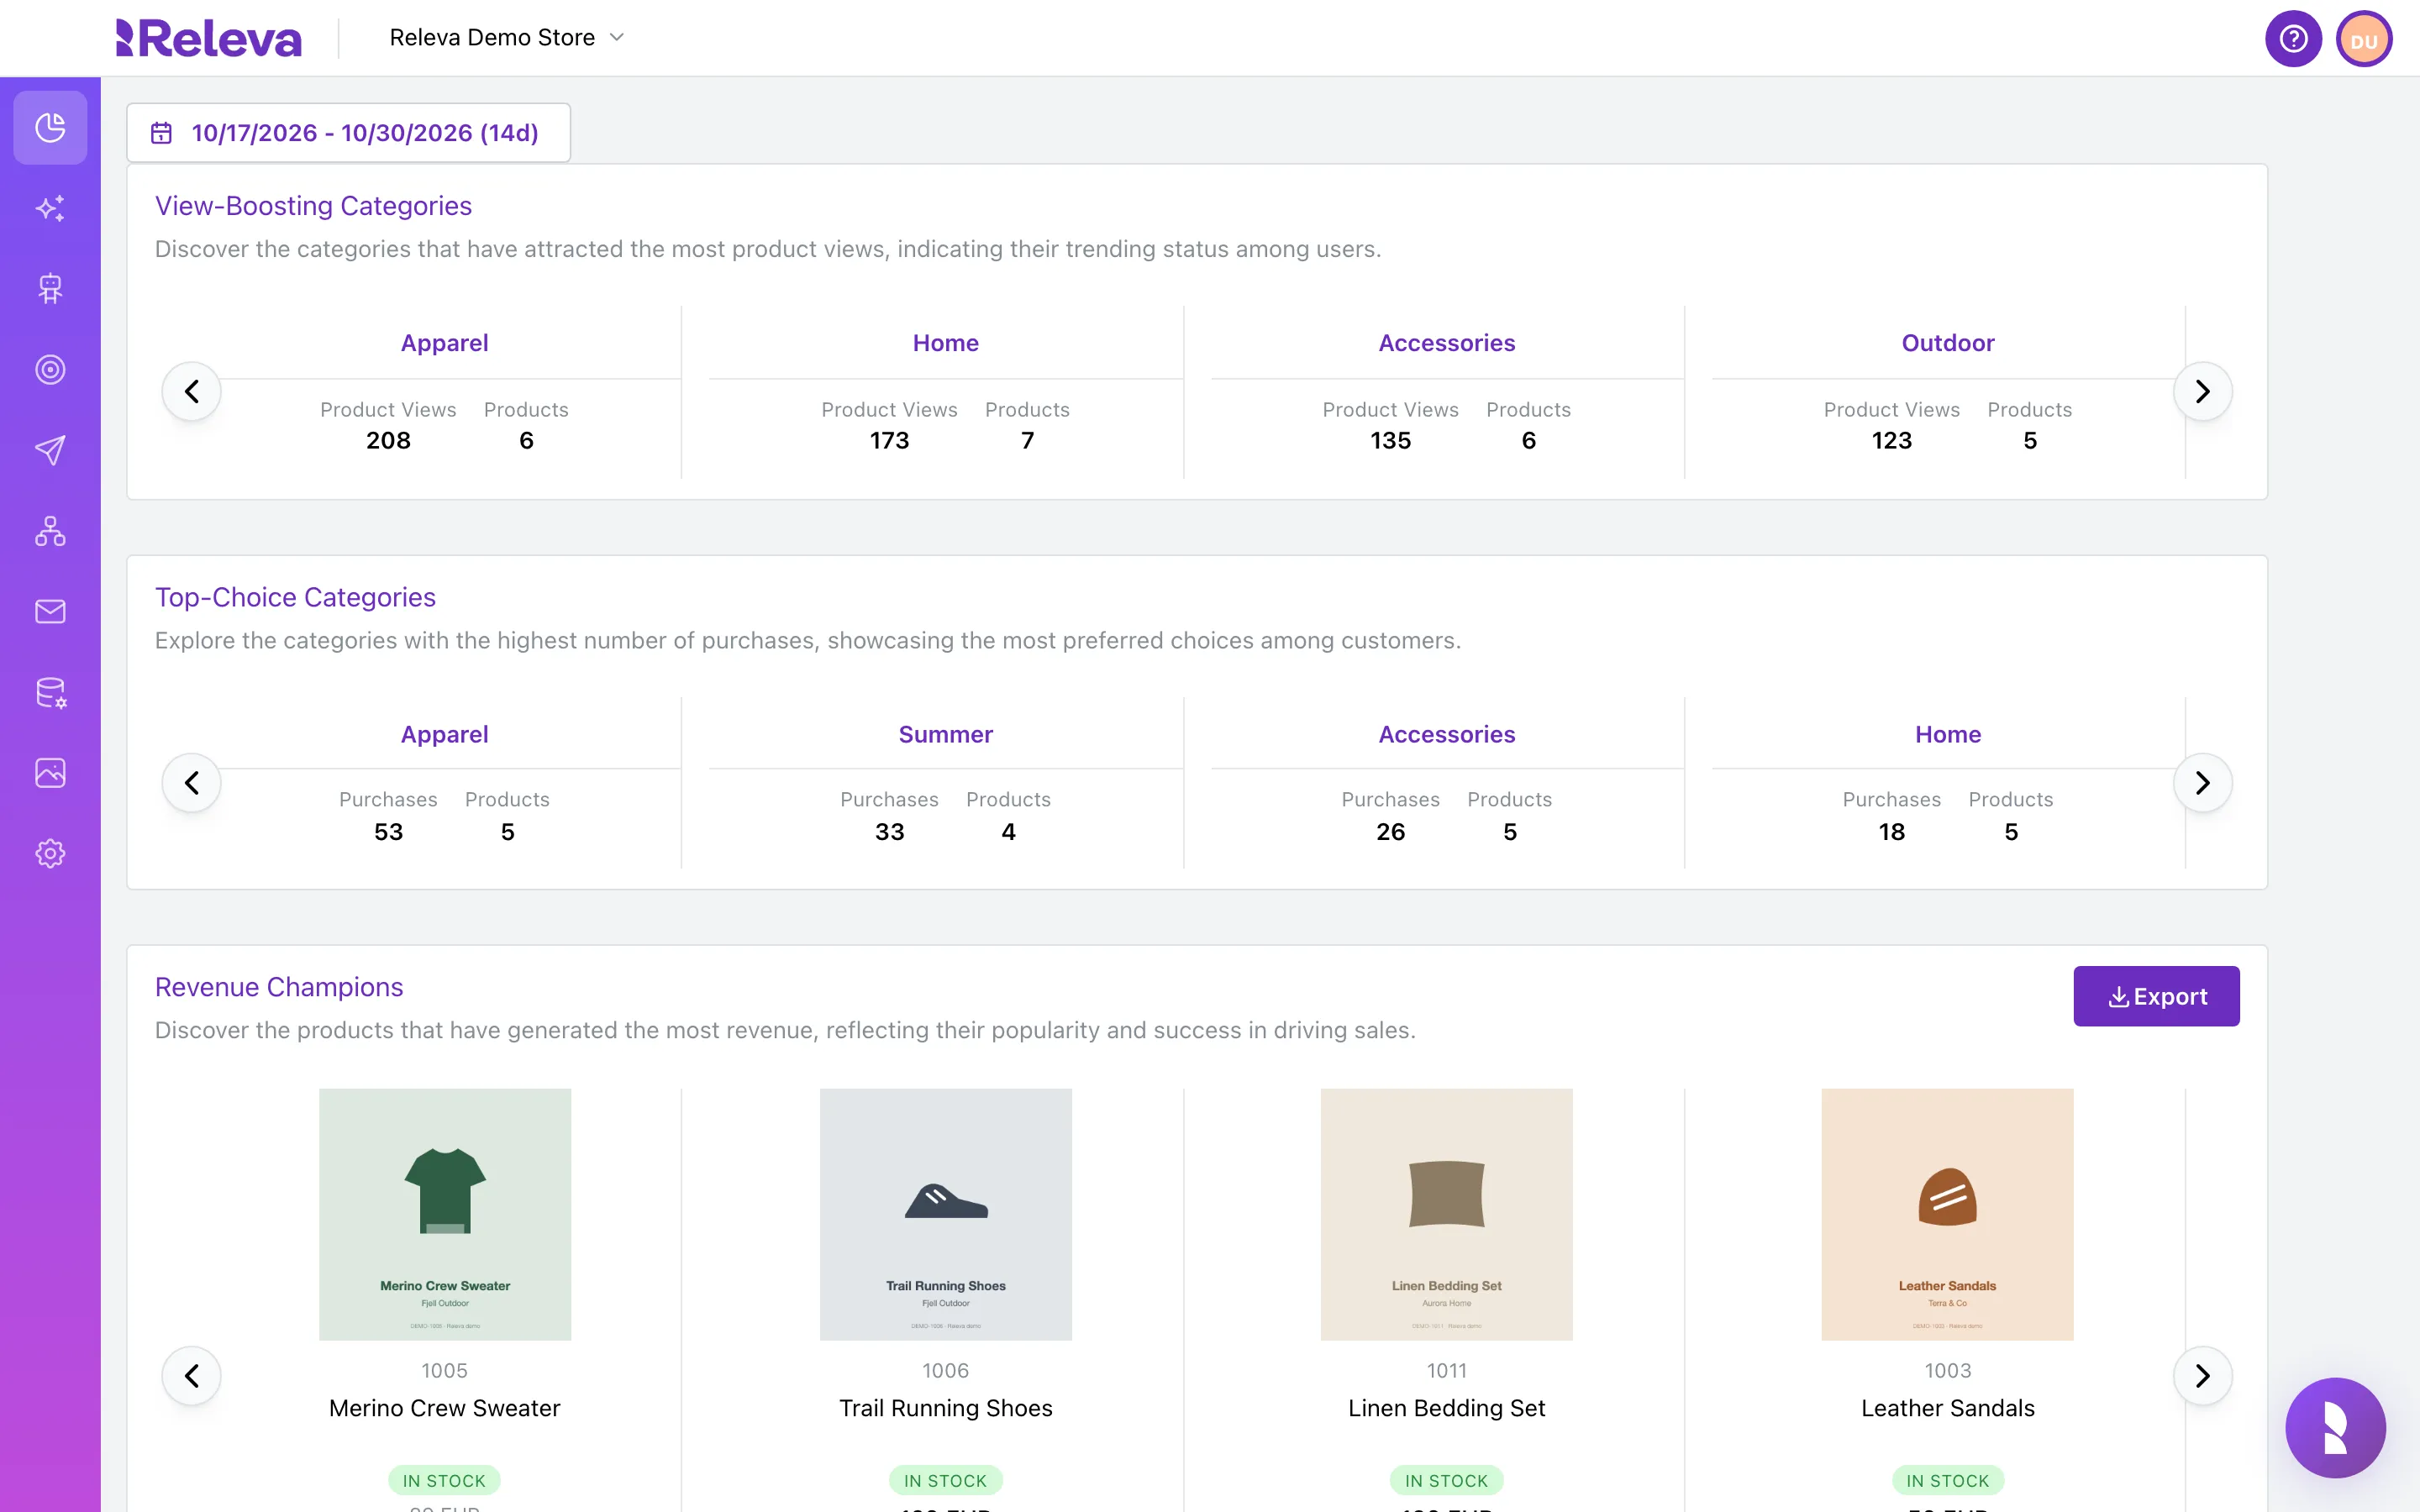
Go to Analytics › Product Trends
The page loads all eleven cards for the period at once; a spinner shows until they are ready.
-
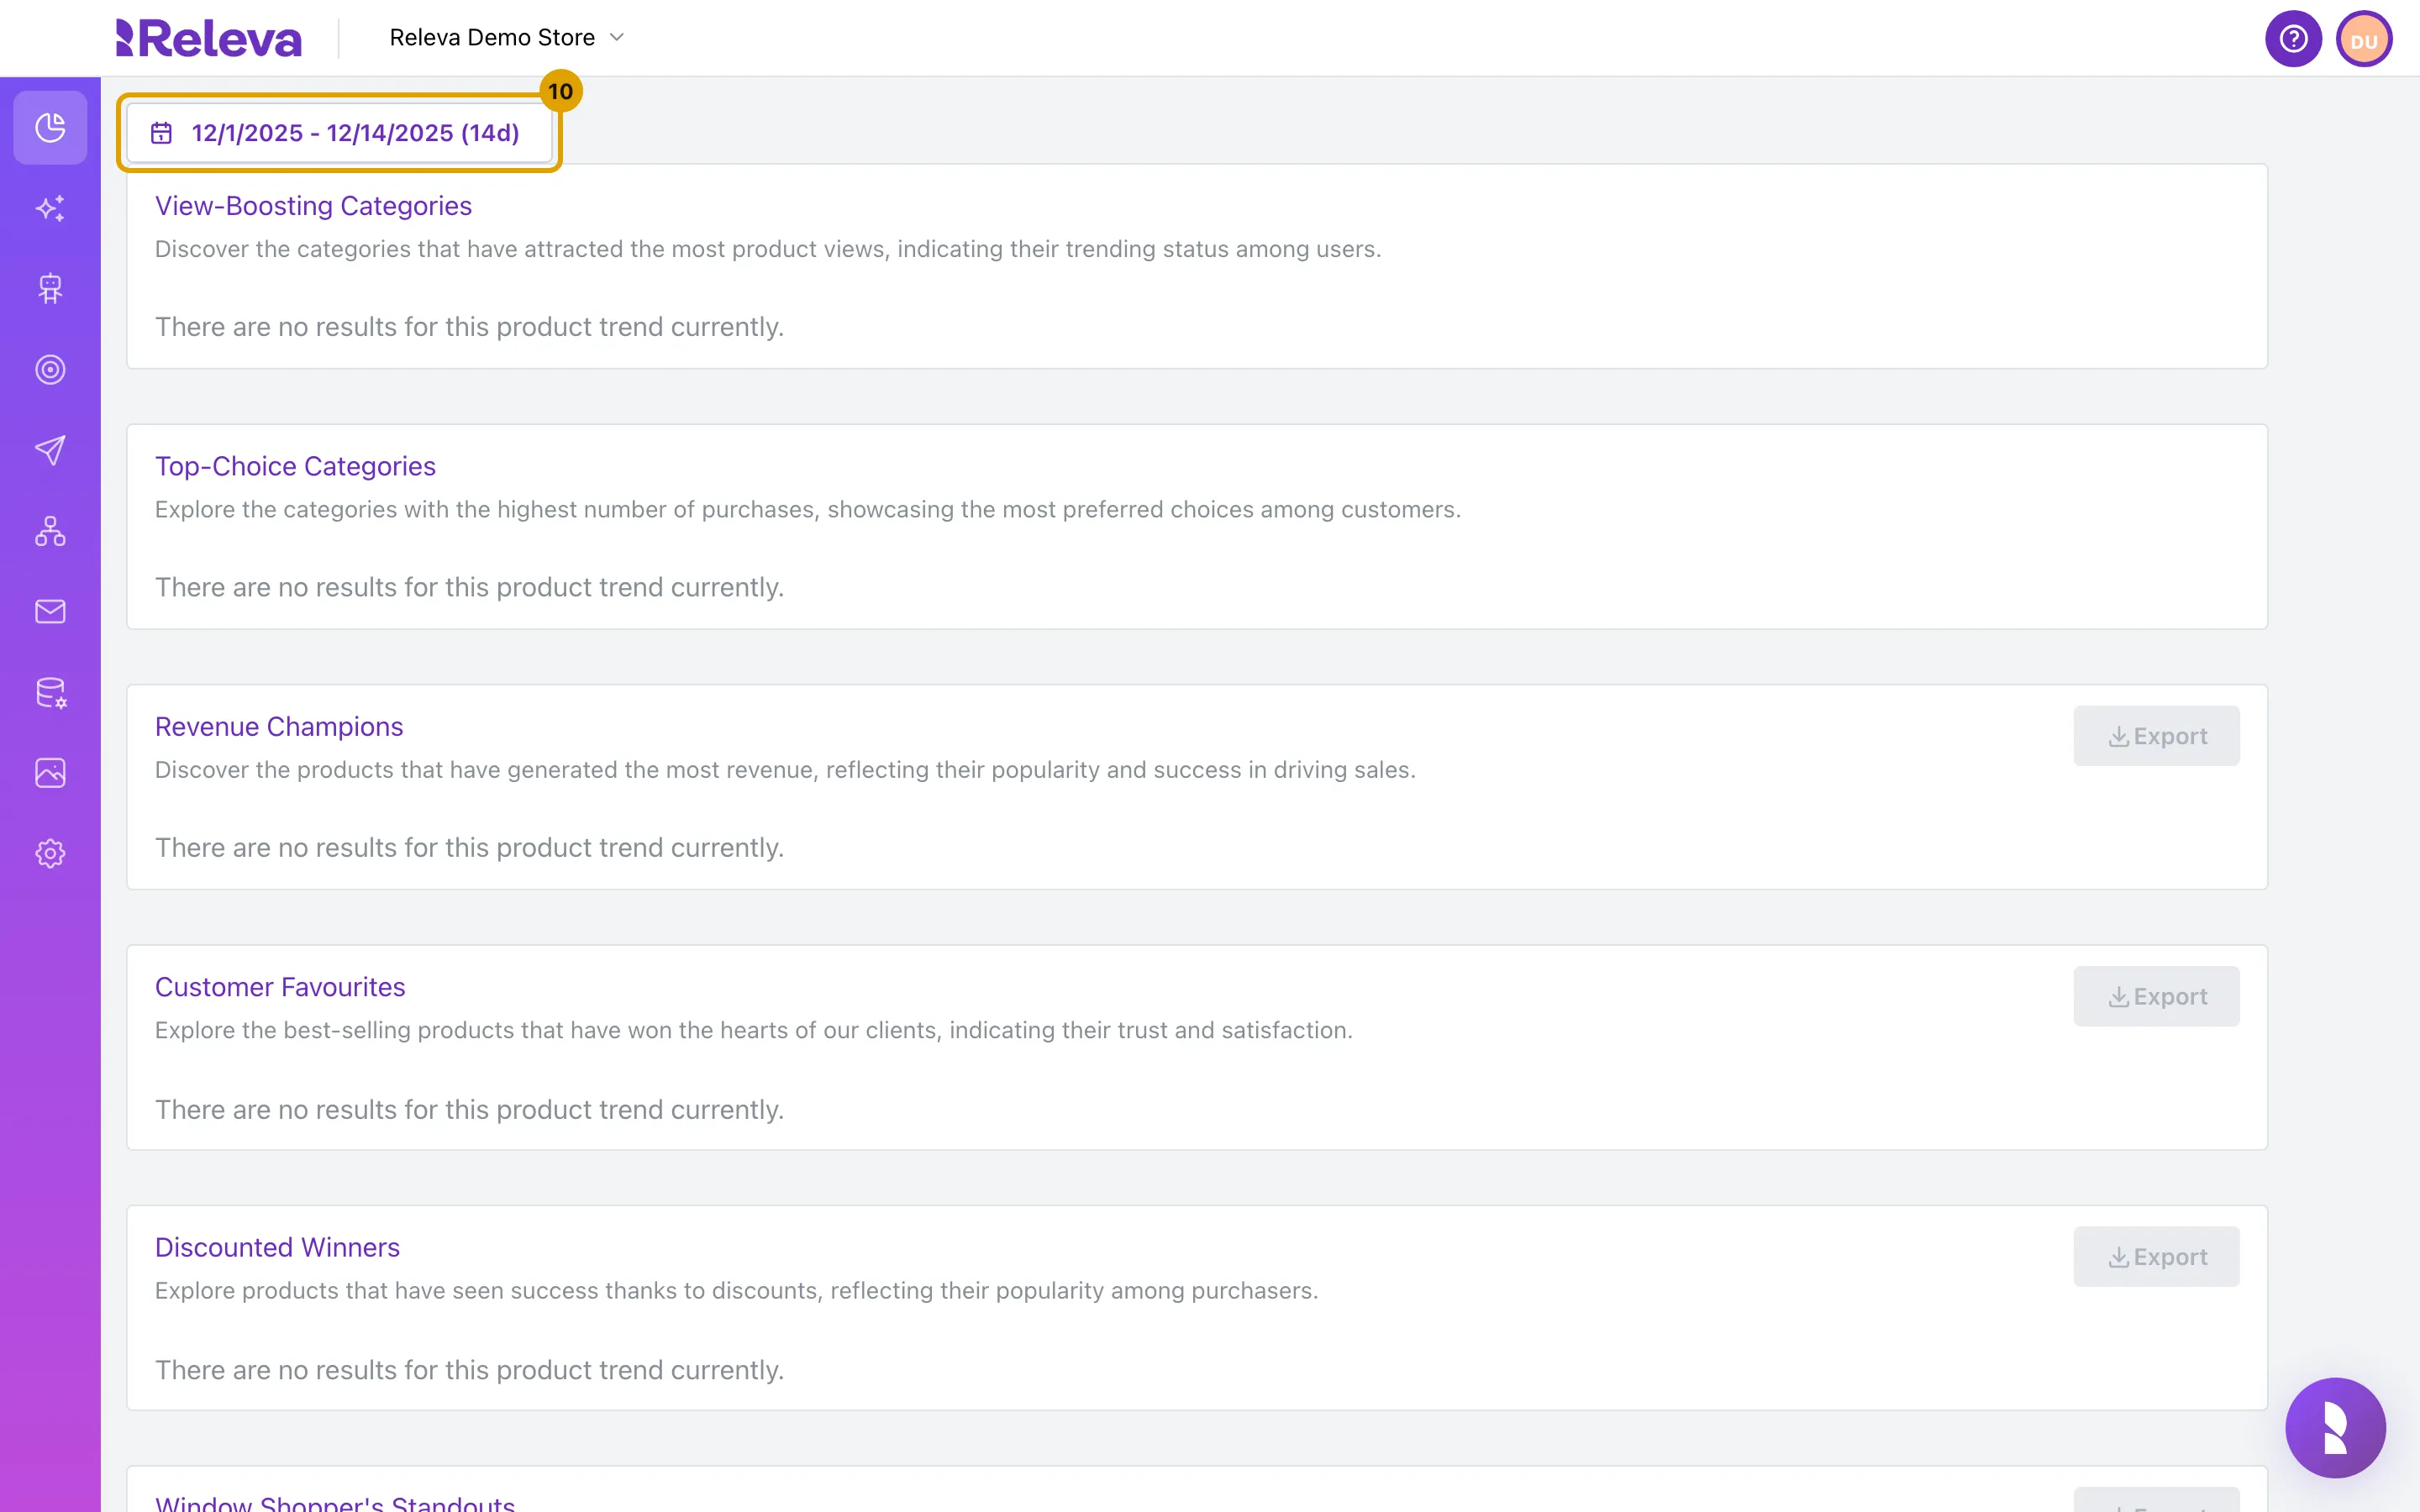
Select the date range at the top of the page. By default it shows the last 14 days
The button reads
<start> - <end> (<days>d).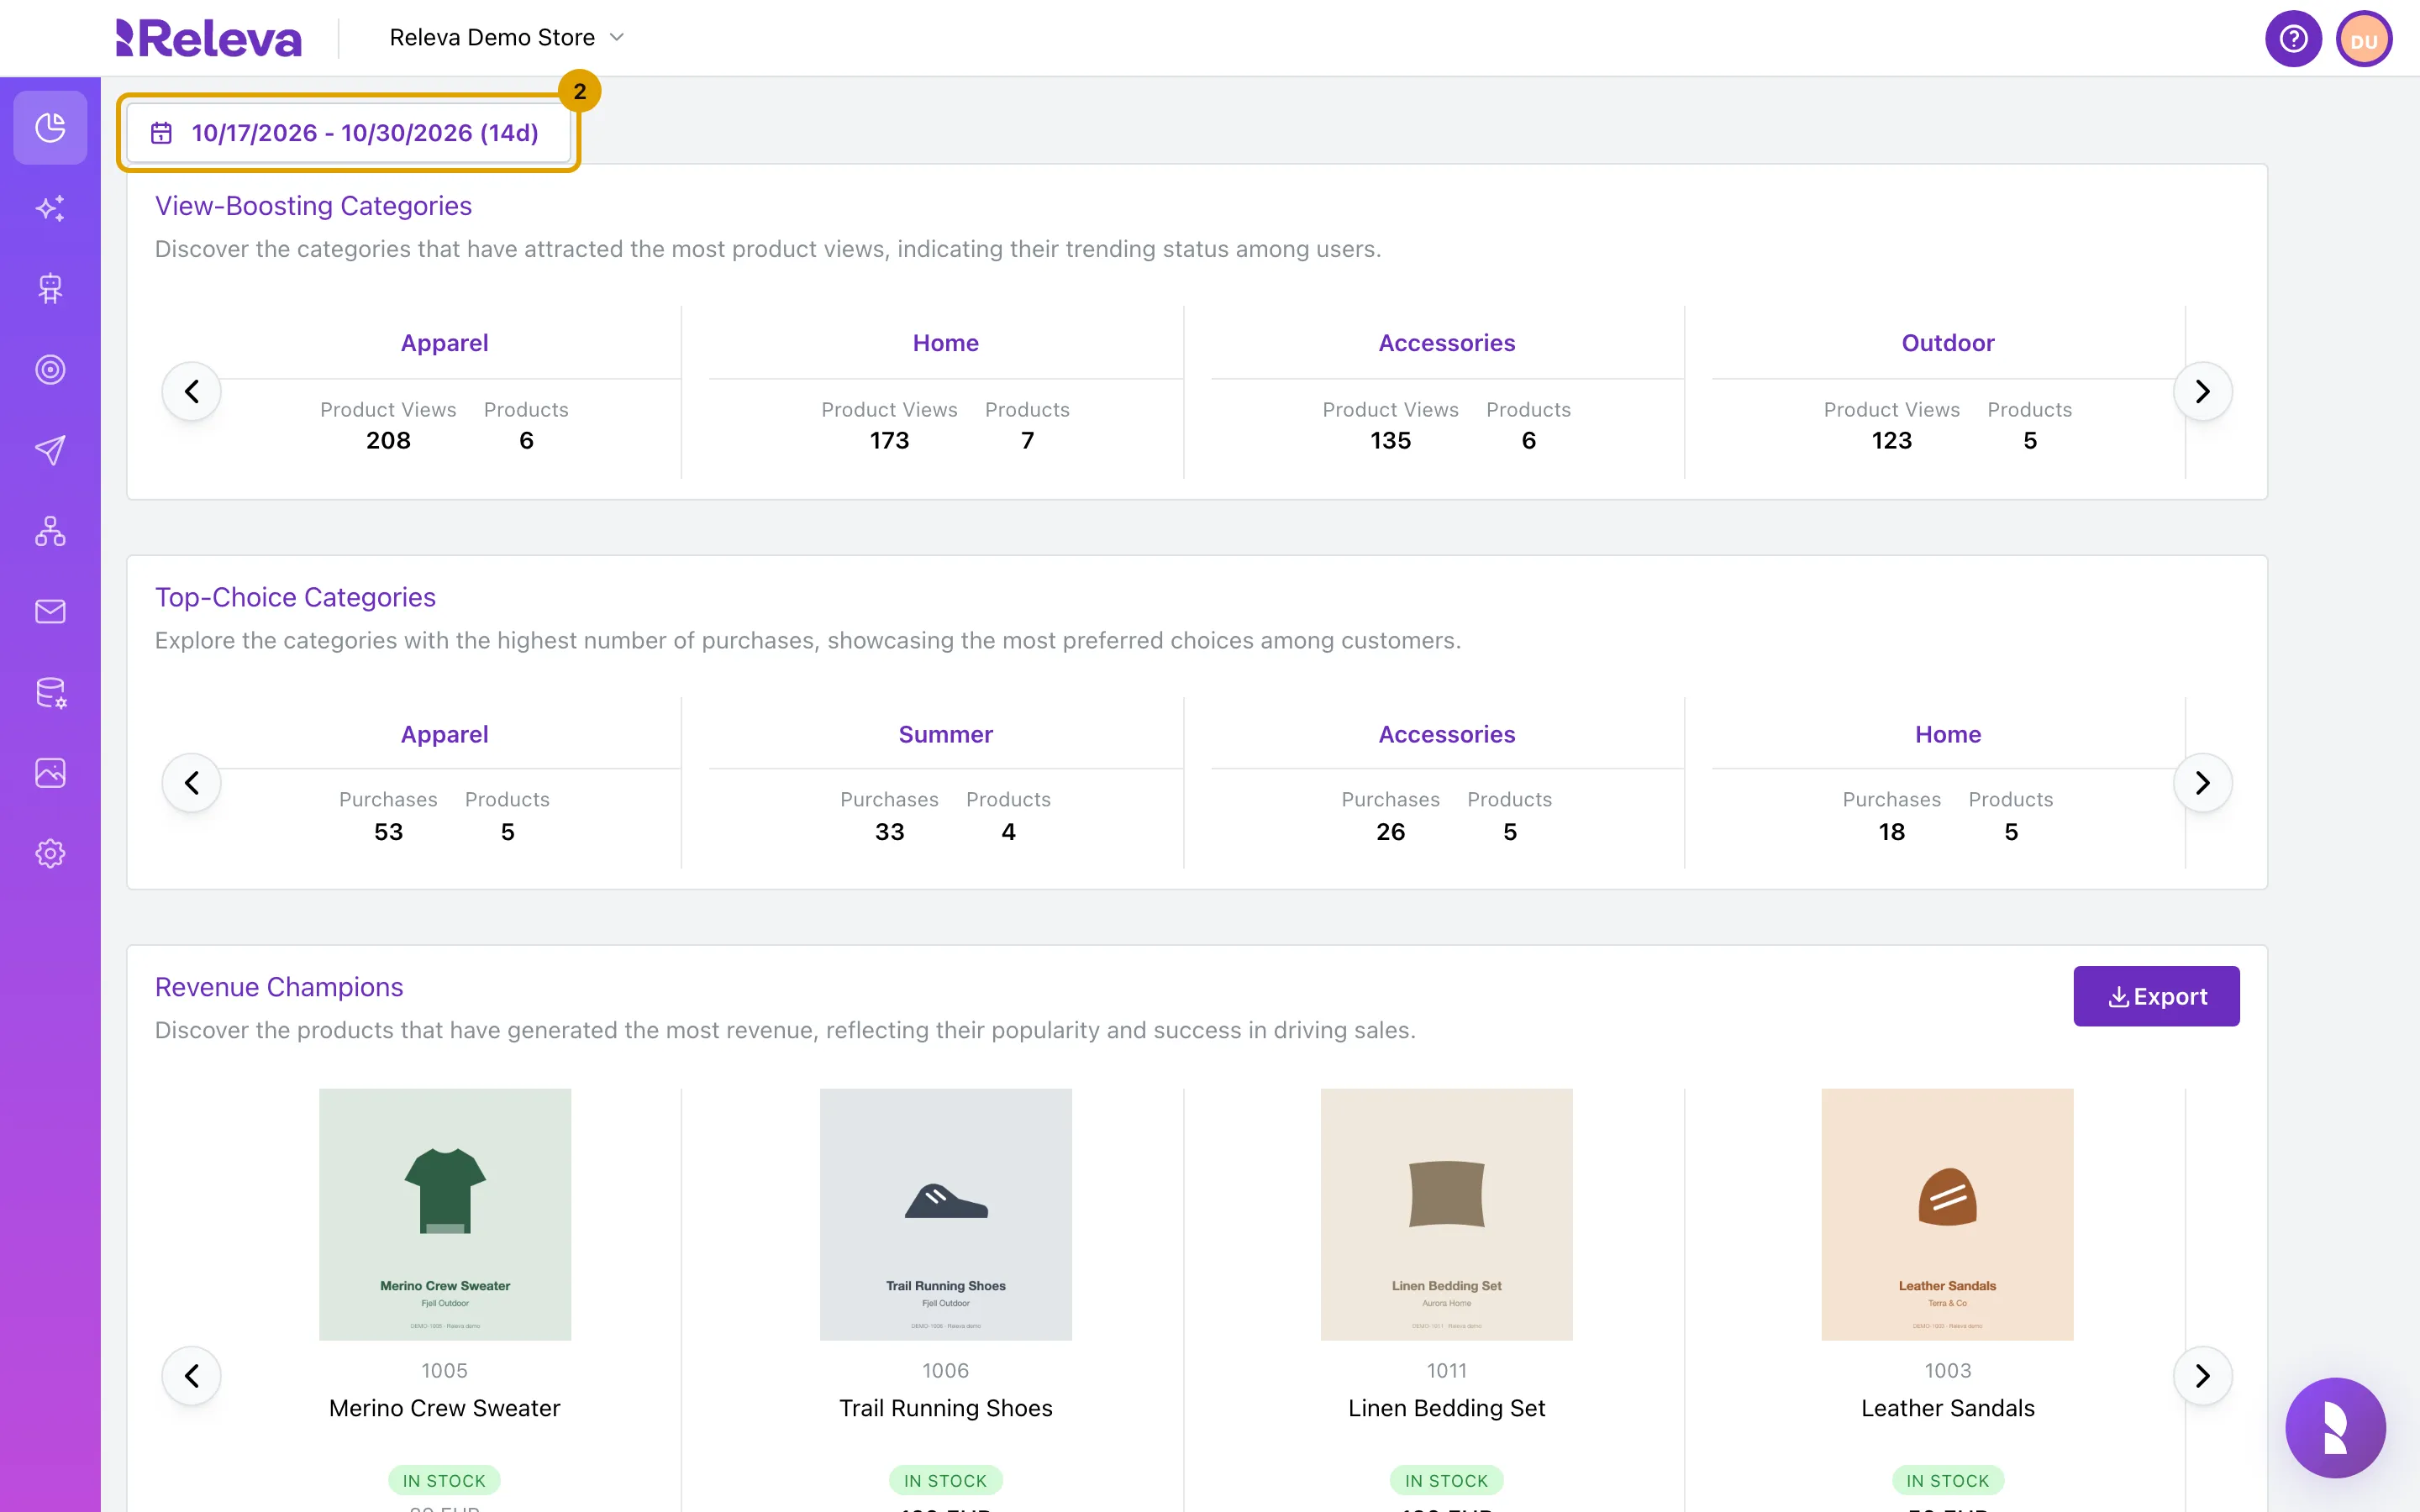
-
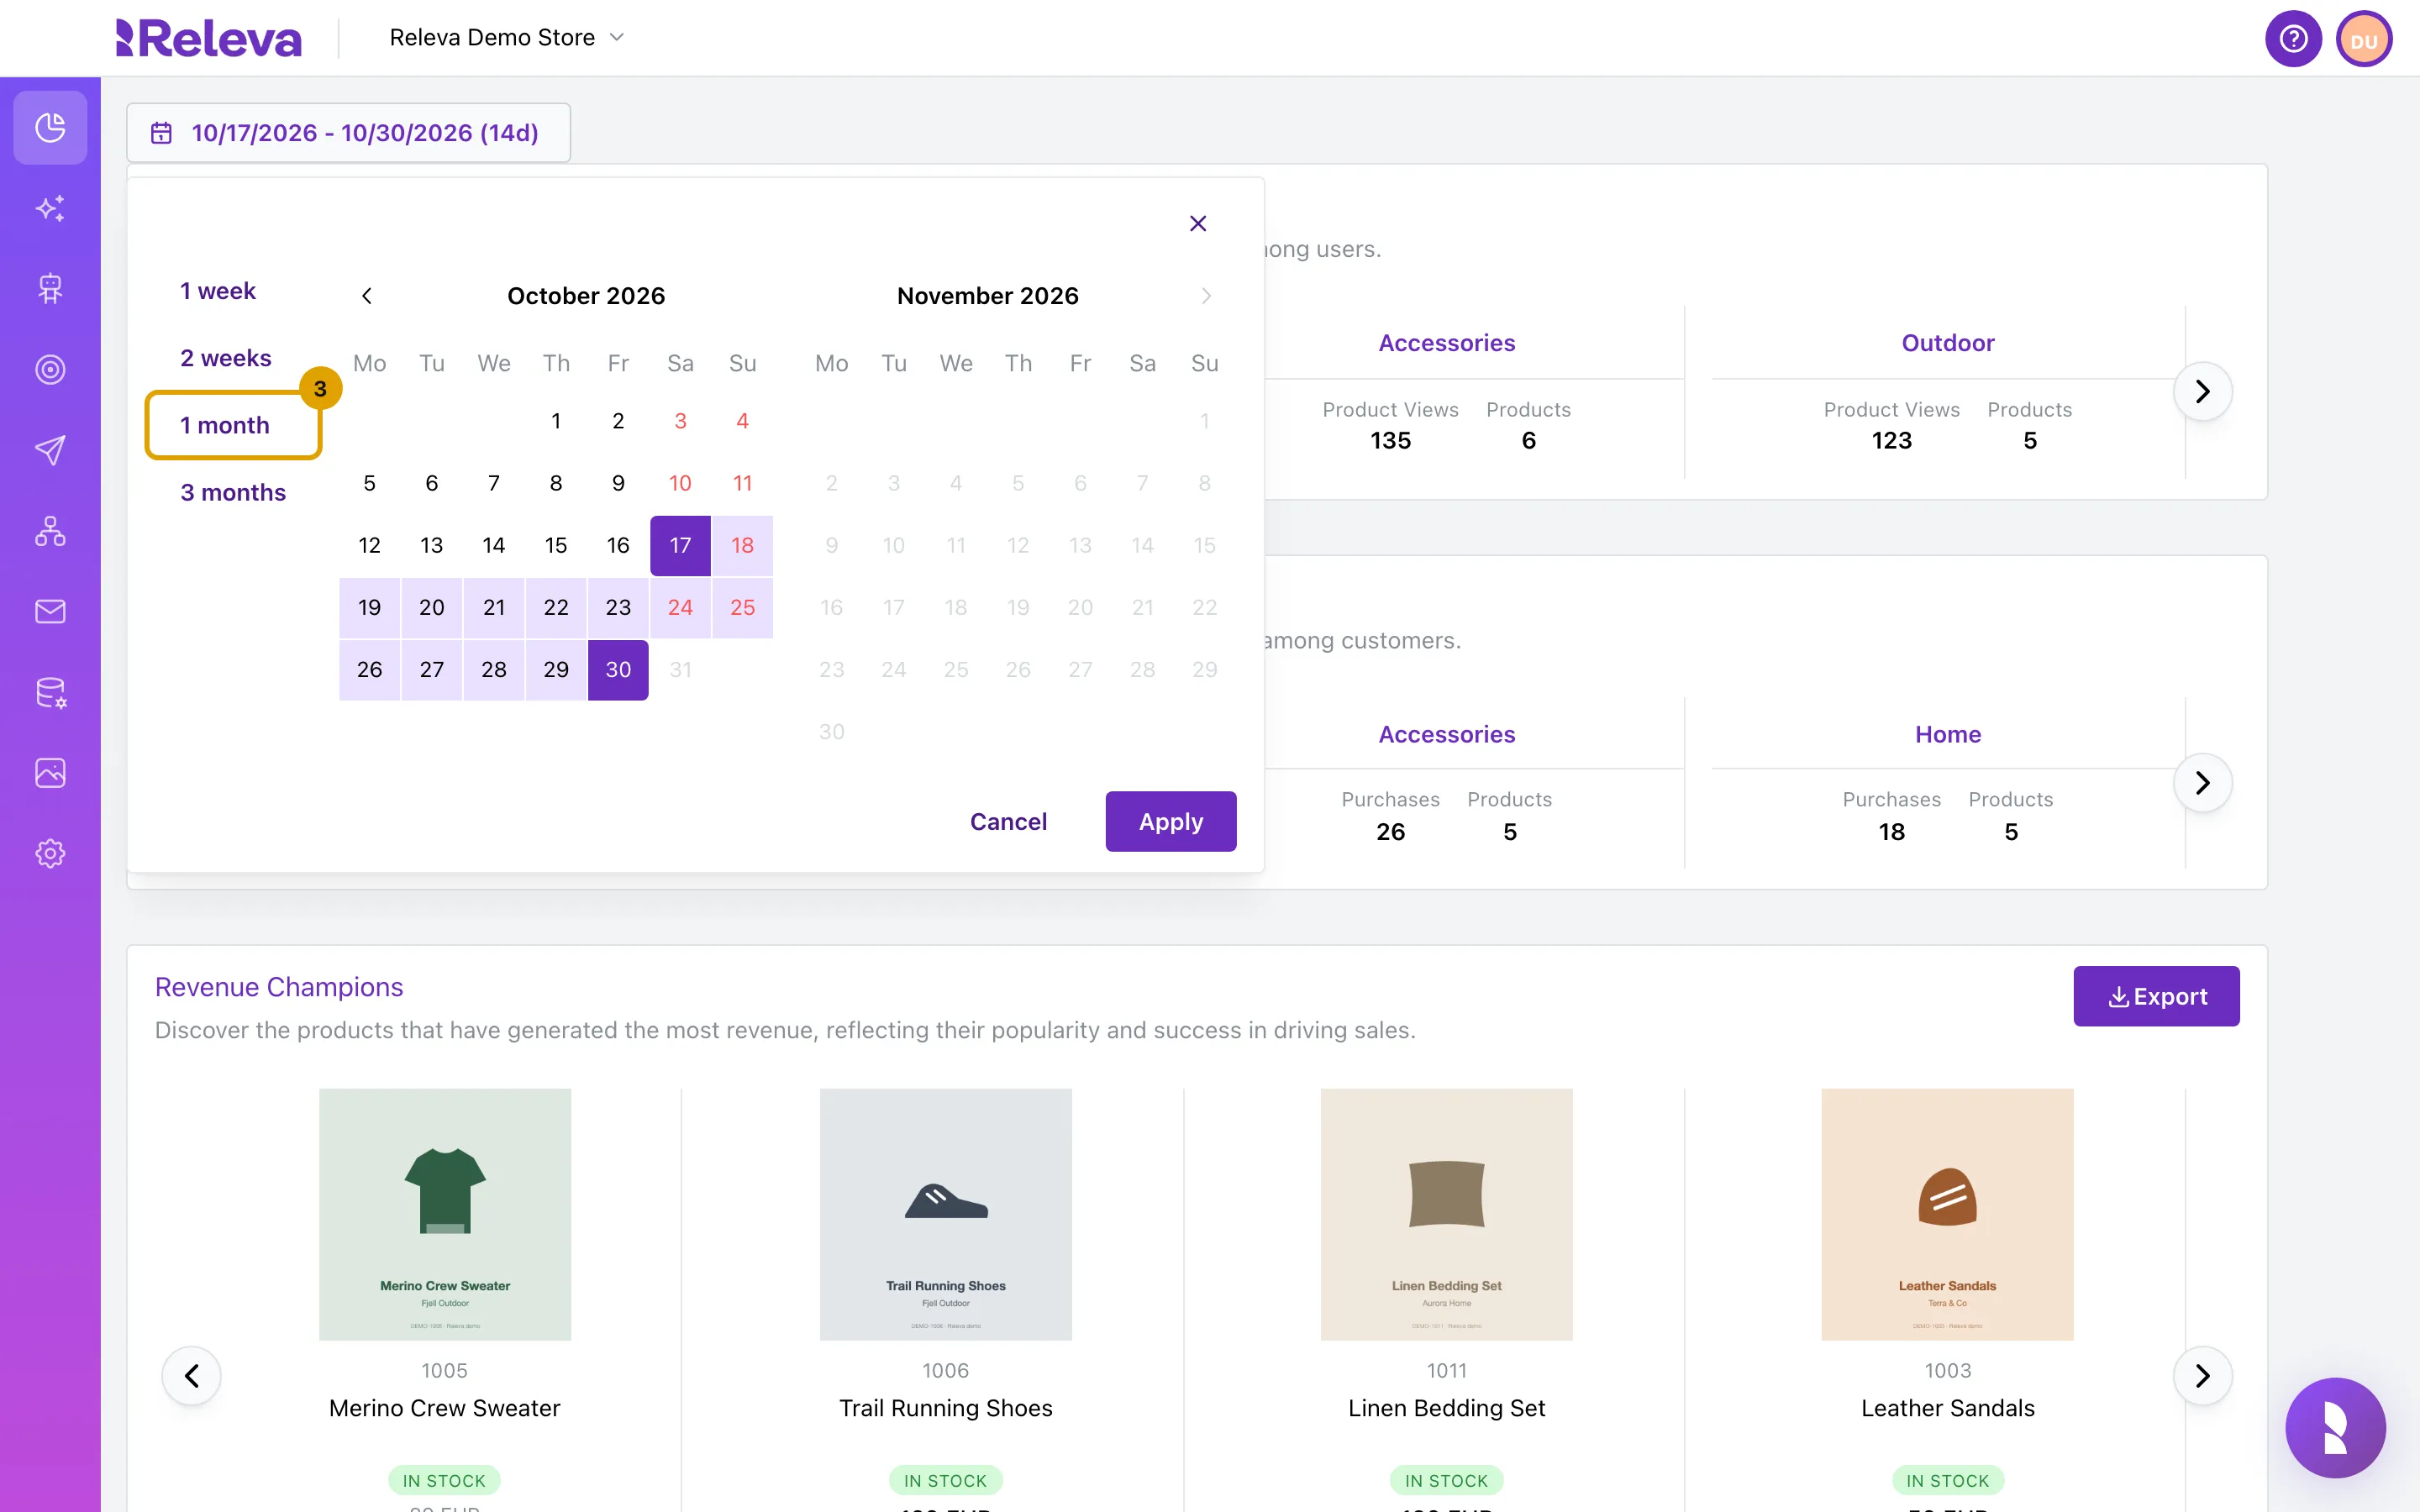
Choose a preset such as 1 month, or pick a start and end date in the calendar and select Apply
The presets are 1 week, 2 weeks, 1 month and 3 months; they apply at once. The calendar does not let you pick a date after today, and Apply stays disabled until you pick an end date. Changing the period reloads every card.
-
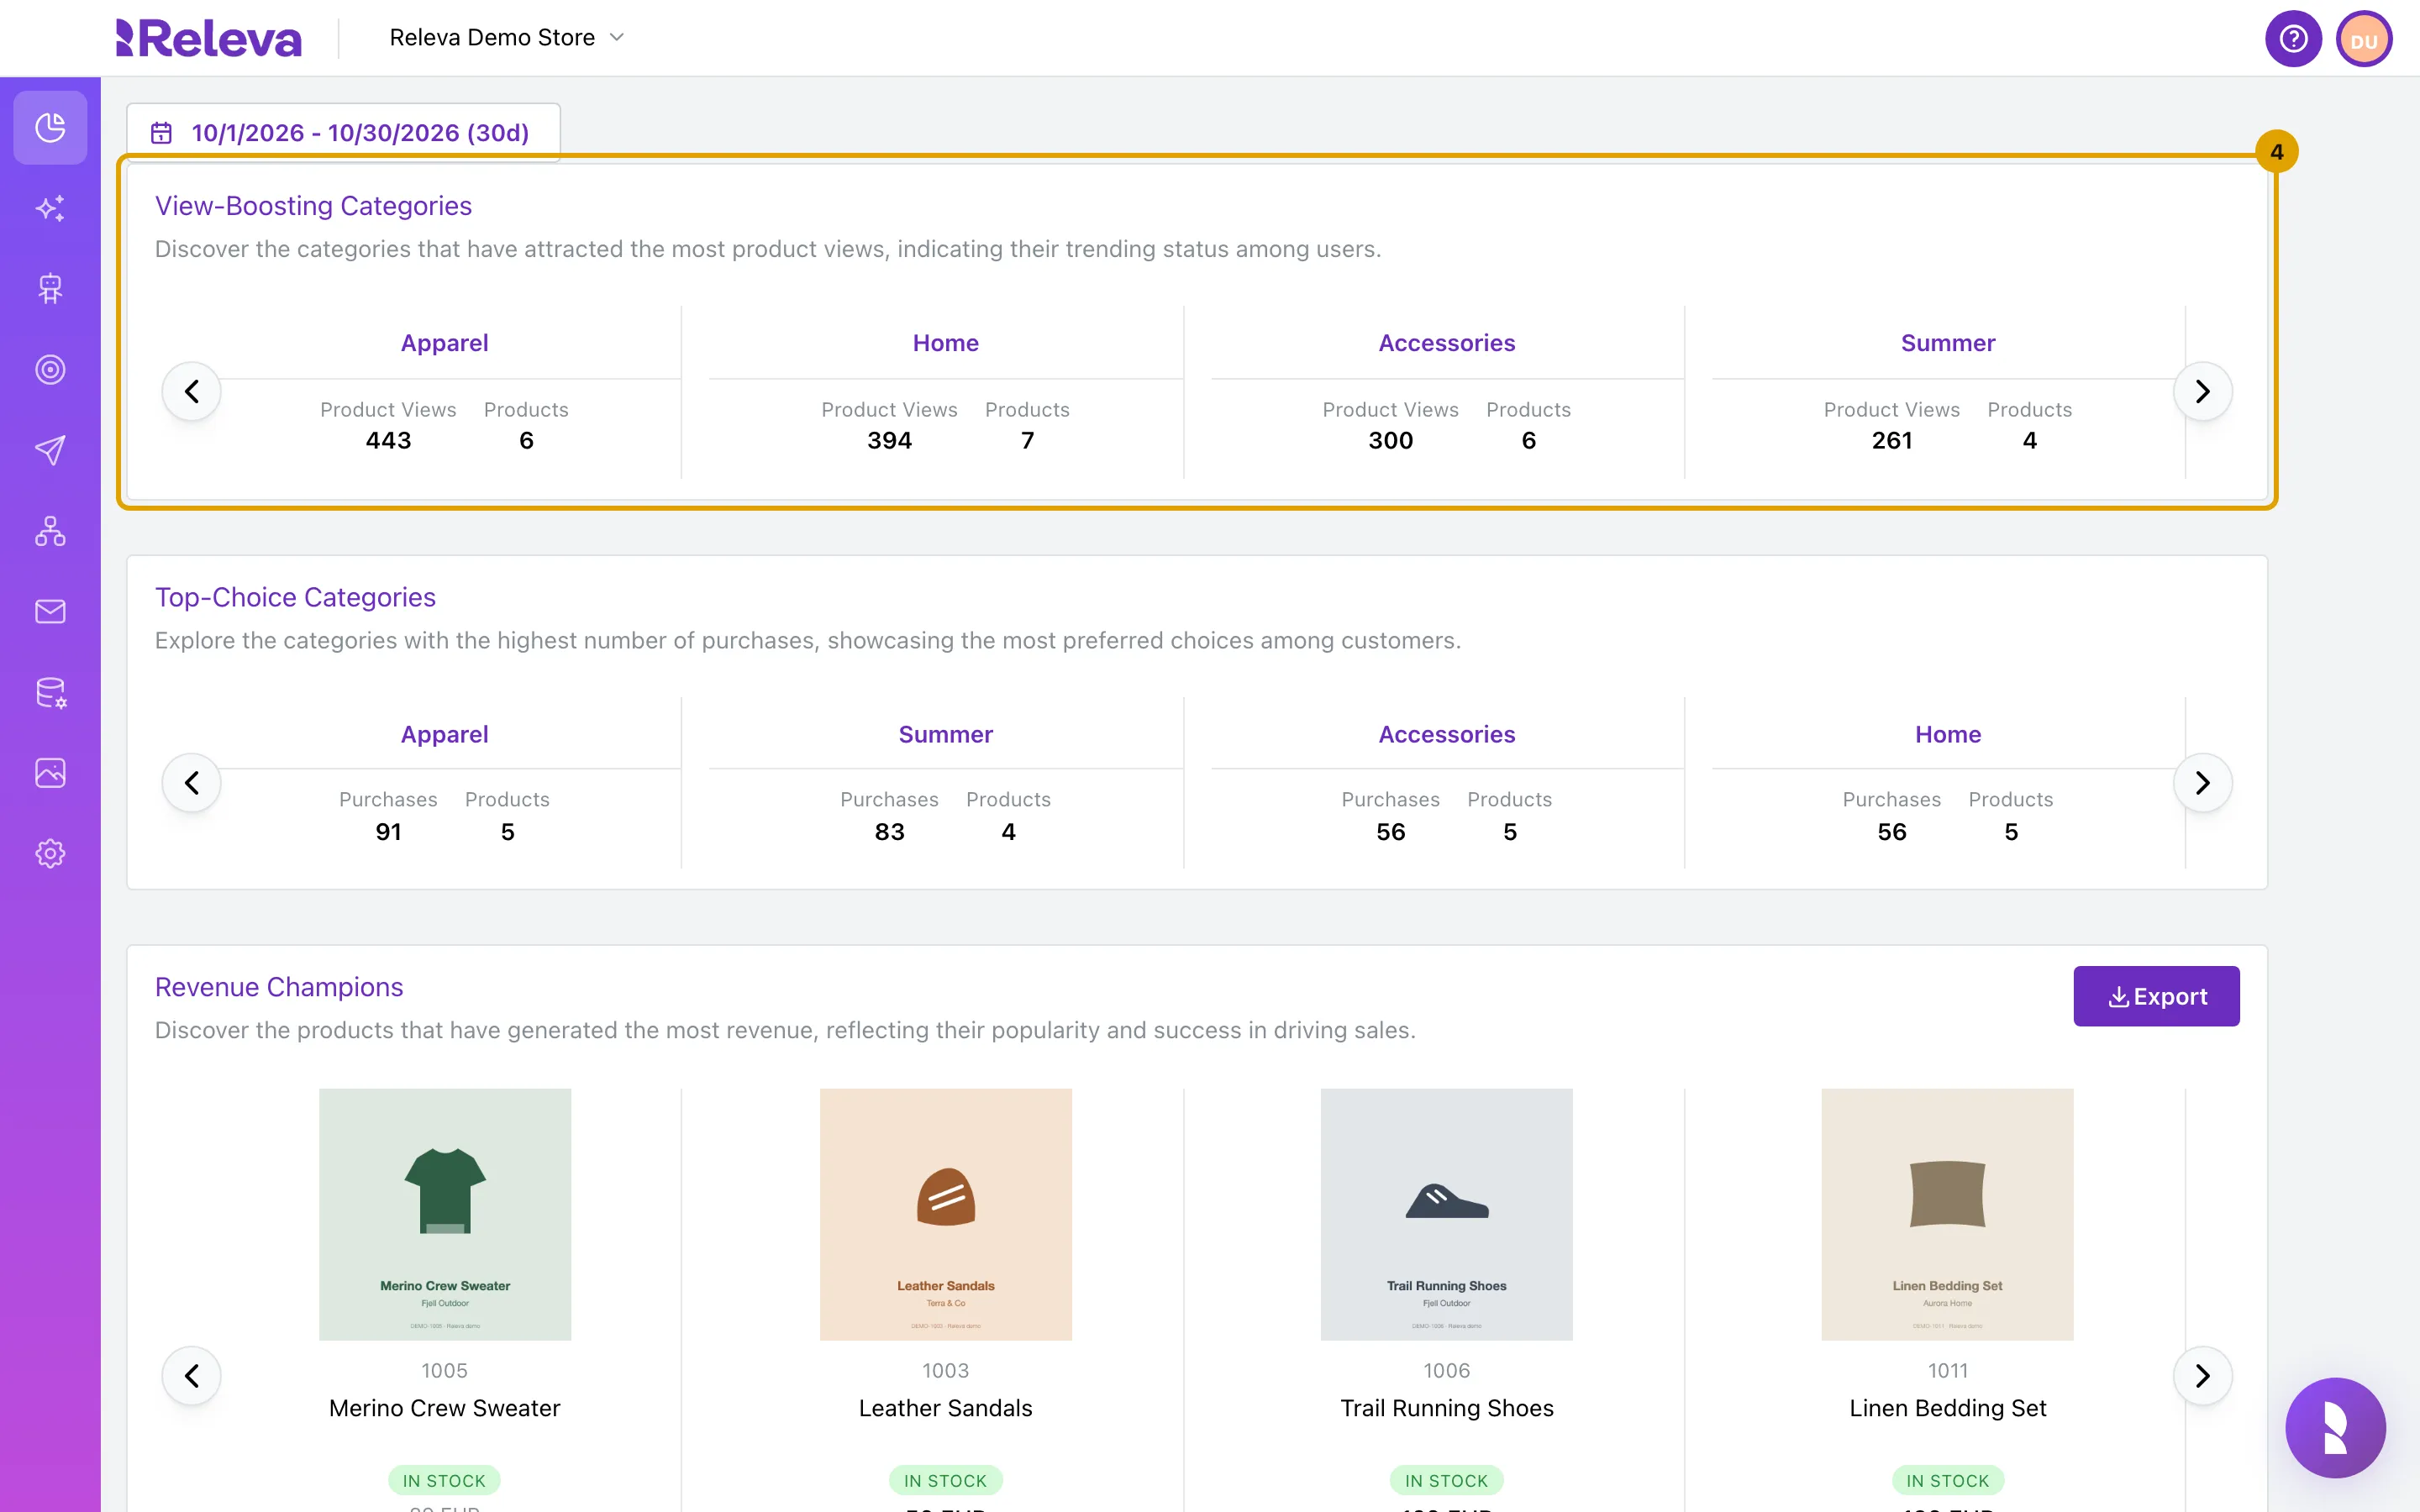
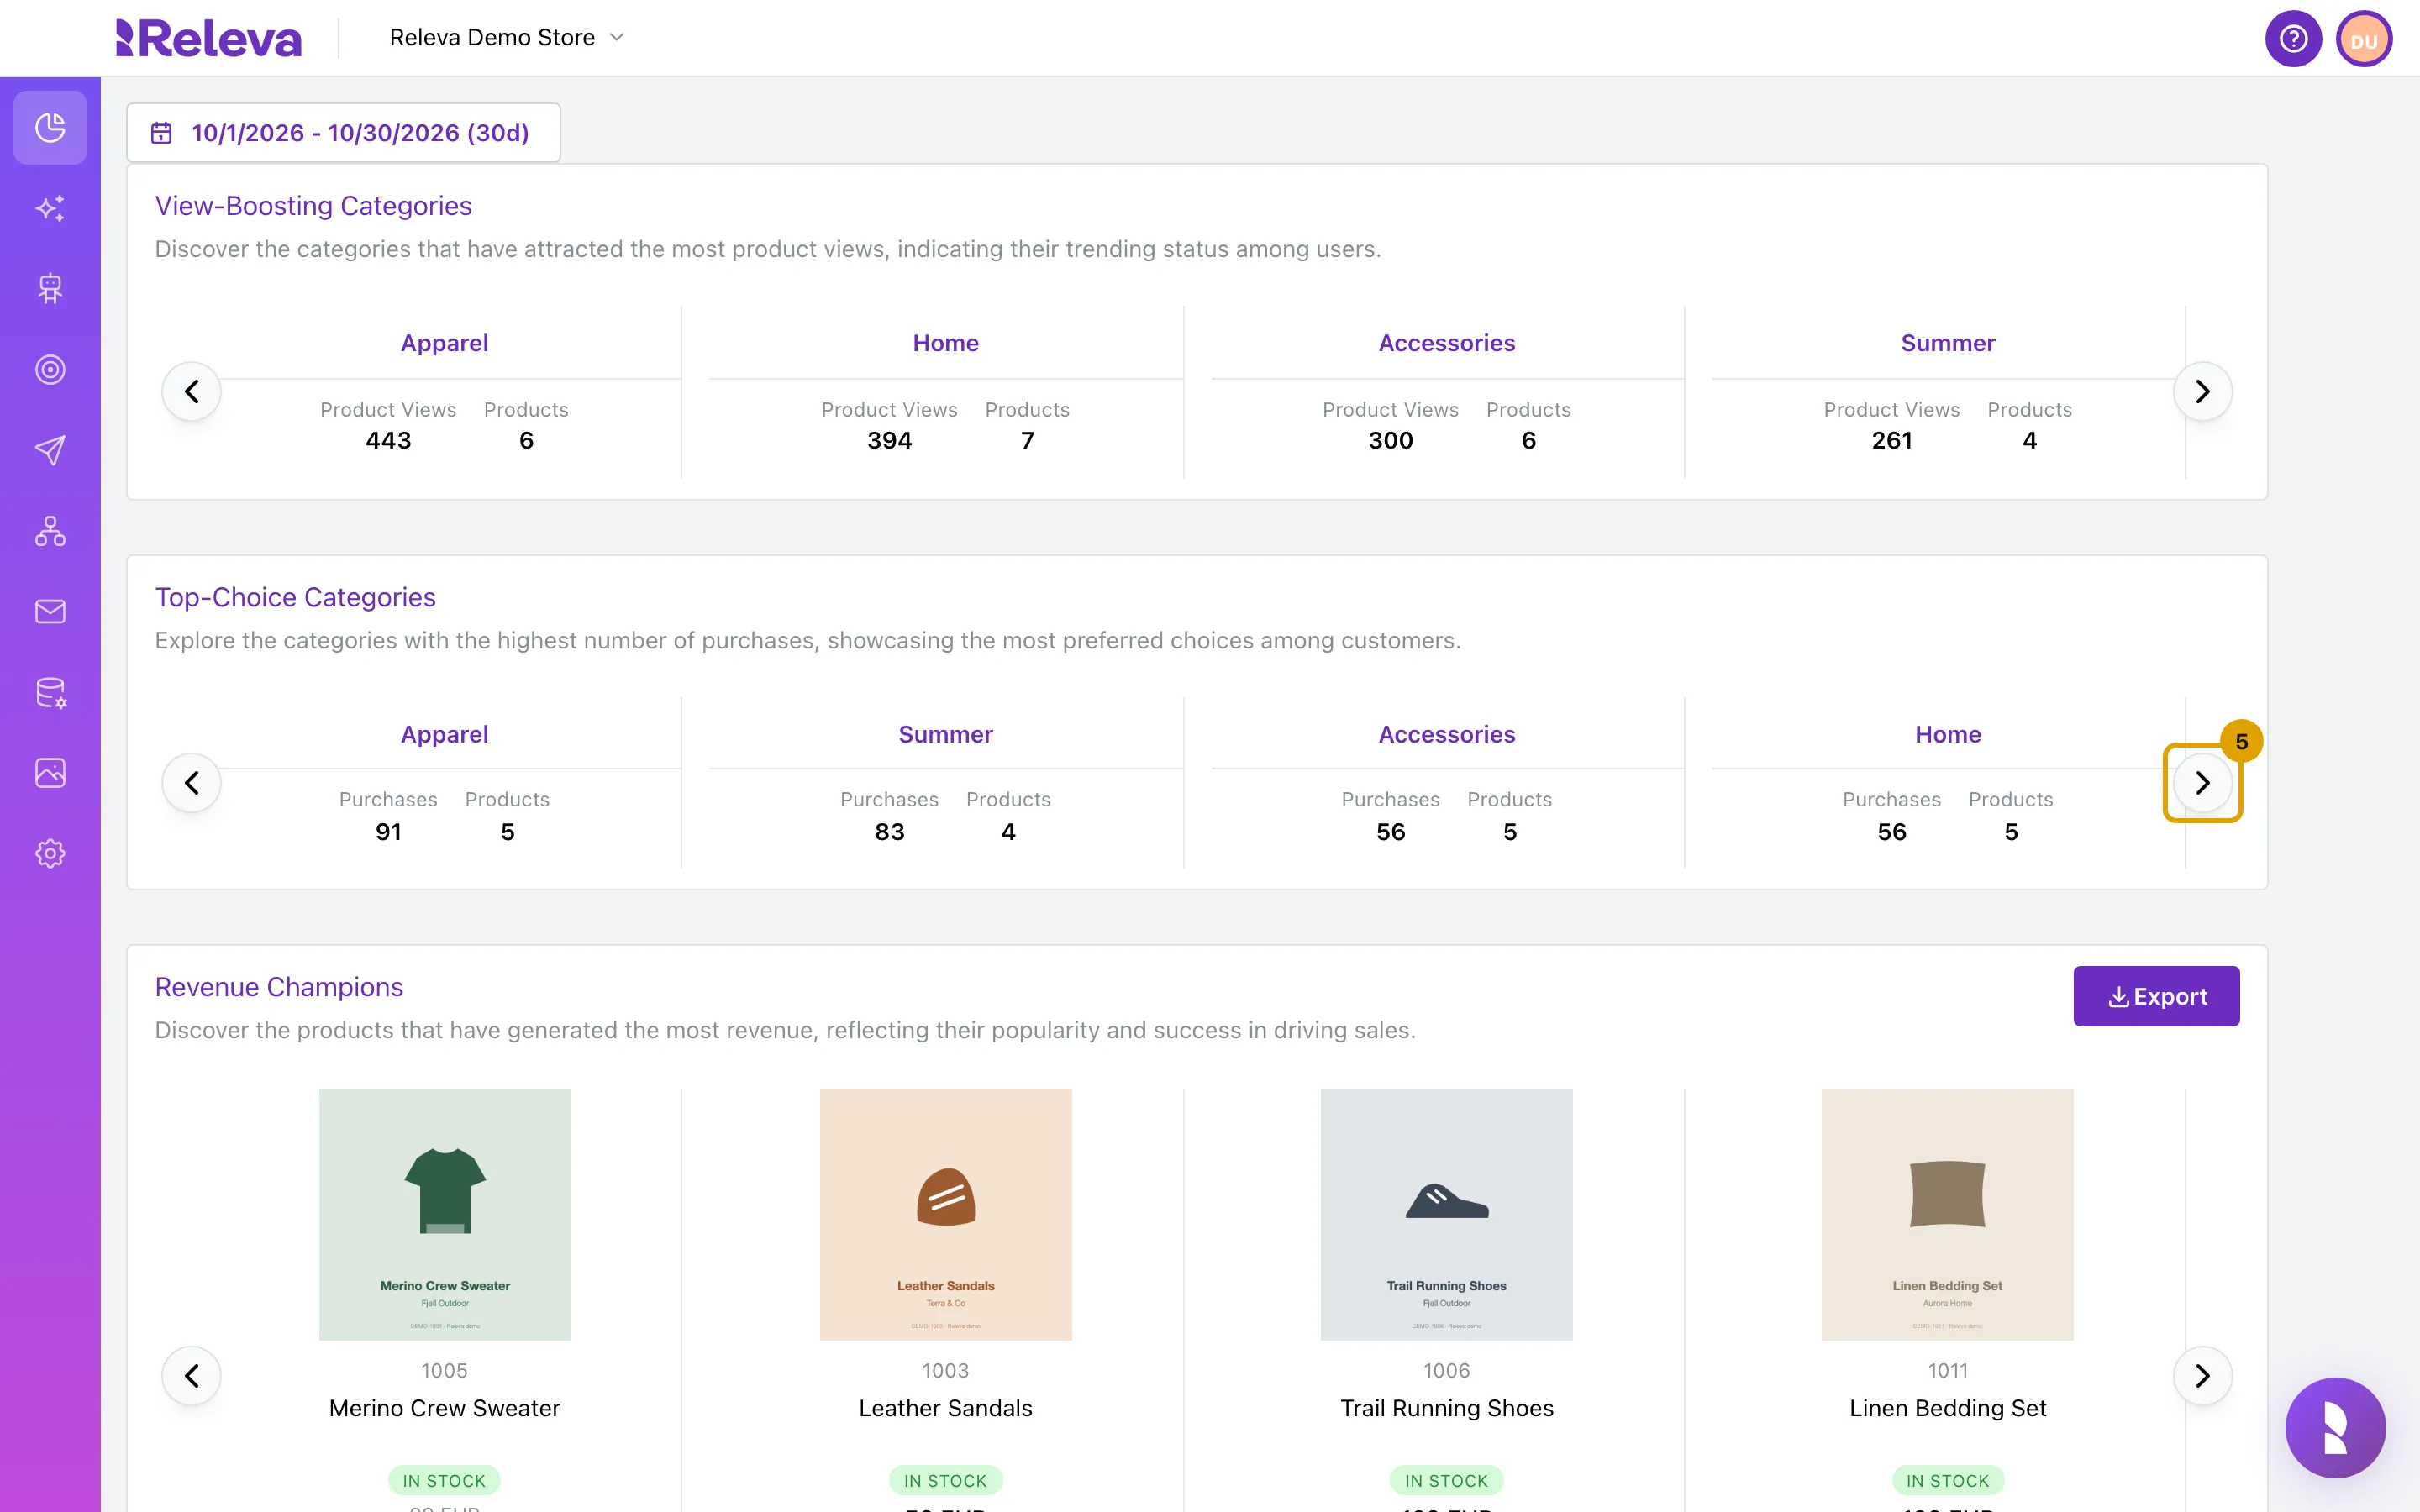
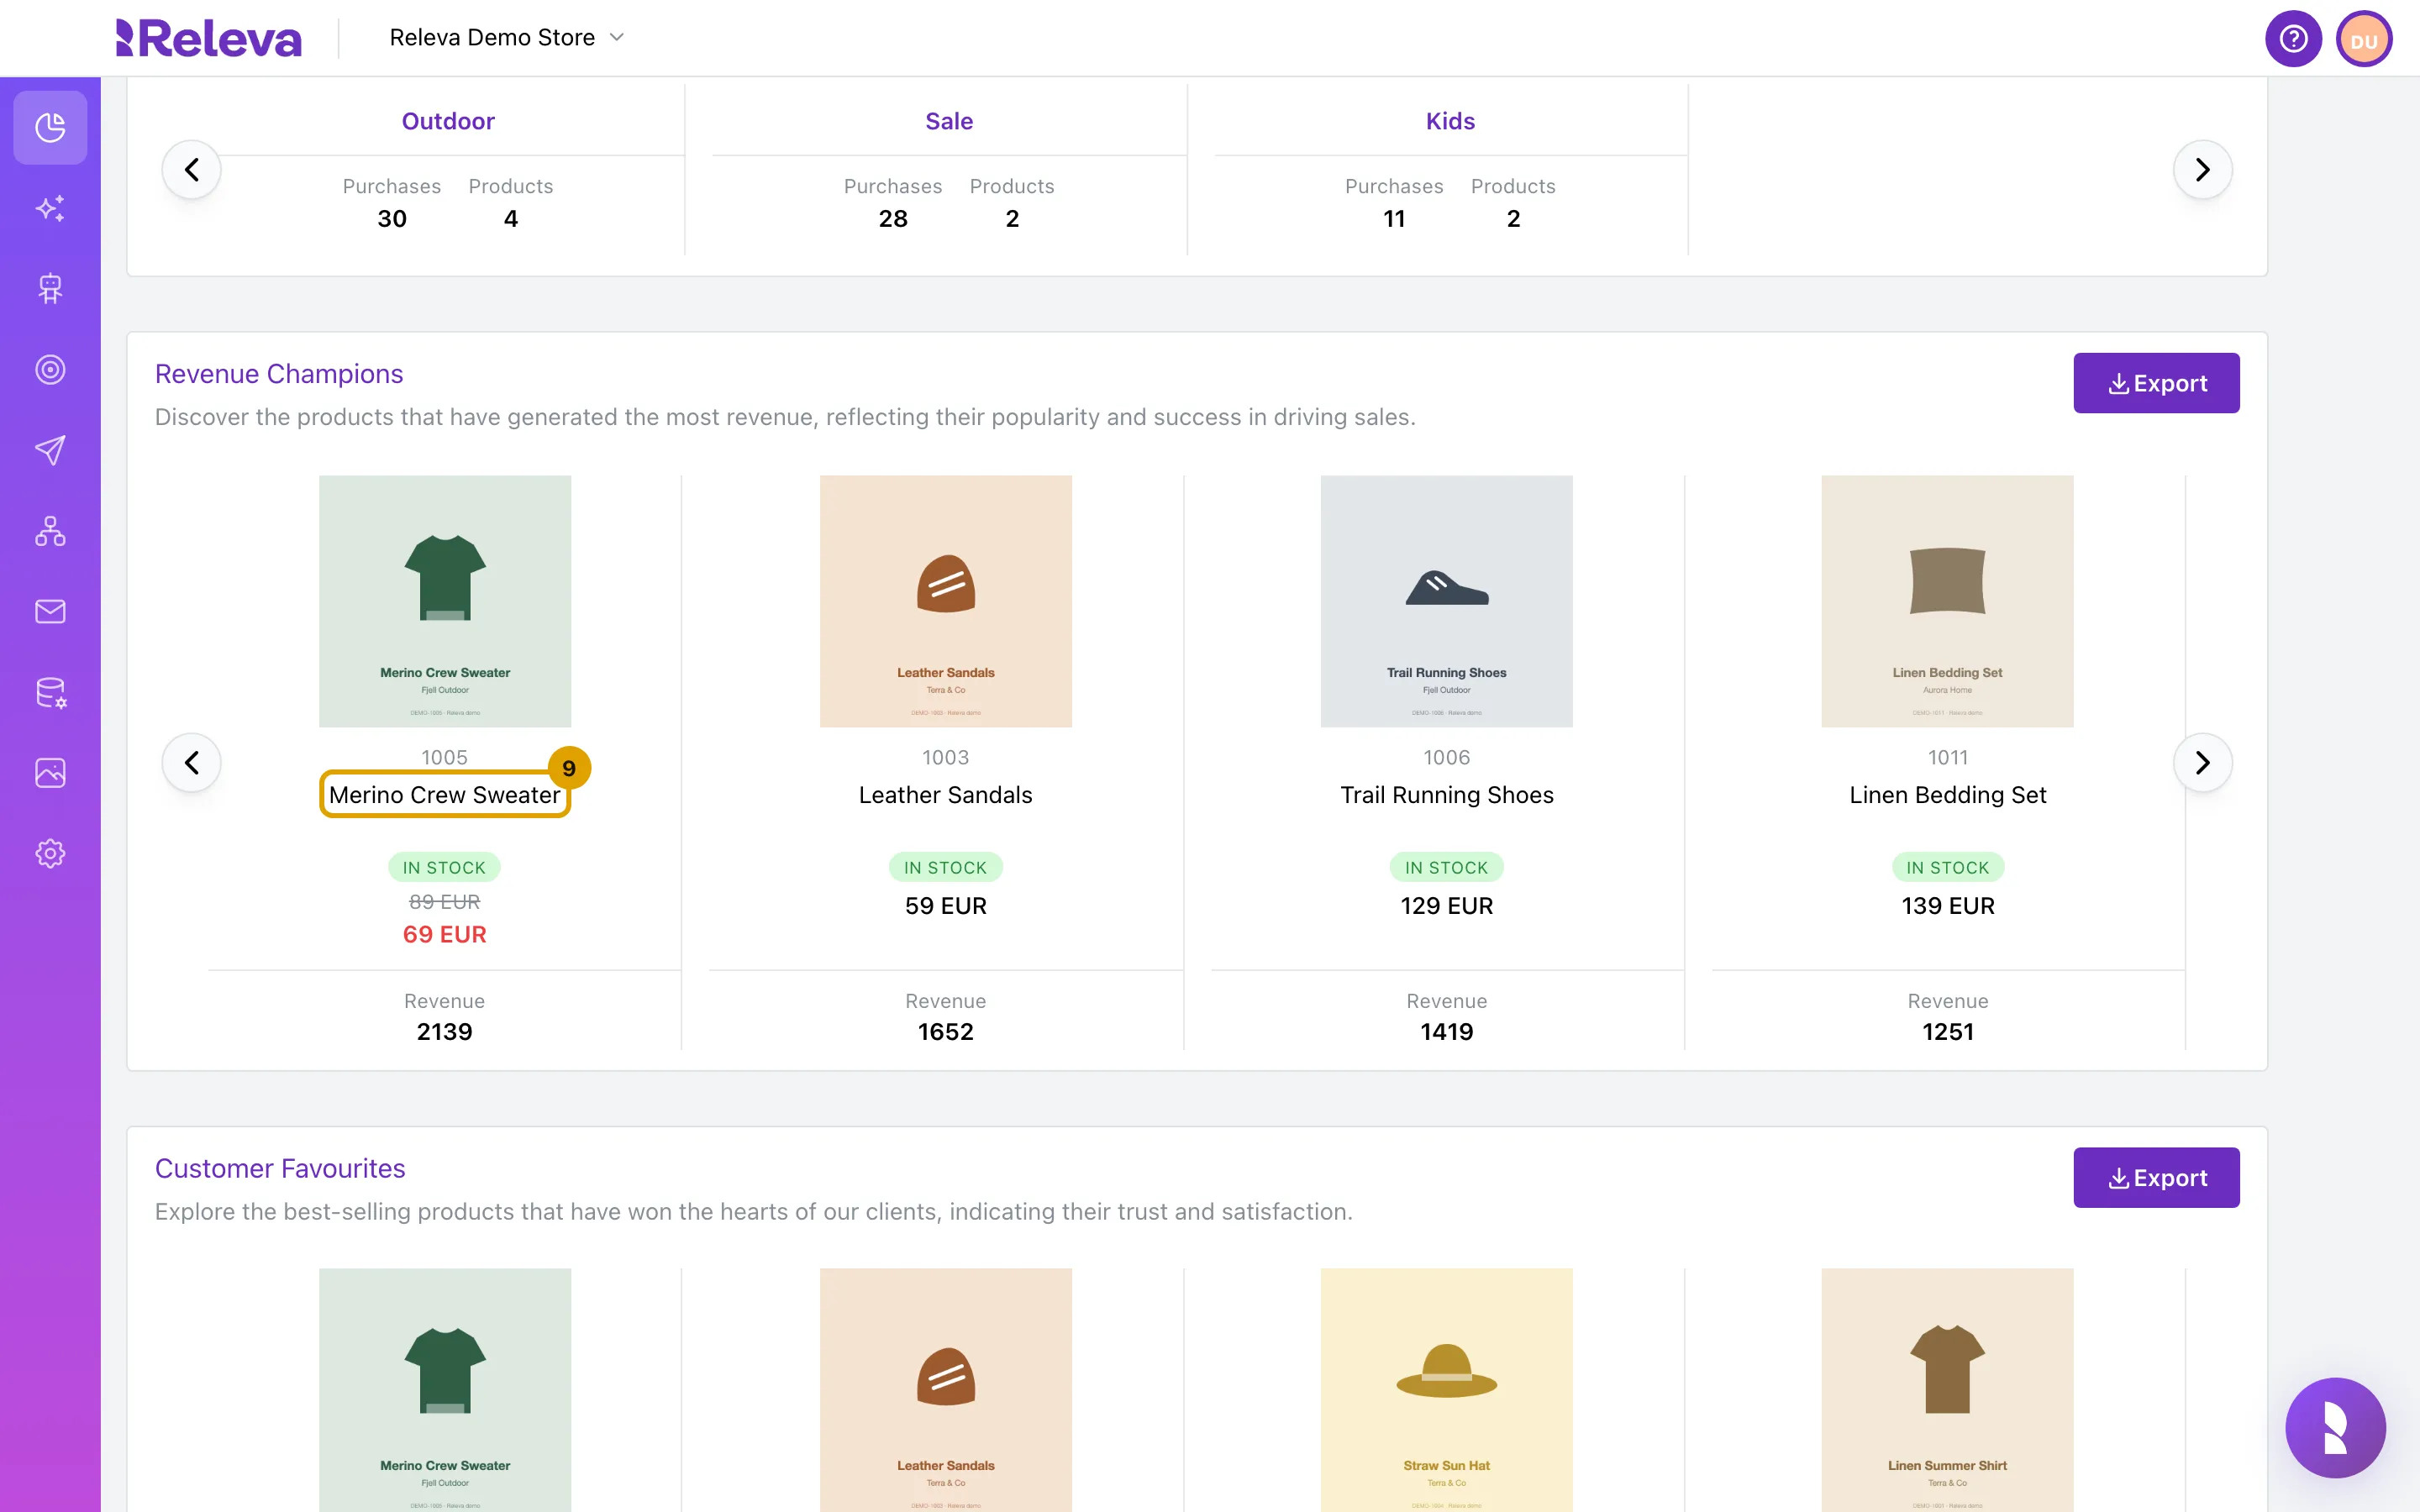
View-Boosting Categories ranks your categories by product views. Products is the number of different products viewed in each category
Category names appear exactly as your catalog sends them, for example Apparel or Men/Shirts.
-
Top-Choice Categories ranks them by purchases. Select the arrow to see more categories
Each card holds up to 12 entries, four per slide. The arrows only appear when there are more than four, and the last slide loops back to the first.
-
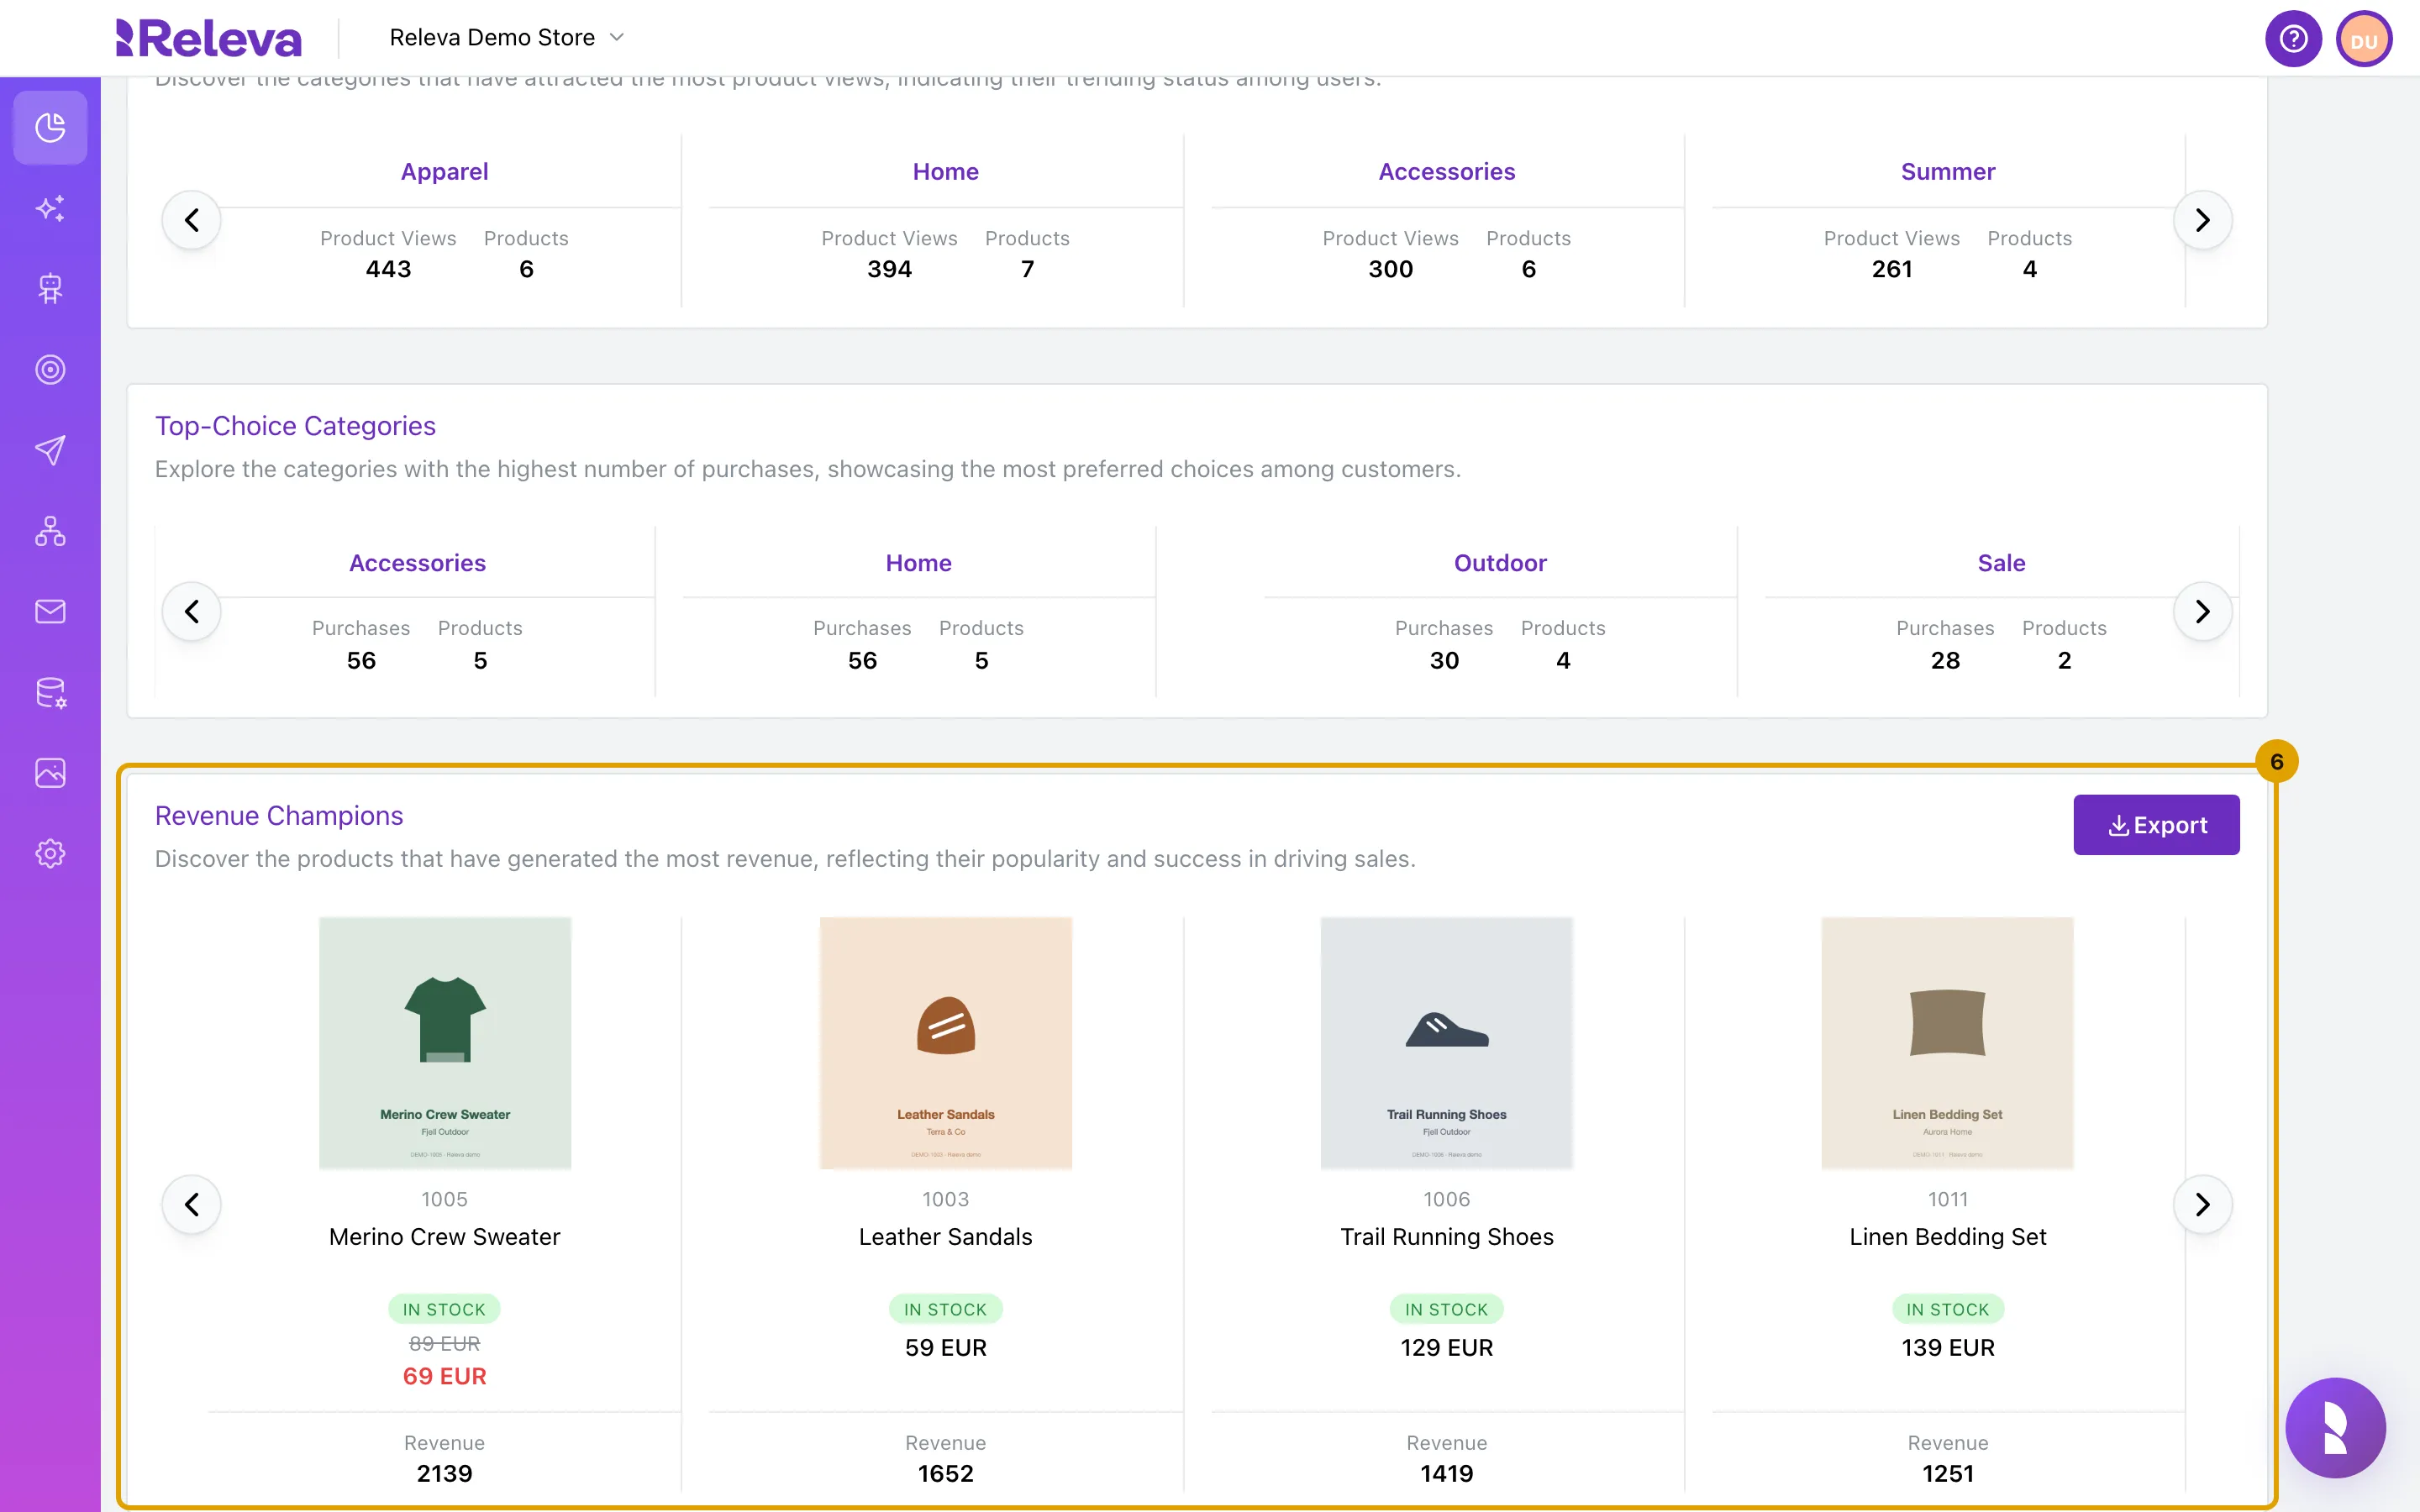
The product trends, such as Revenue Champions, show each product’s ID, name, stock status, price and the figure the trend ranks by
The In stock / Out of stock badge and the price are the product’s current catalog values, not the values at the time of the events. A product on sale shows its list price struck through and the discount price in red. Revenue is in your shop’s currency, shown without the currency code.
-
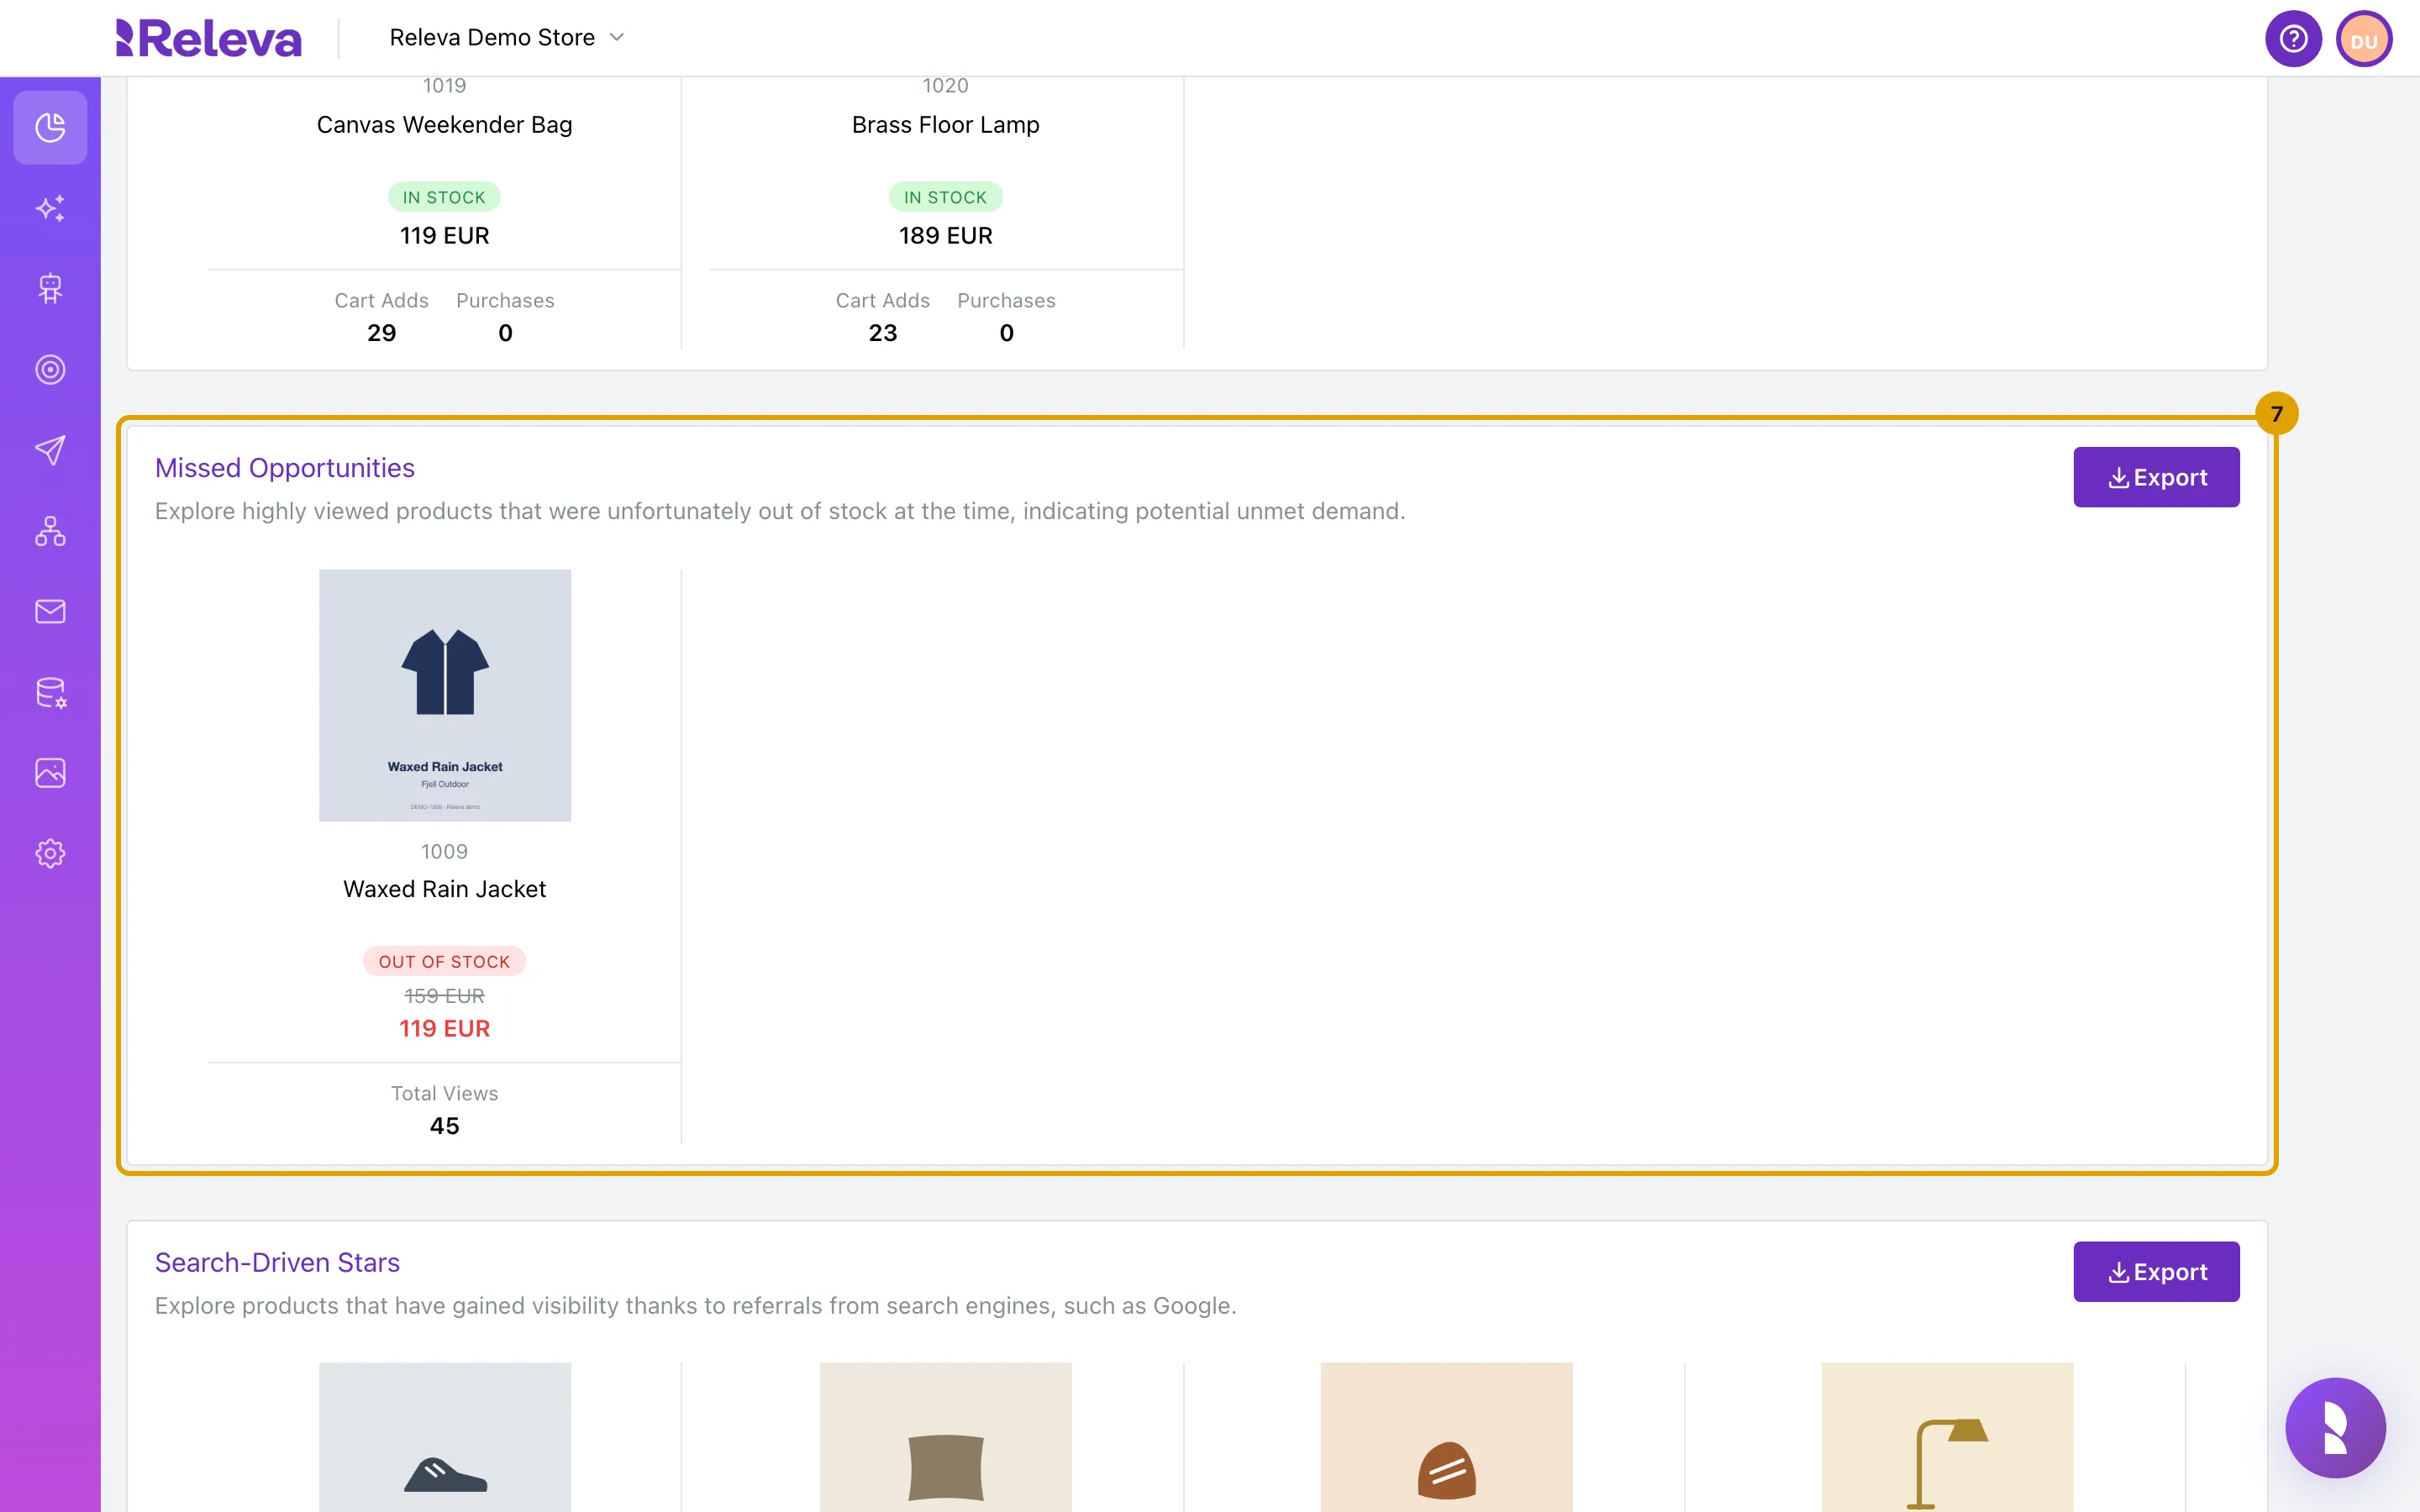
Missed Opportunities lists products that shoppers viewed while they were out of stock
-
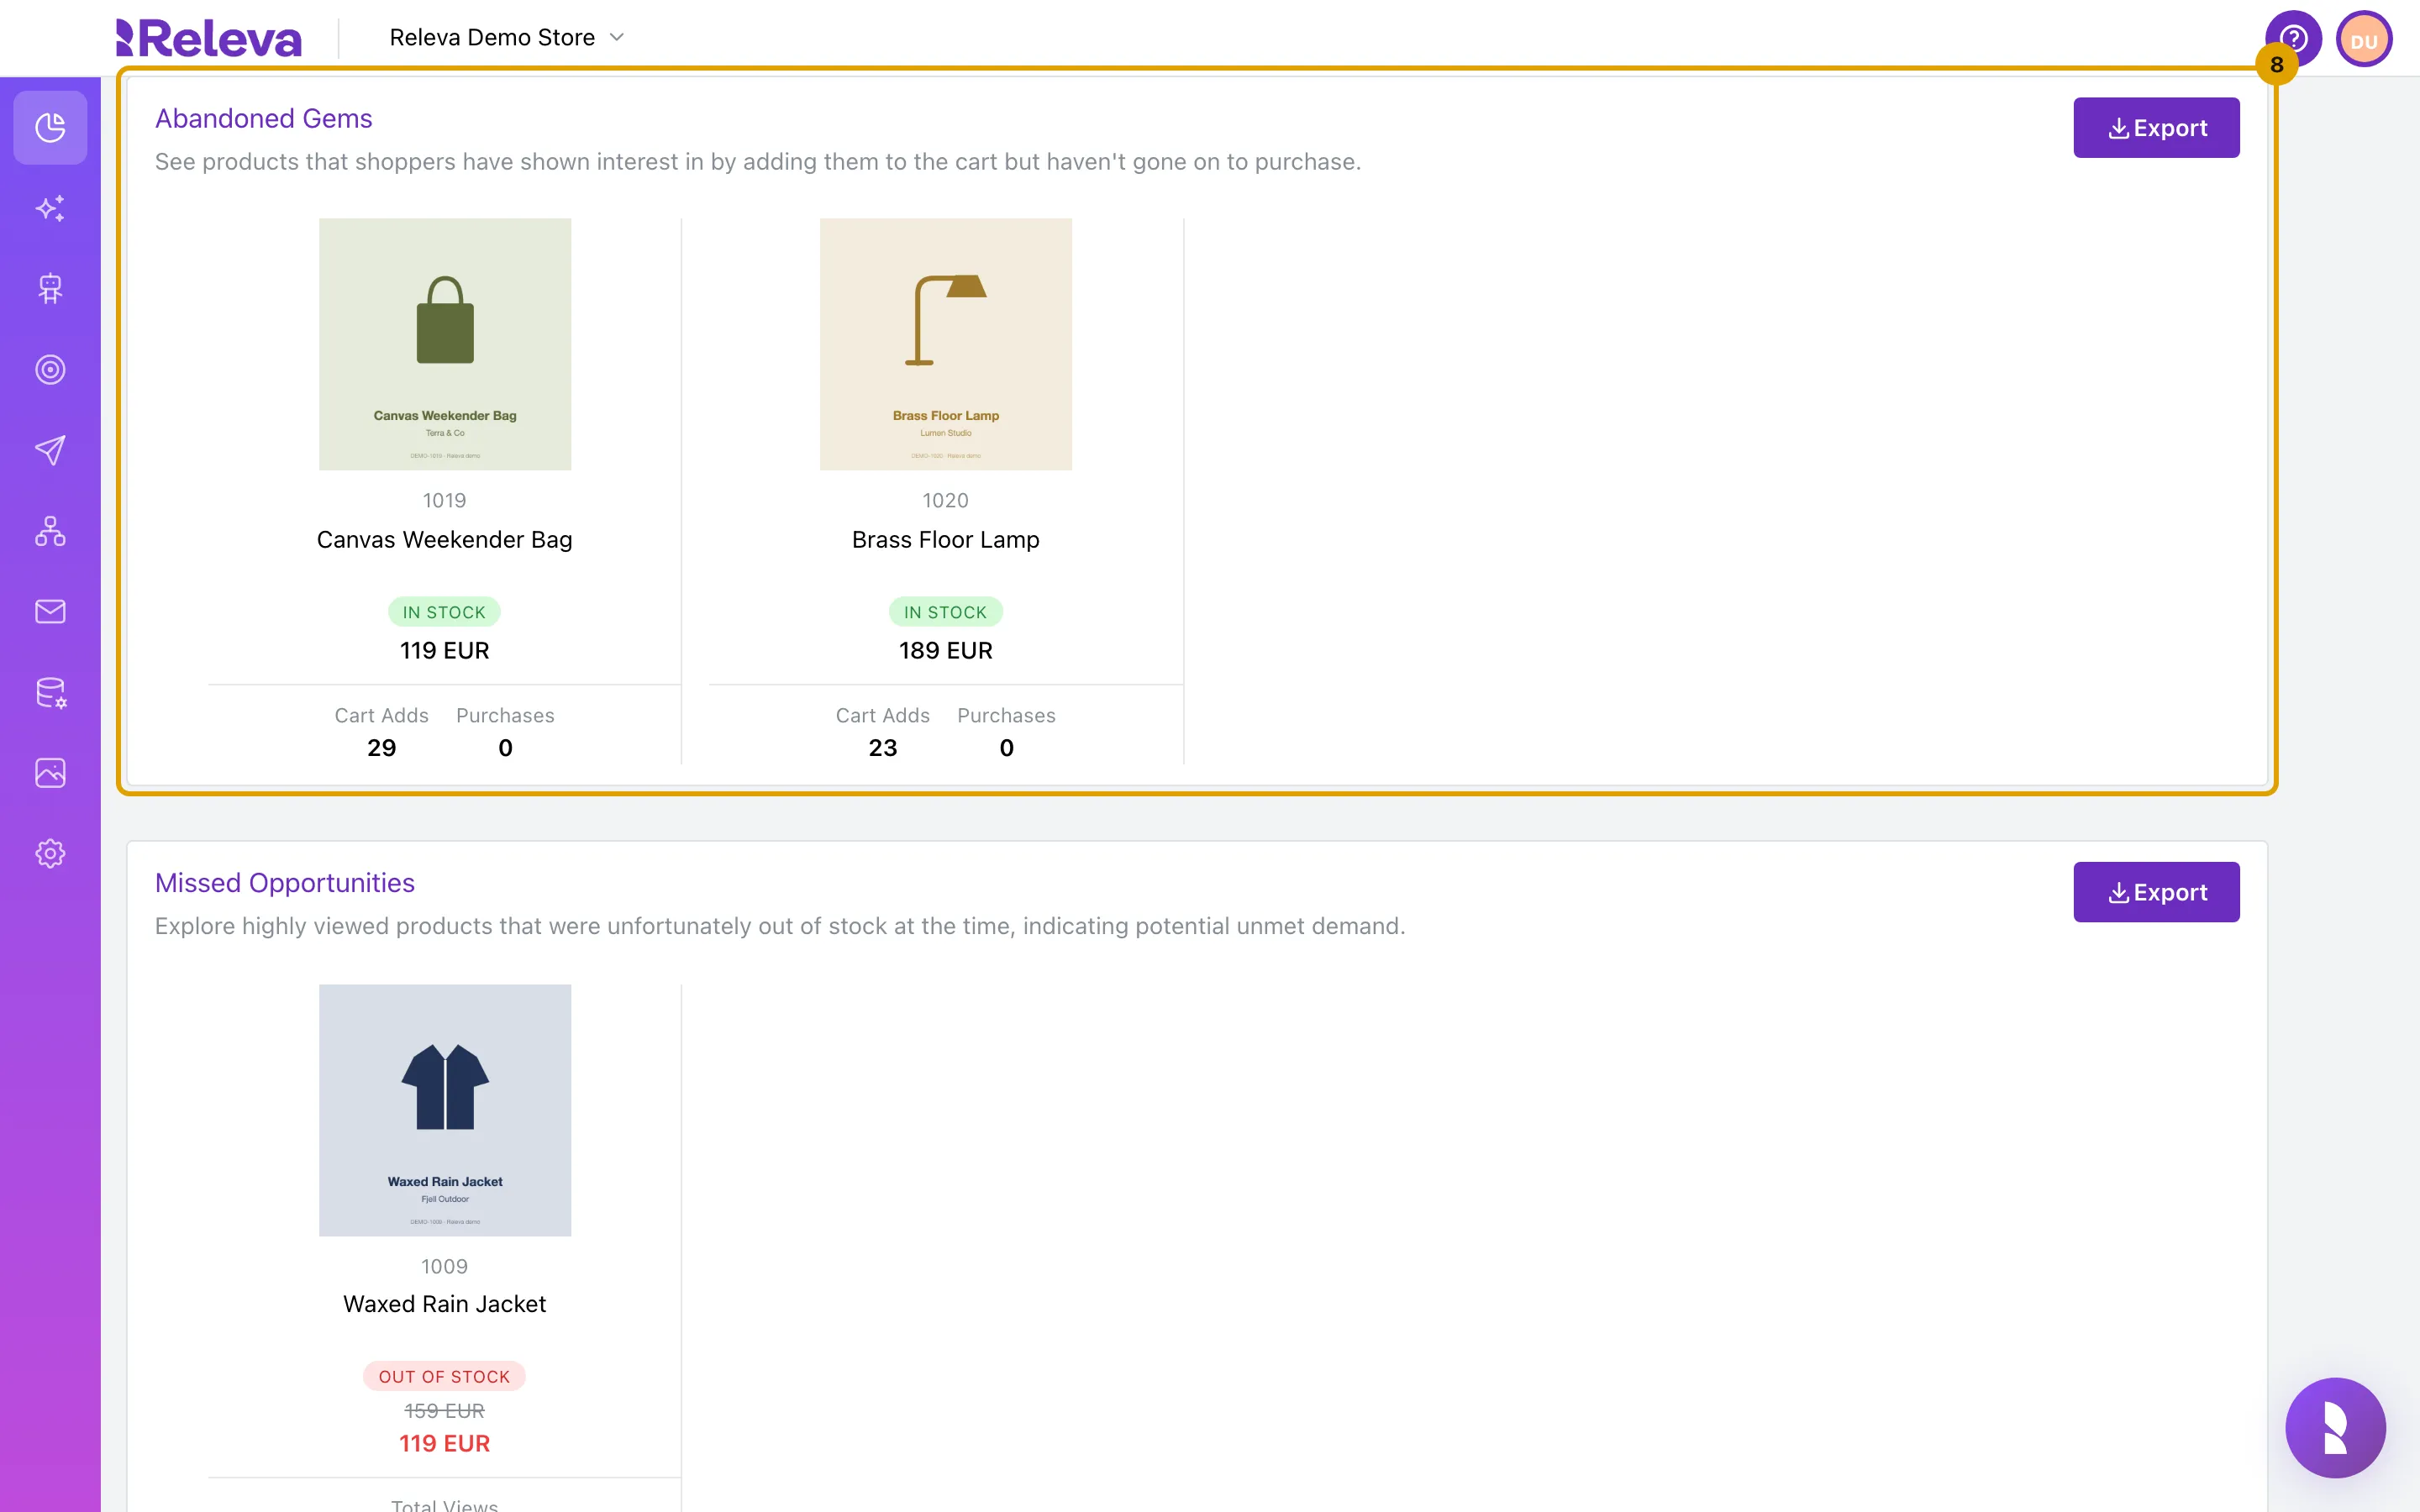
Abandoned Gems lists products that shoppers added to their cart but did not buy in the period
Under each product you see its Cart Adds and Purchases, which is always 0 here.
-
Select a product name to open the product’s details
You land on the product in Data Platform › Products. See View product details.
Check it worked
Section titled “Check it worked”- The period button shows the range you picked, for example (30d).
- The cards that match your shop’s activity show products or categories with a figure under each one: Product Views, Purchases, Revenue, Total Views, Cart Adds, Search Engine Clicks or Social Media Clicks.
Troubleshooting
Section titled “Troubleshooting”Every card says there are no results. A card with no matching products in the period shows There are no results for this product trend currently., and its Export button is disabled. When every card shows it, the shop sent no product views, cart additions or purchases in the period, or the period is too short. The last day of the range is not counted (see below), so a one-day range is always empty. Pick a longer or more recent period, then check that events arrive with Check that an event reached Releva.
Today’s events are missing. The end day of the period is excluded: a range ending today counts events up to midnight at the start of today. 14d therefore covers the 13 full days before today. Compare periods over the same number of days and expect today to show up tomorrow.
The numbers changed after I came back to the page. The period is not saved. Leaving the page and returning resets it to the last 14 days.
Window Shopper’s Standouts, Unpopular Picks and Abandoned Gems are empty although the other cards have data. These three only list products that were viewed or added to a cart and not bought (or not added to a cart) in the period. In a shop where every product that is added to a cart also sells, Abandoned Gems stays empty; that is normal.
Search-Driven Stars and Social Buzz Collection are empty. They only count product views that arrive with a Google or Facebook source (utm_source=google or utm_source=facebook, or clicks on Releva Google Ads and Facebook Ads). Views without a source are not counted.
A product I expect is missing. Products that are no longer in the catalog are left out, even if they had events in the period.
Opening the page logs me out. Your session expired, or the shop in the address is one you have no access to. Log in again and open Product Trends from a shop you have access to.