

Check how the Sales Agent performs
The top of Agentic › Sales Agent shows how much shoppers used the Sales Agent in a period and what it brought in: questions, answers, product clicks, cart adds, purchases, revenue and votes. This guide reads those figures, changes the period and finds the same revenue on the analytics dashboard. To read the conversations behind the figures, see Review Sales Agent conversations.
Before you start
Section titled “Before you start”- Releva has set up the Sales Agent for your shop, and the Chat Bot switch has been on for the period you check. With the widget off, every figure stays at 0.
- Your shop sends cart and purchase events to Releva. Without them, Conversions, Chat-sold items and Chat-sold revenue stay at 0 even when shoppers buy. See How events get into Releva.
- Anyone with access to the shop can read the figures. Nothing on this page changes your settings.
-
Go to Agentic › Sales Agent.
The figures at the top cover the last 30 days, today included.
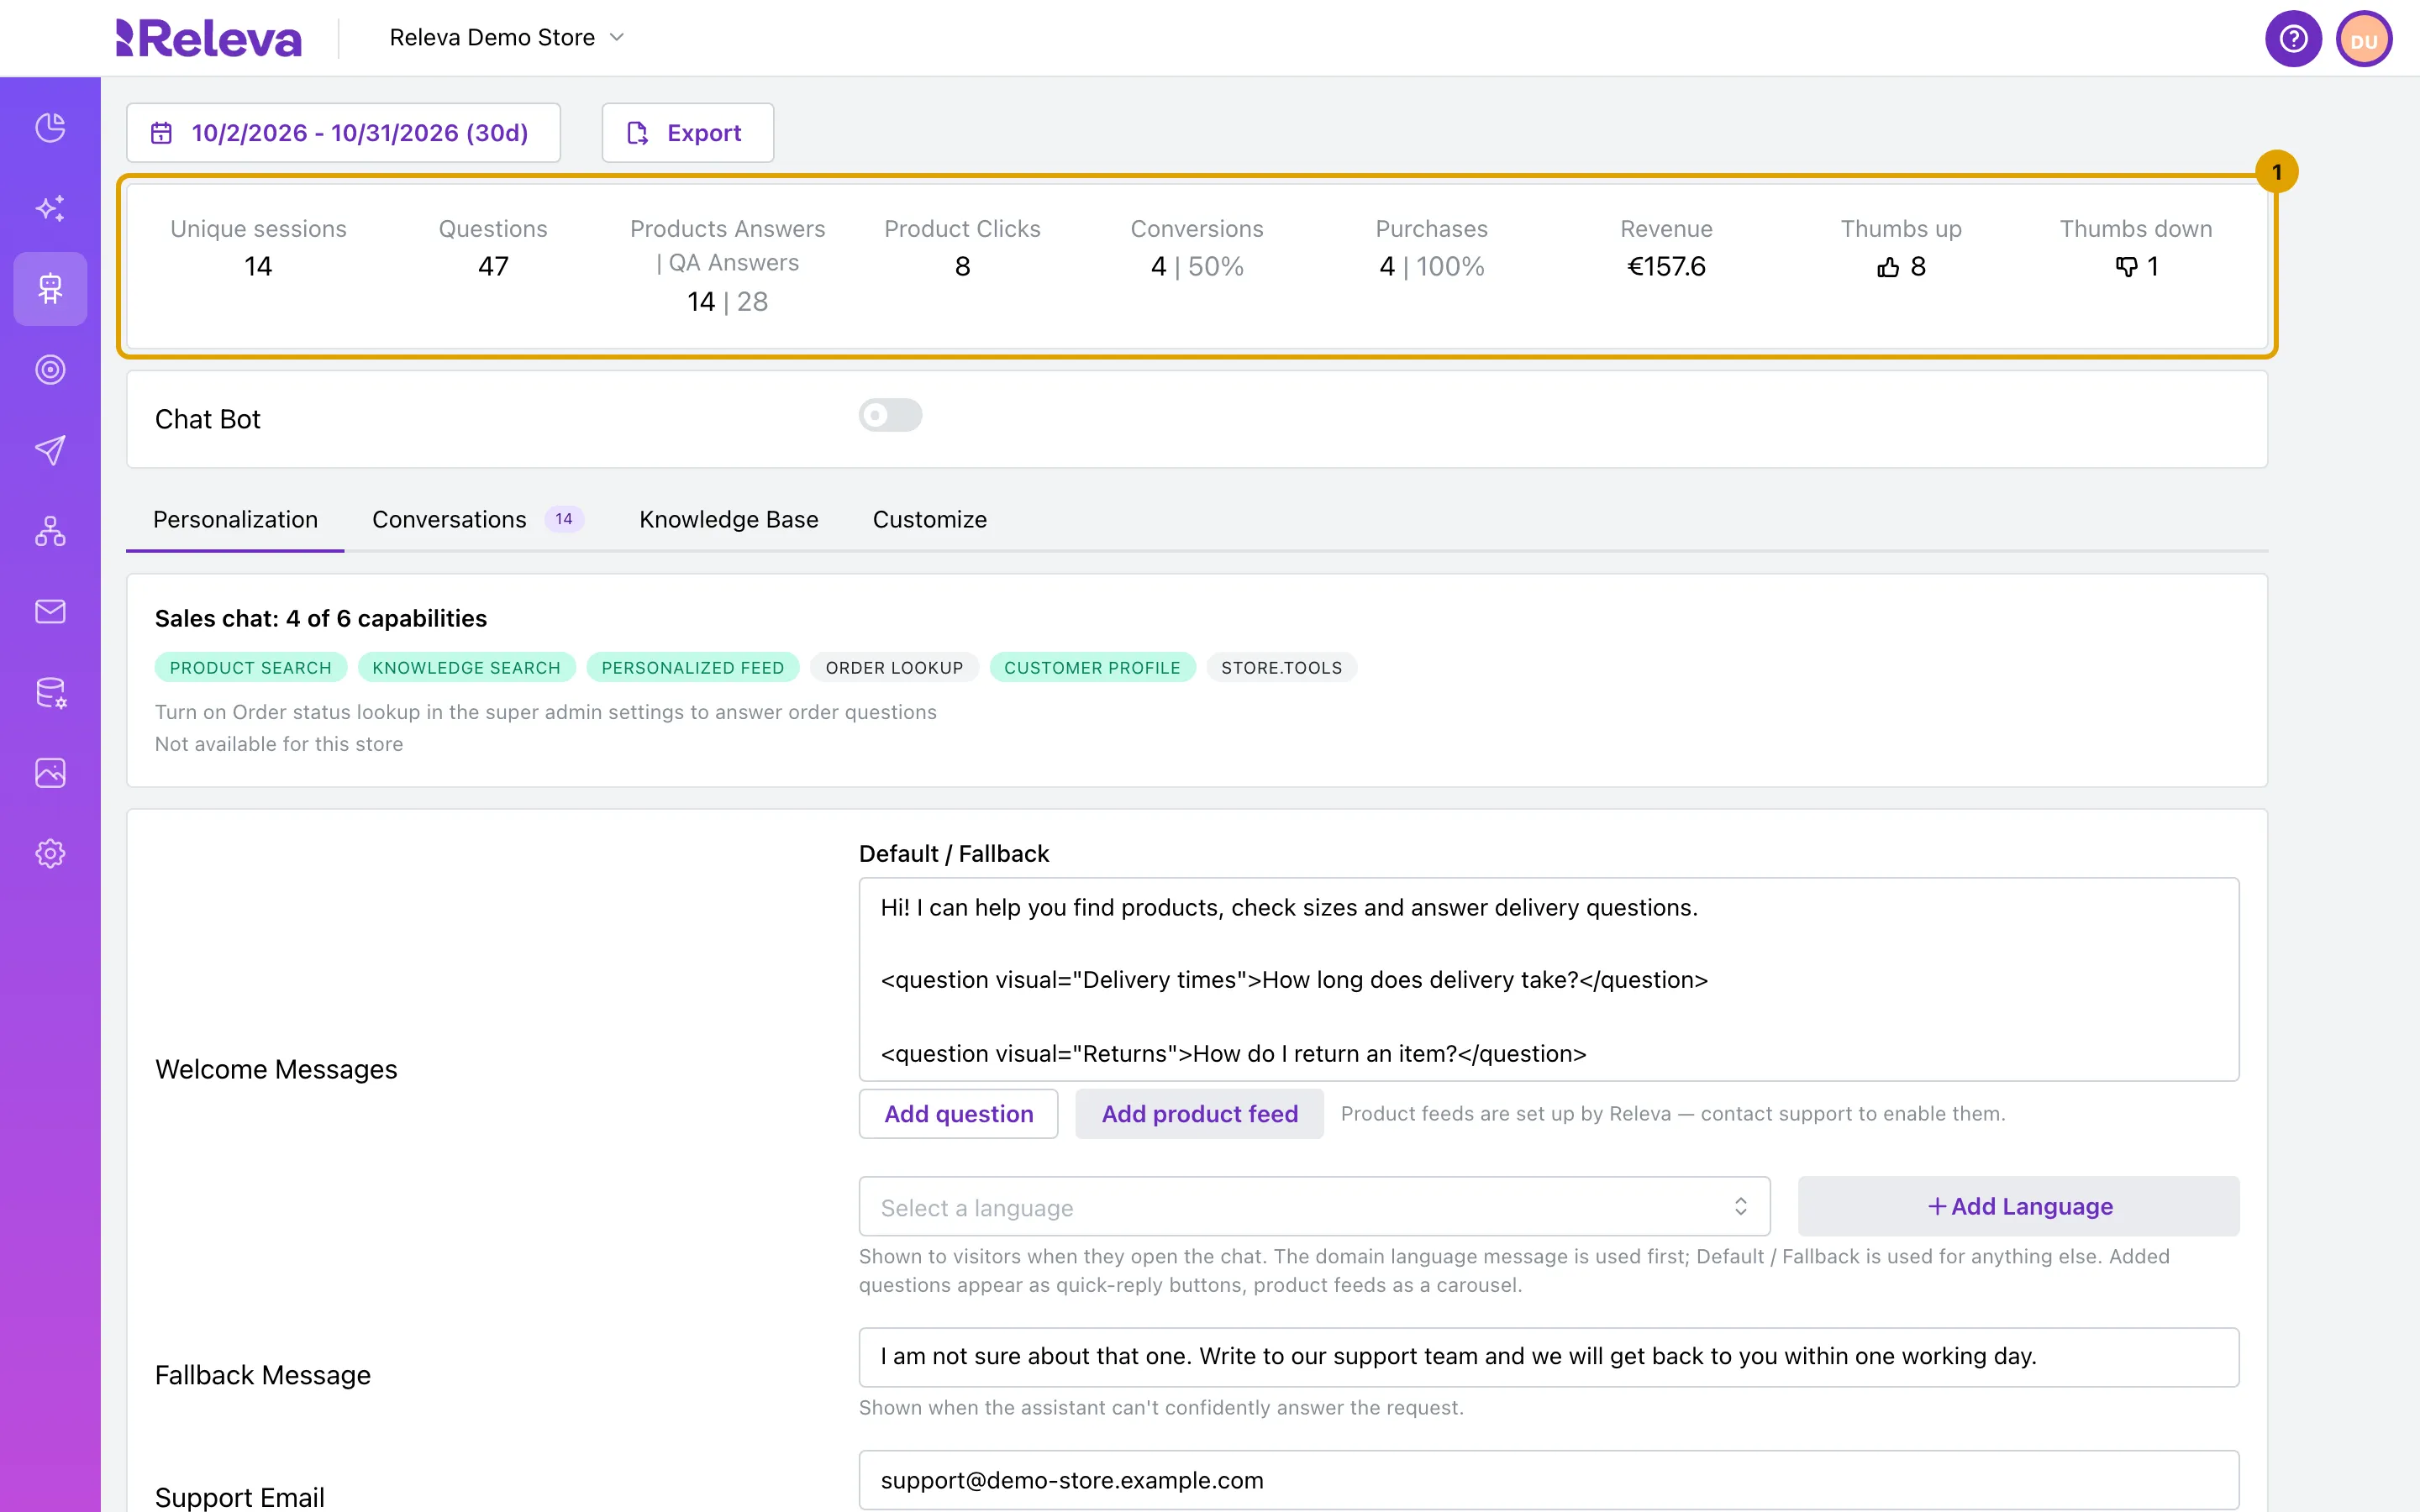
Figure What it counts in the period Unique sessions Conversations shoppers had with the Sales Agent. The badge on the Conversations tab shows the same number. Questions Messages shoppers sent. Products Answers | QA Answers Answers that showed products, then answers that came from your knowledge (Q&A). Product Clicks Clicks on products the Sales Agent showed in the chat. Conversions Cart adds of products shoppers found through the Sales Agent, and the share of product clicks that led to one. Chat-sold items Purchases of those products, and the share of conversions that ended in a purchase. Chat-sold revenue The value of those purchases, in your shop’s currency. Thumbs up, Thumbs down Votes shoppers gave the agent’s answers. -
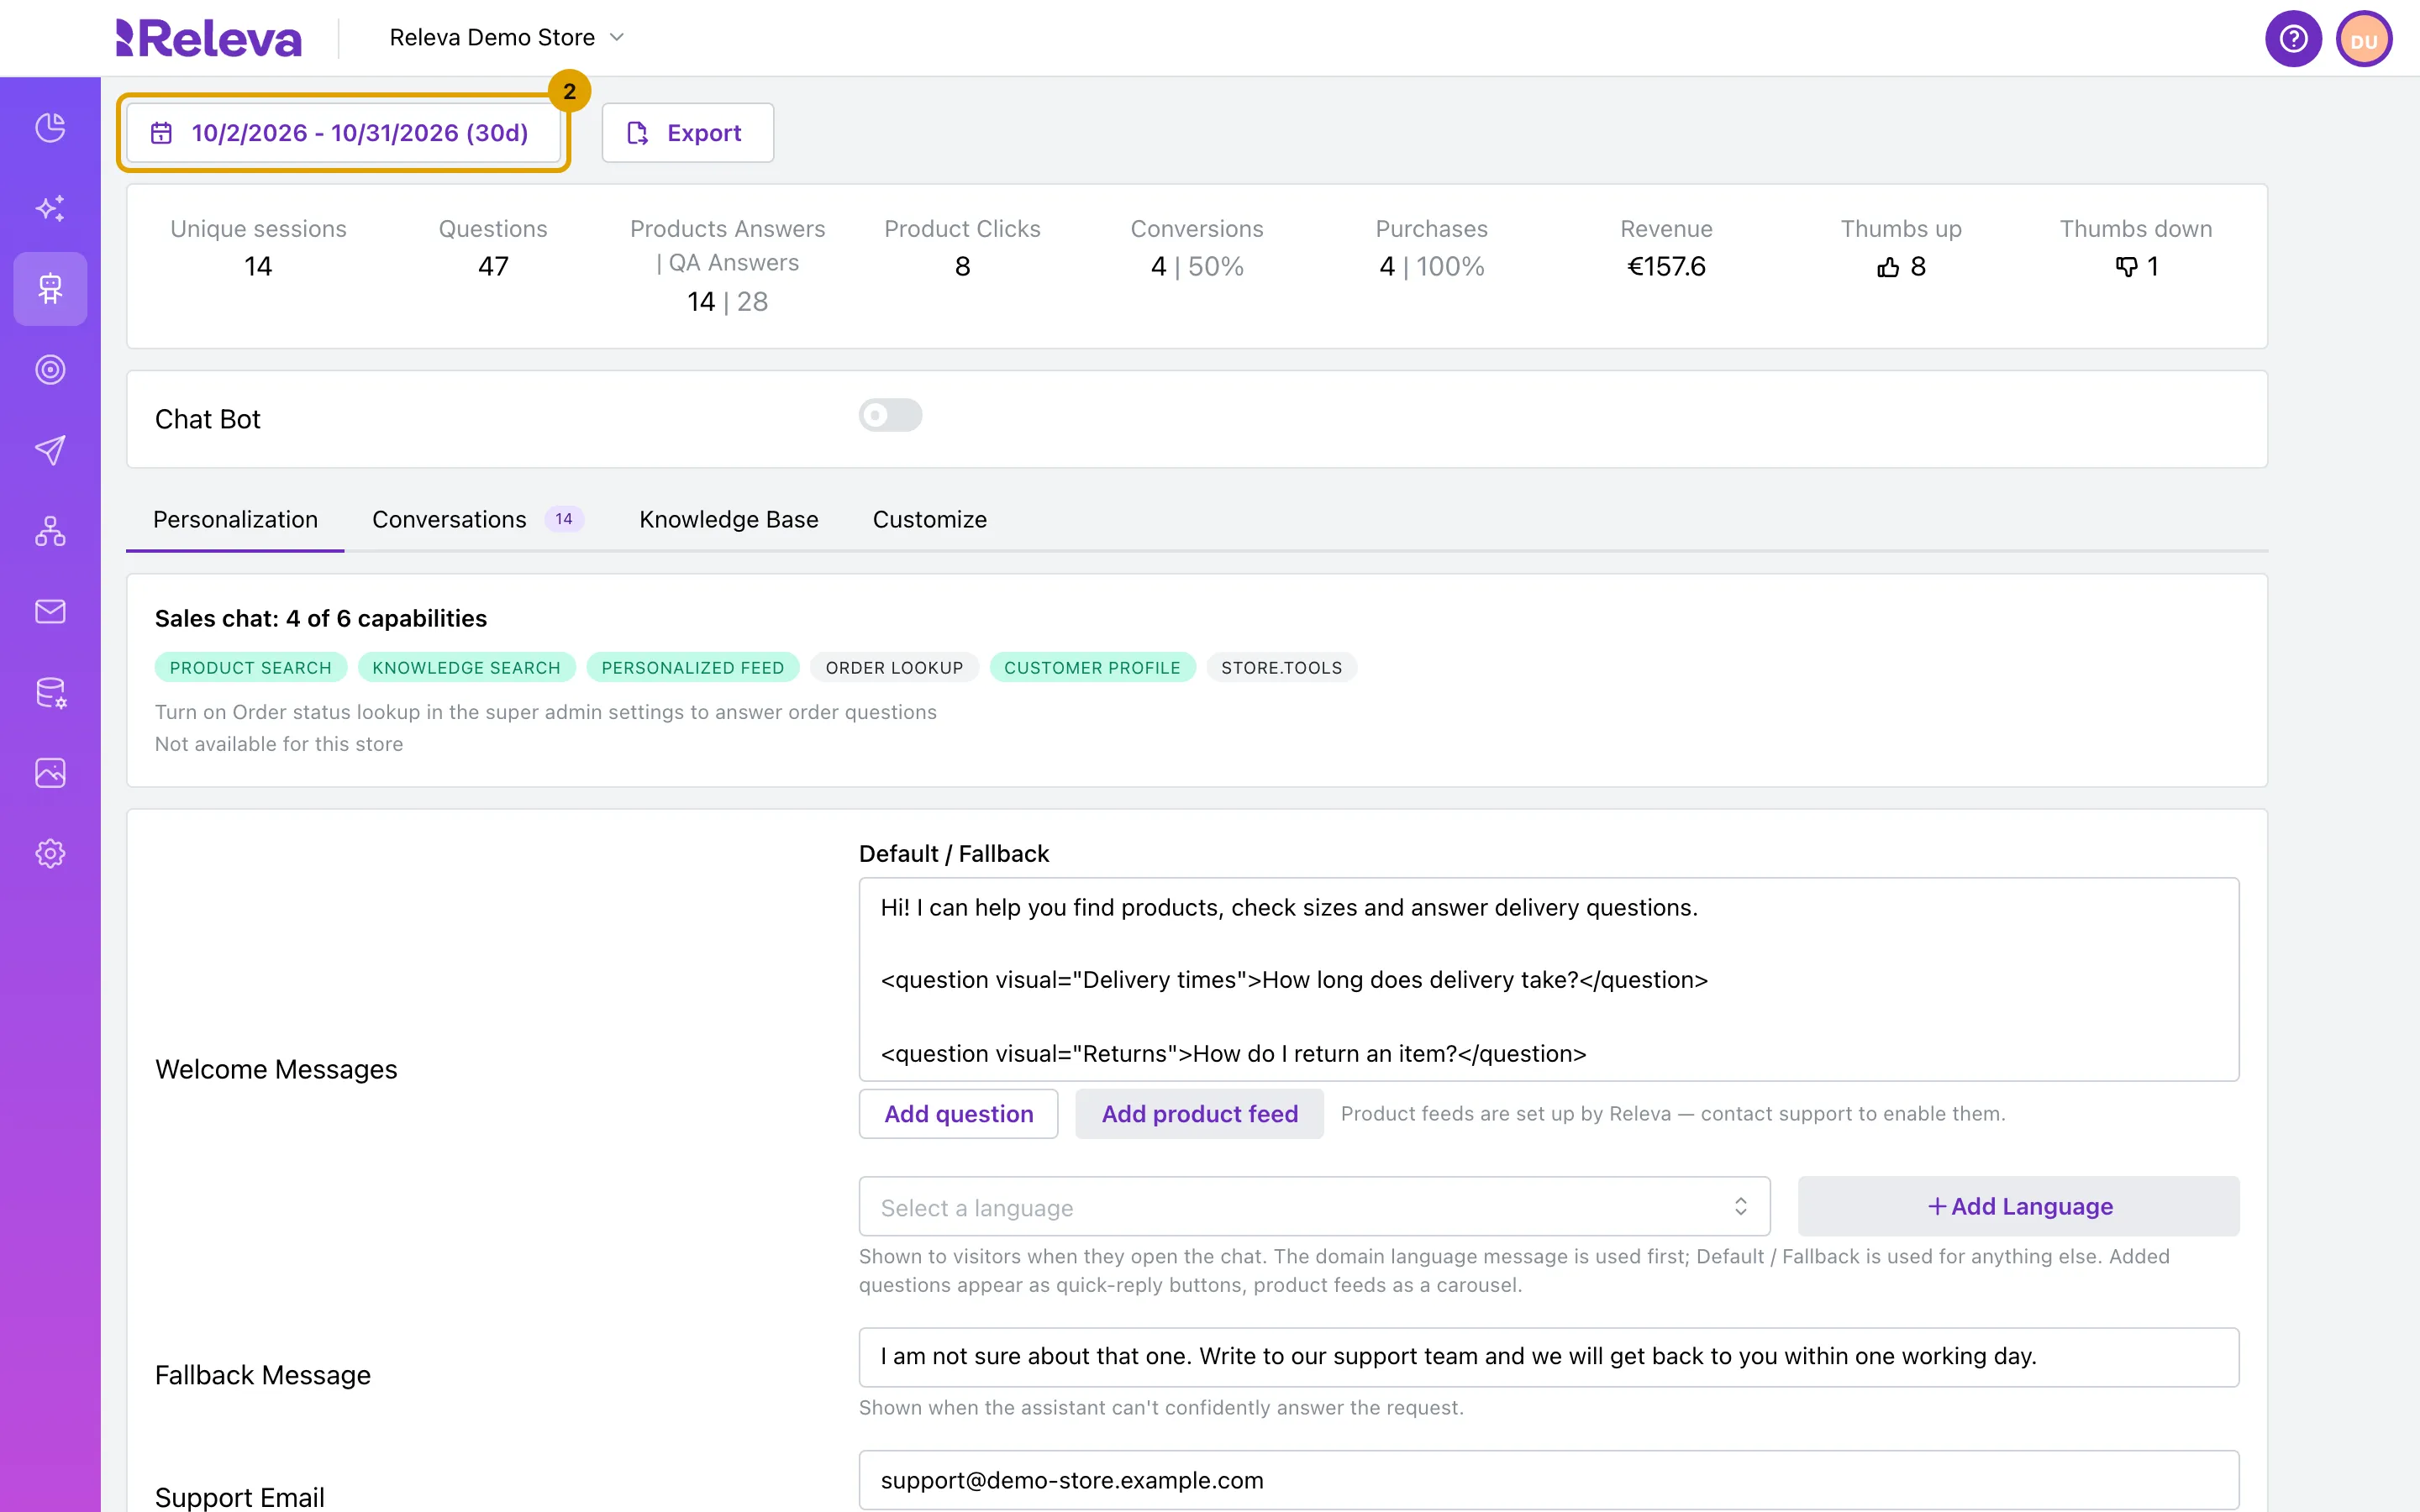
Select the date range above the figures.
-
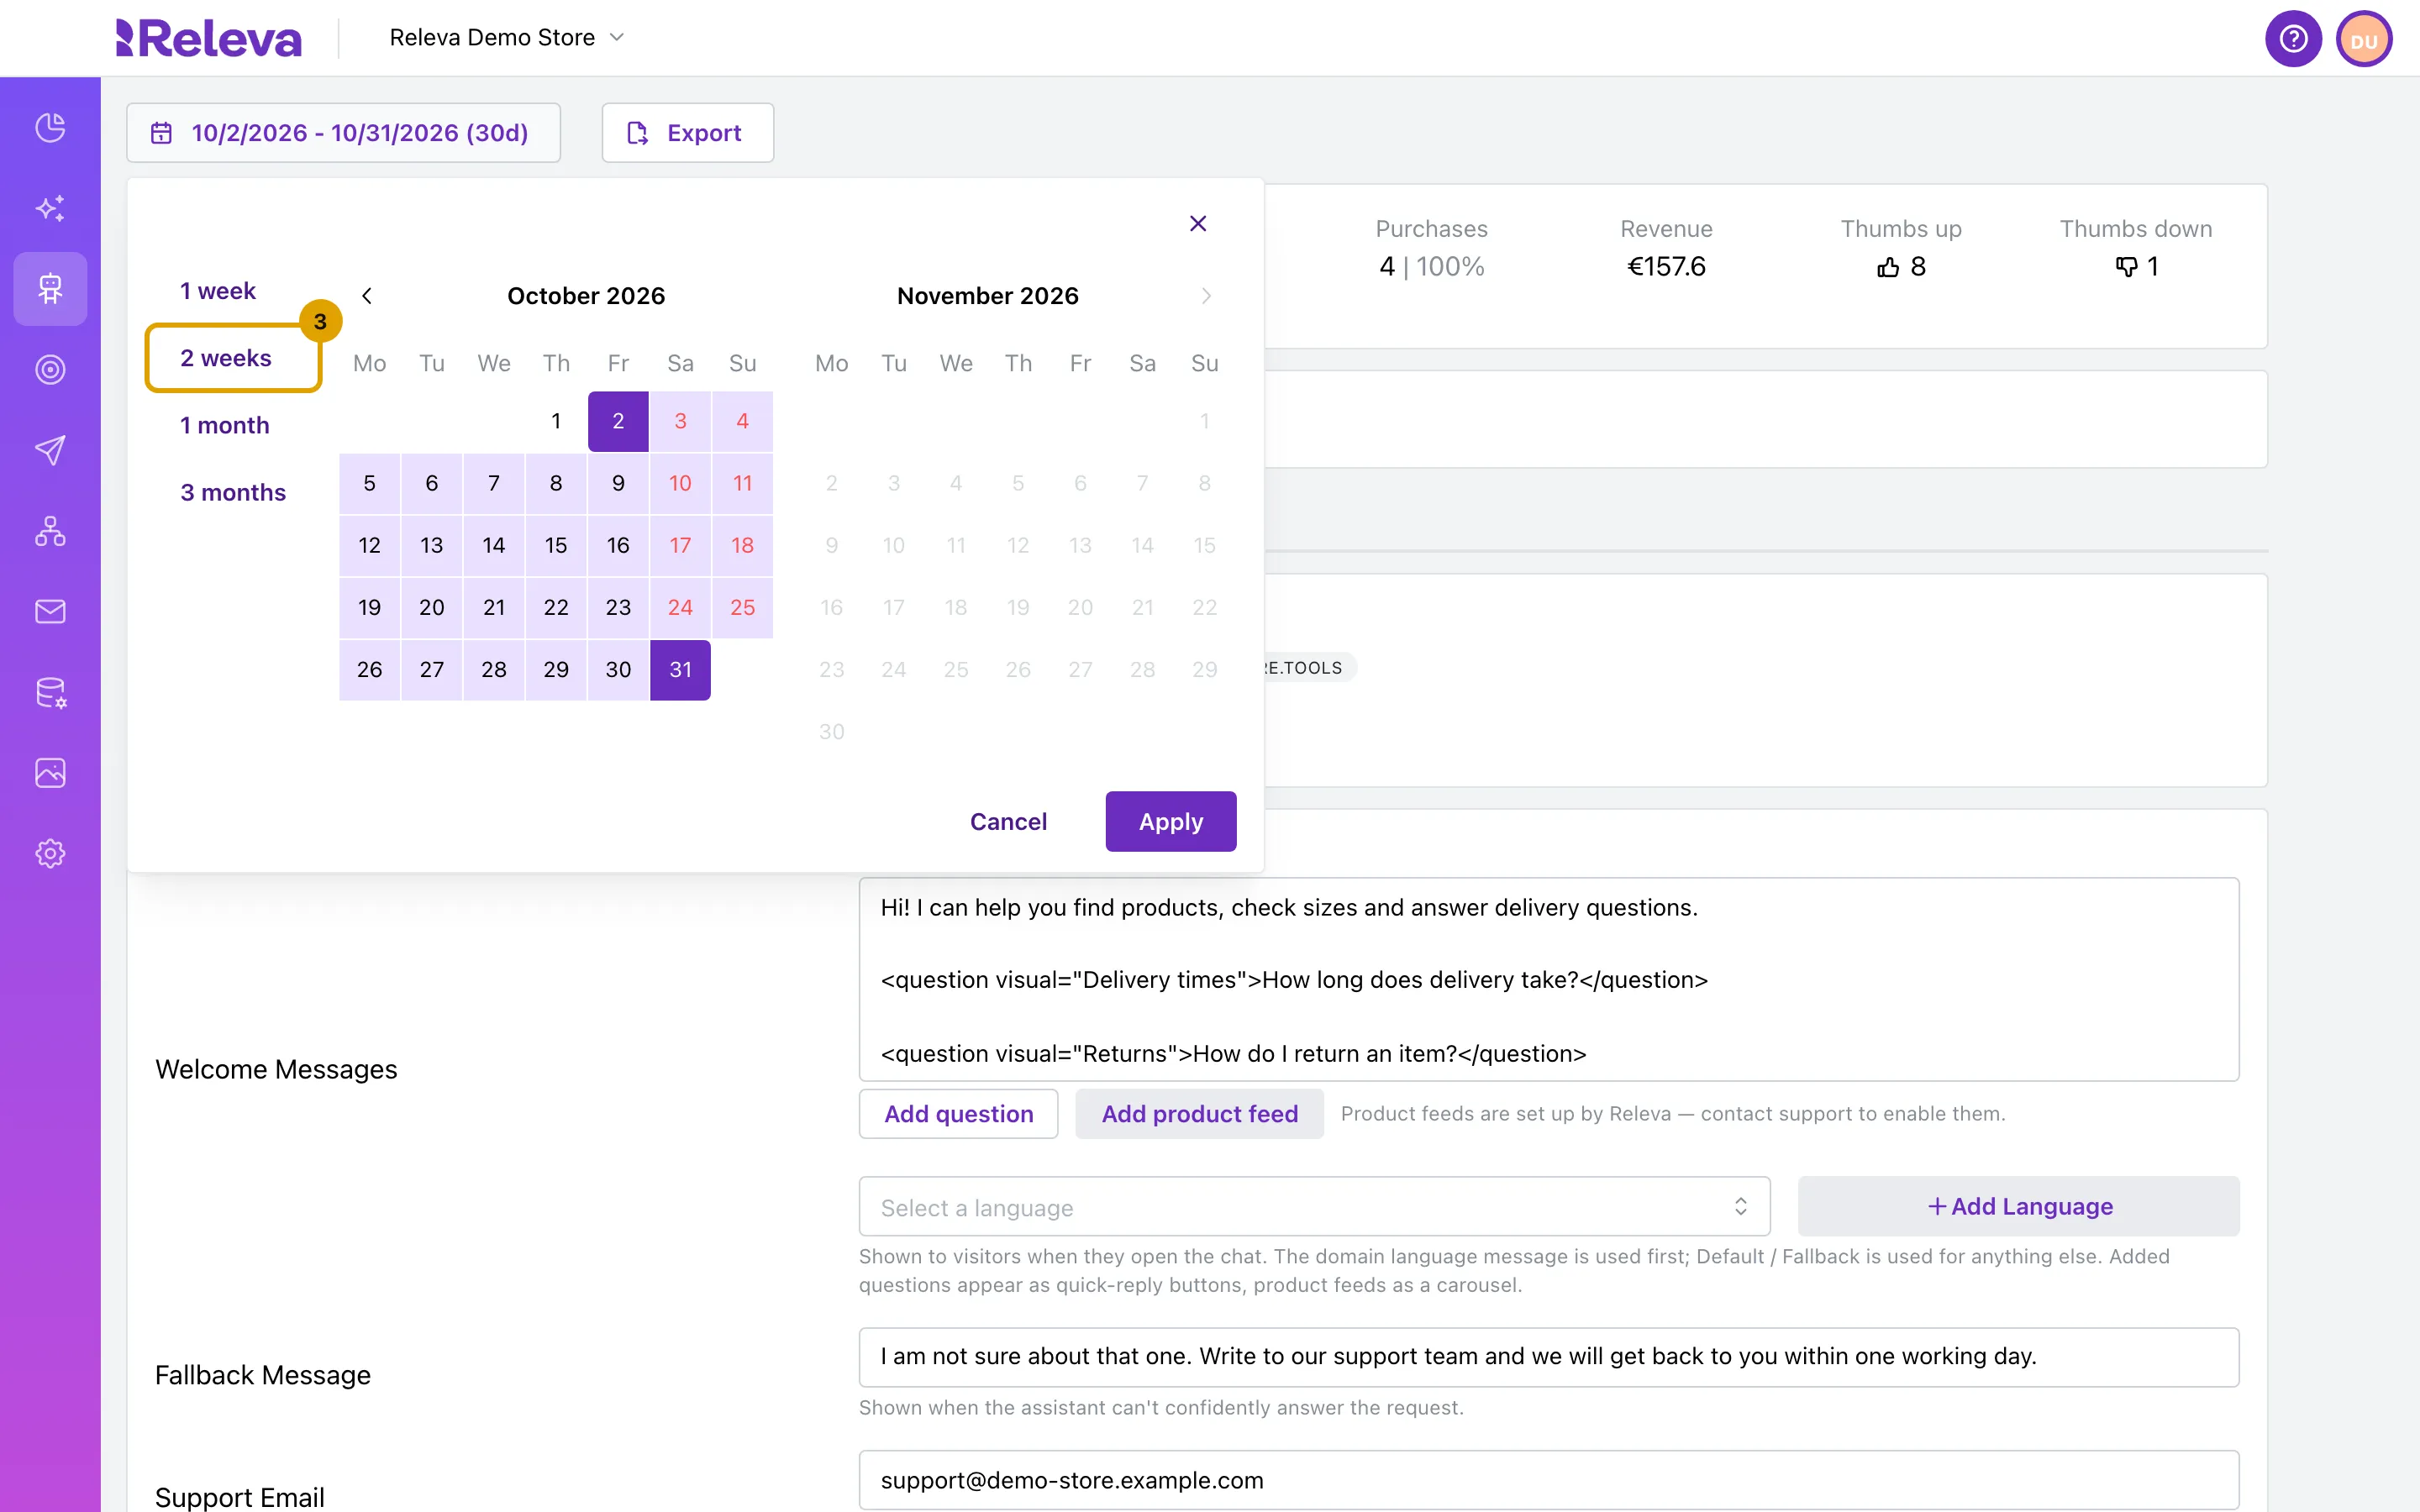
Select a preset such as 2 weeks, or pick a start and an end day in the calendar and select Apply.
The presets 1 week, 2 weeks, 1 month and 3 months end today and apply at once. Apply stays disabled until you have picked an end day.
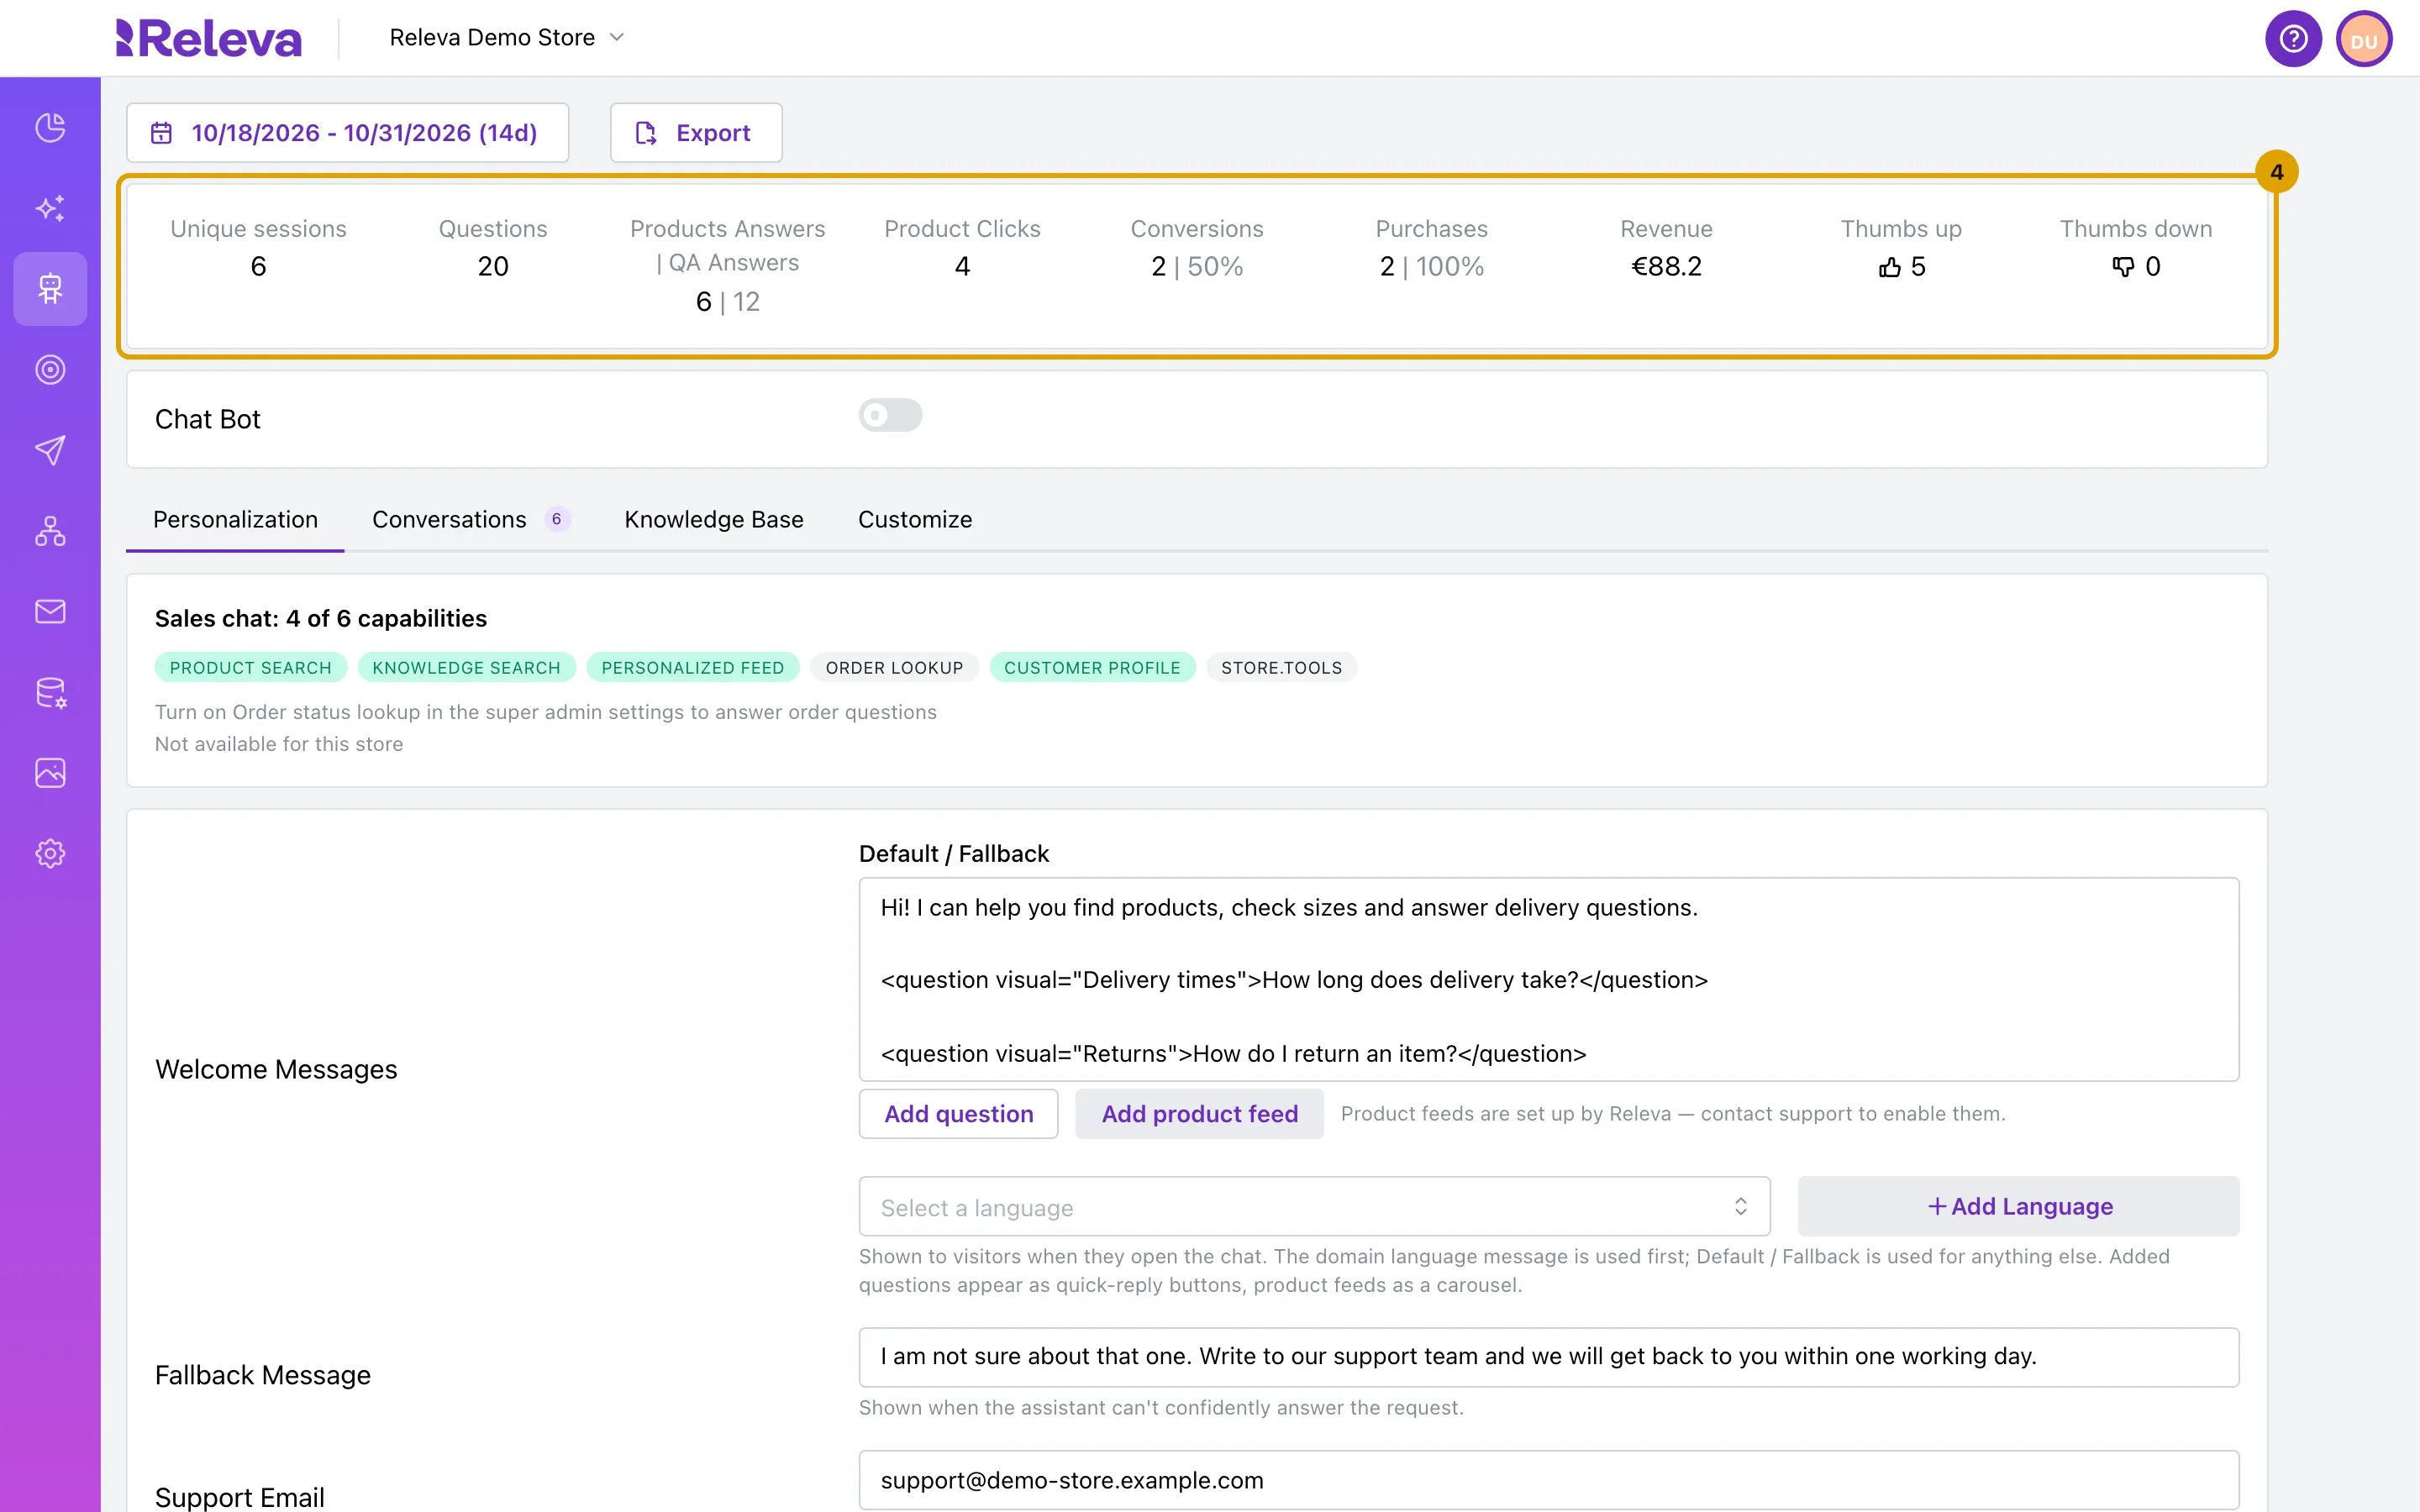
The figures, and the list on the Conversations tab, now cover the period you picked.
-
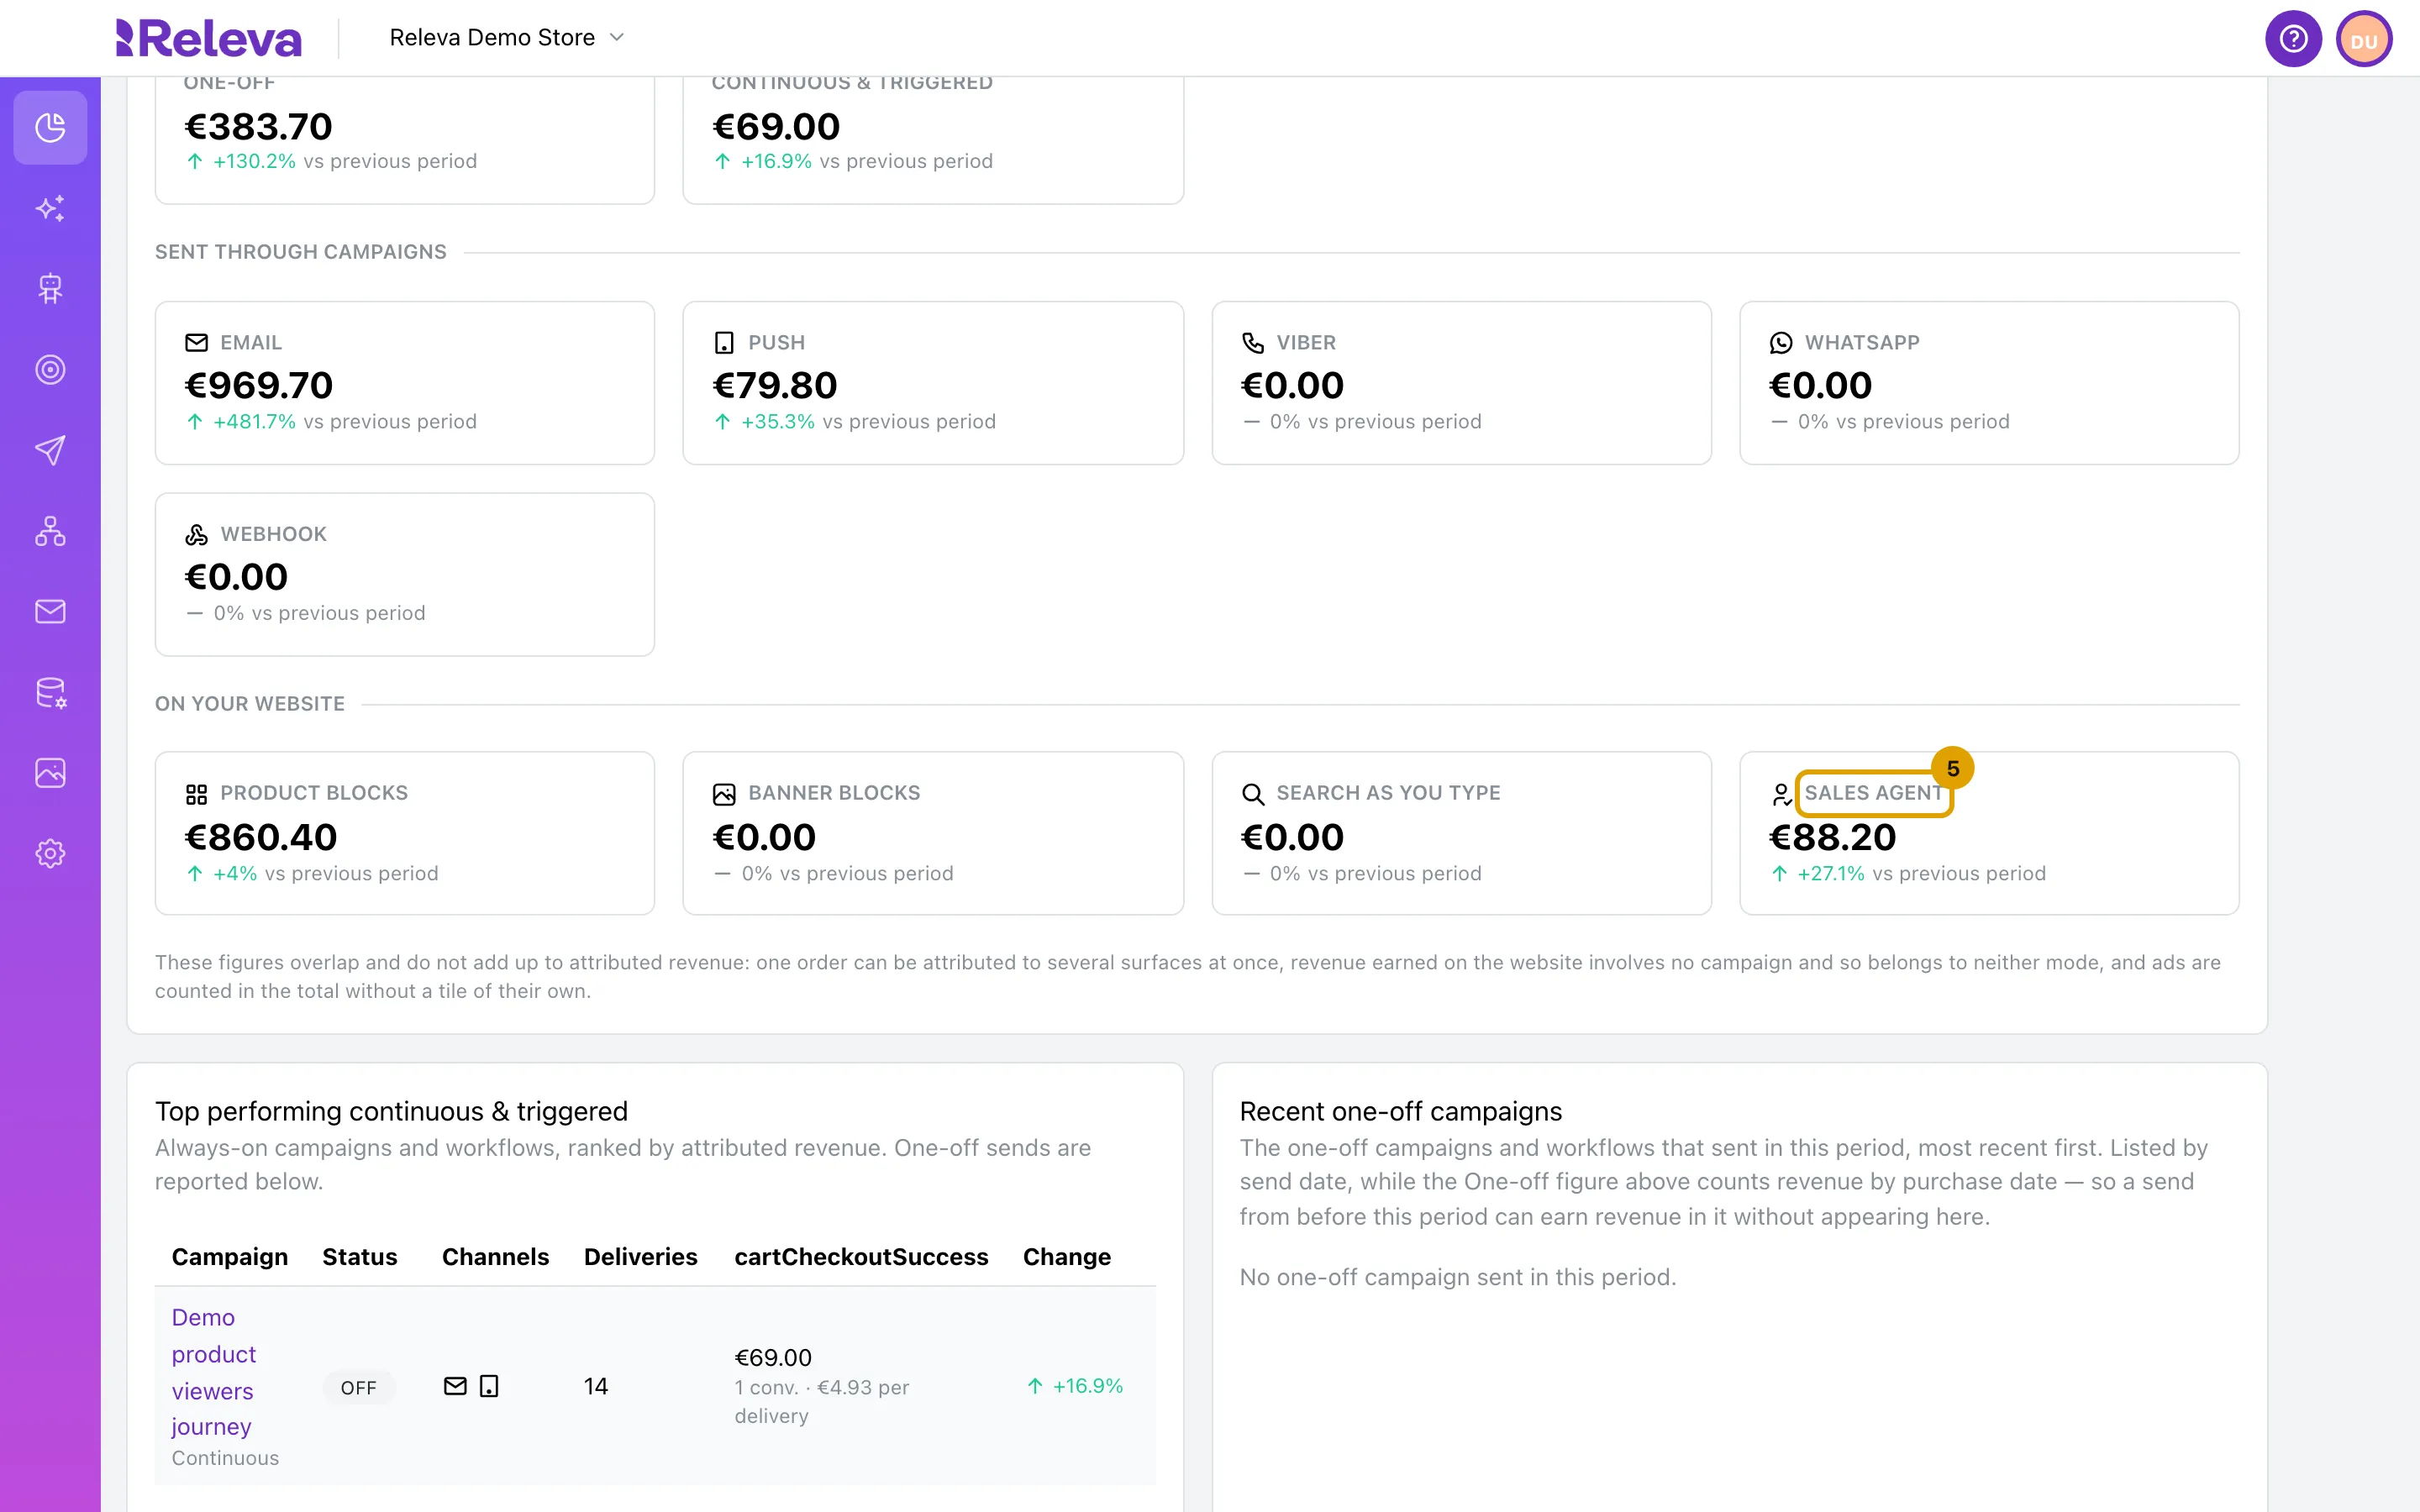
To compare the Sales Agent with your other on-site tools, go to Analytics › Dashboard.
On the At a Glance tab, the Sales agent tile under On your website shows the revenue Releva attributes to the Sales Agent, and how it changed against the period before.
To get every message of the period as a file, select Export next to the date range, then Create Export. You receive it by e-mail as a CSV file.
Check it worked
Section titled “Check it worked”- The date range button shows the period you picked, with its length in days, for example (14d).
- Unique sessions and the badge on Conversations show the same number.
Troubleshooting
Section titled “Troubleshooting”Every figure is 0. No shopper chatted in the period. Check that the Chat Bot switch is on, then widen the date range. The widget can also be limited to some pages by URL filter on the Customize tab.
Conversions shows a number but Product Clicks is 0, or the share reads ∞%. A cart add or purchase was credited to the Sales Agent without a recorded click in the same period, for example when the click happened before your start date. Widen the date range.
Revenue here differs from the Sales agent tile on the dashboard. The two default to different periods (30 days here, 14 days on At a Glance), and the dashboard counts revenue the way its conversion metric is set. Set both to the same period before you compare.
Too many thumbs down. Filter the conversations by With 👎 and fix the answers. See Review Sales Agent conversations.