

Check how an email performs
You see an email’s results in two places. Its card in the Emails list has a row of totals, from sent to unsubscribed. Its Statistics page has two tabs. Click Analytics lays the click counts over the email itself, so you see which link or product people selected. Statistics shows a funnel from sent to purchased, a daily chart of unique profiles per event, and the products bought through the email. This guide reads all three for one email.
Before you start
Section titled “Before you start”- The email has been sent by a campaign or workflow in the period you want to look at. An email that was never sent shows zeros and empty charts.
- Clicks are counted on tracked links. Releva adds a tracking id to every link when you save an email built in the visual editor, so emails saved before click tracking existed may show no click map.
-
Go to Marketing Channels › Emails
-
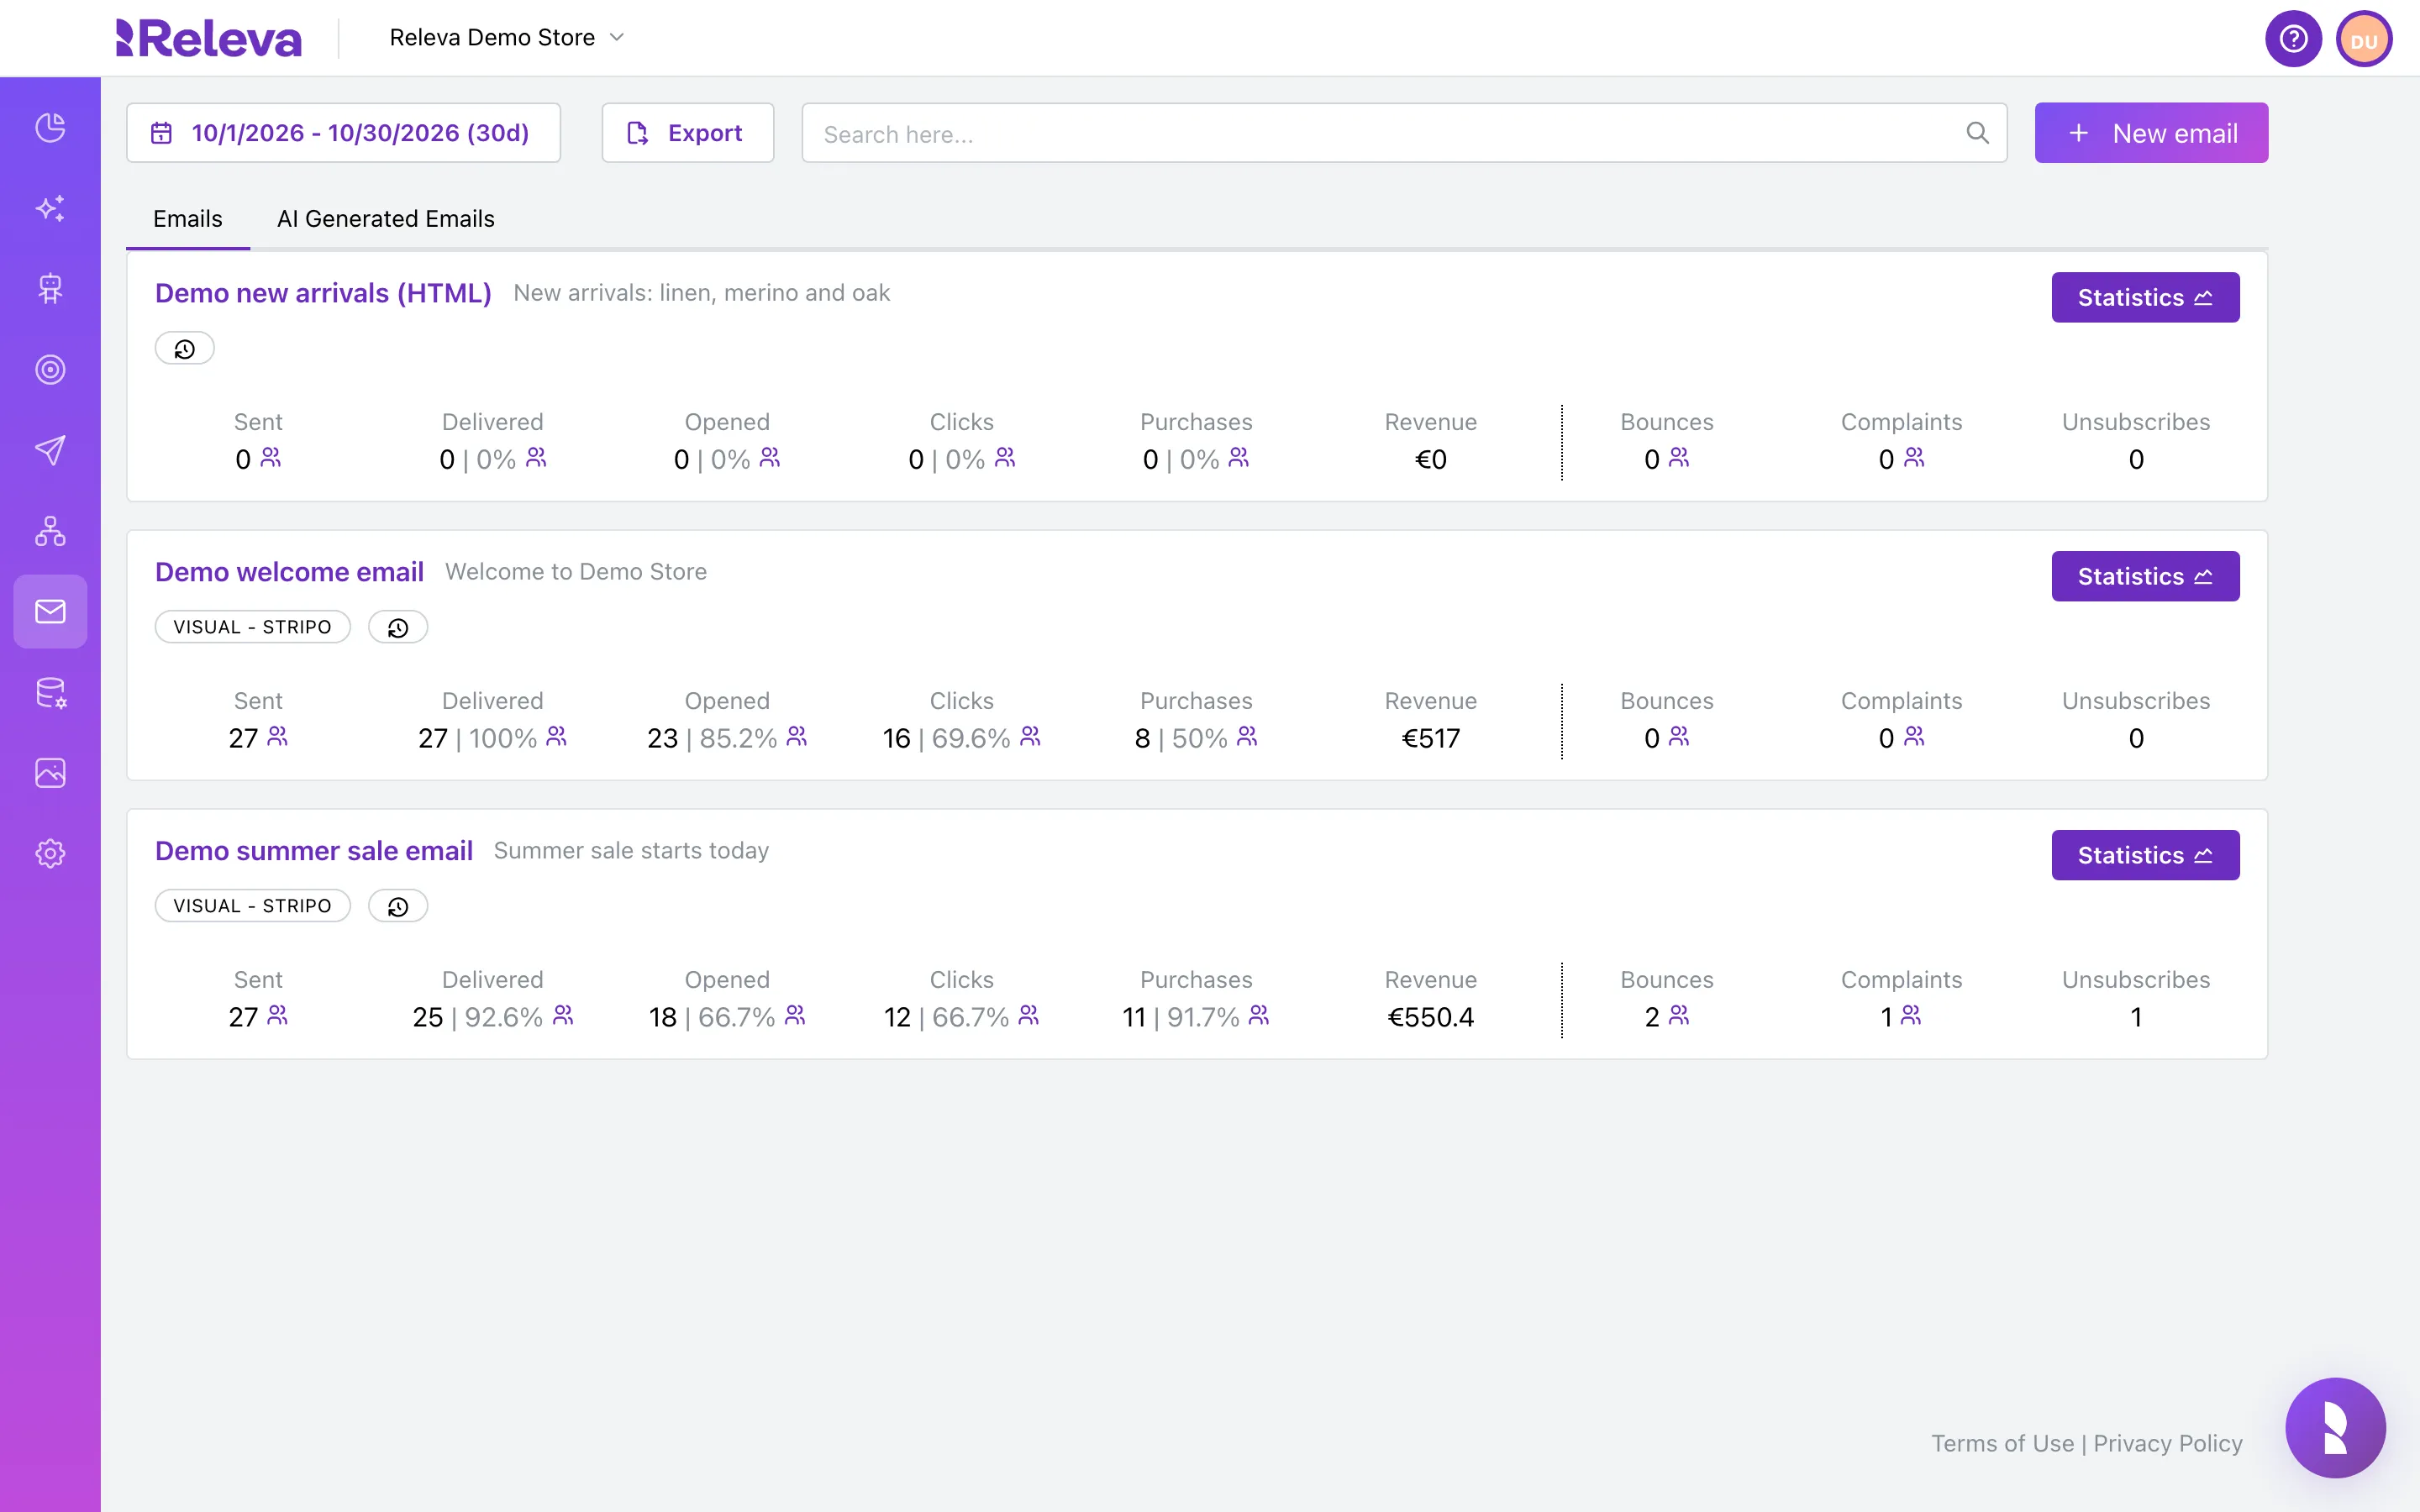
Find the email. Its card shows the results for the period at the top of the list, the last 30 days by default
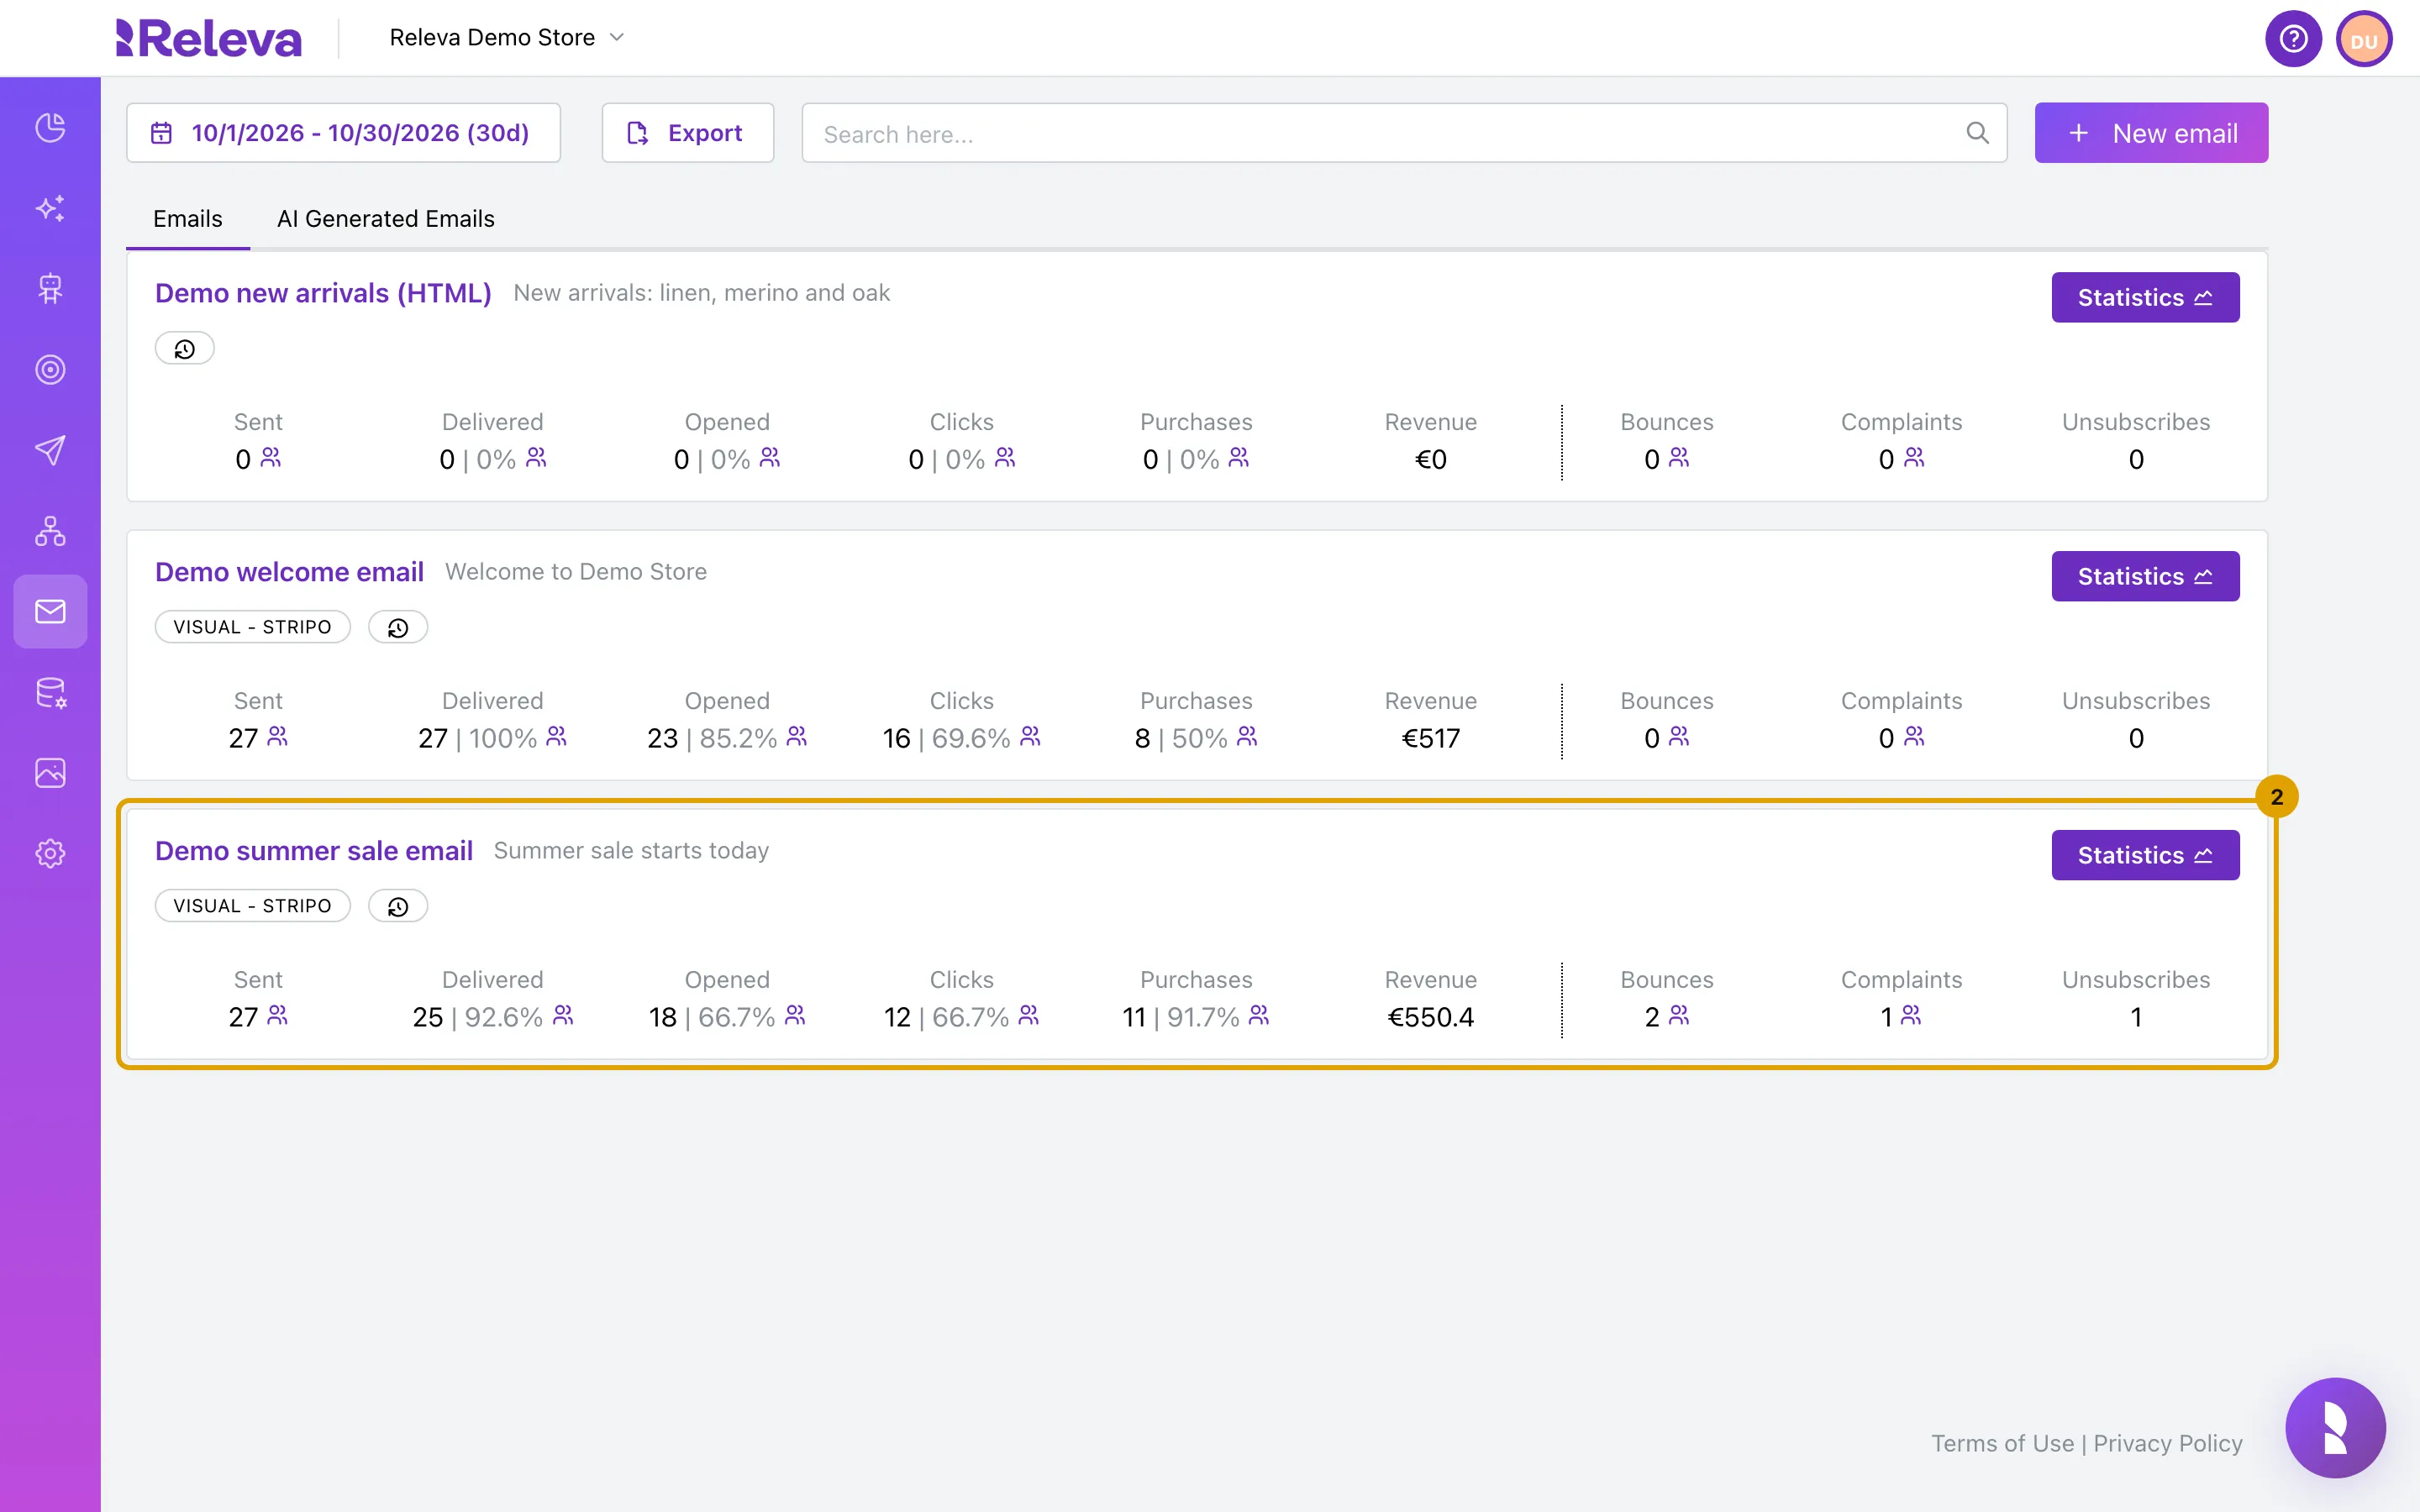
Tile What it counts Percentage Sent Emails sent none Delivered Emails the receiving mail server accepted of Sent Opened Opens of Sent Clicks Clicks on links in the email of Opened Purchases Purchases attributed to the email of Clicks Revenue Value of those purchases, in your shop’s currency none Bounces Emails that could not be delivered none Complaints Recipients who marked the email as spam none Unsubscribes Recipients who unsubscribed none A dotted line separates Bounces, Complaints and Unsubscribes from the other tiles.
-
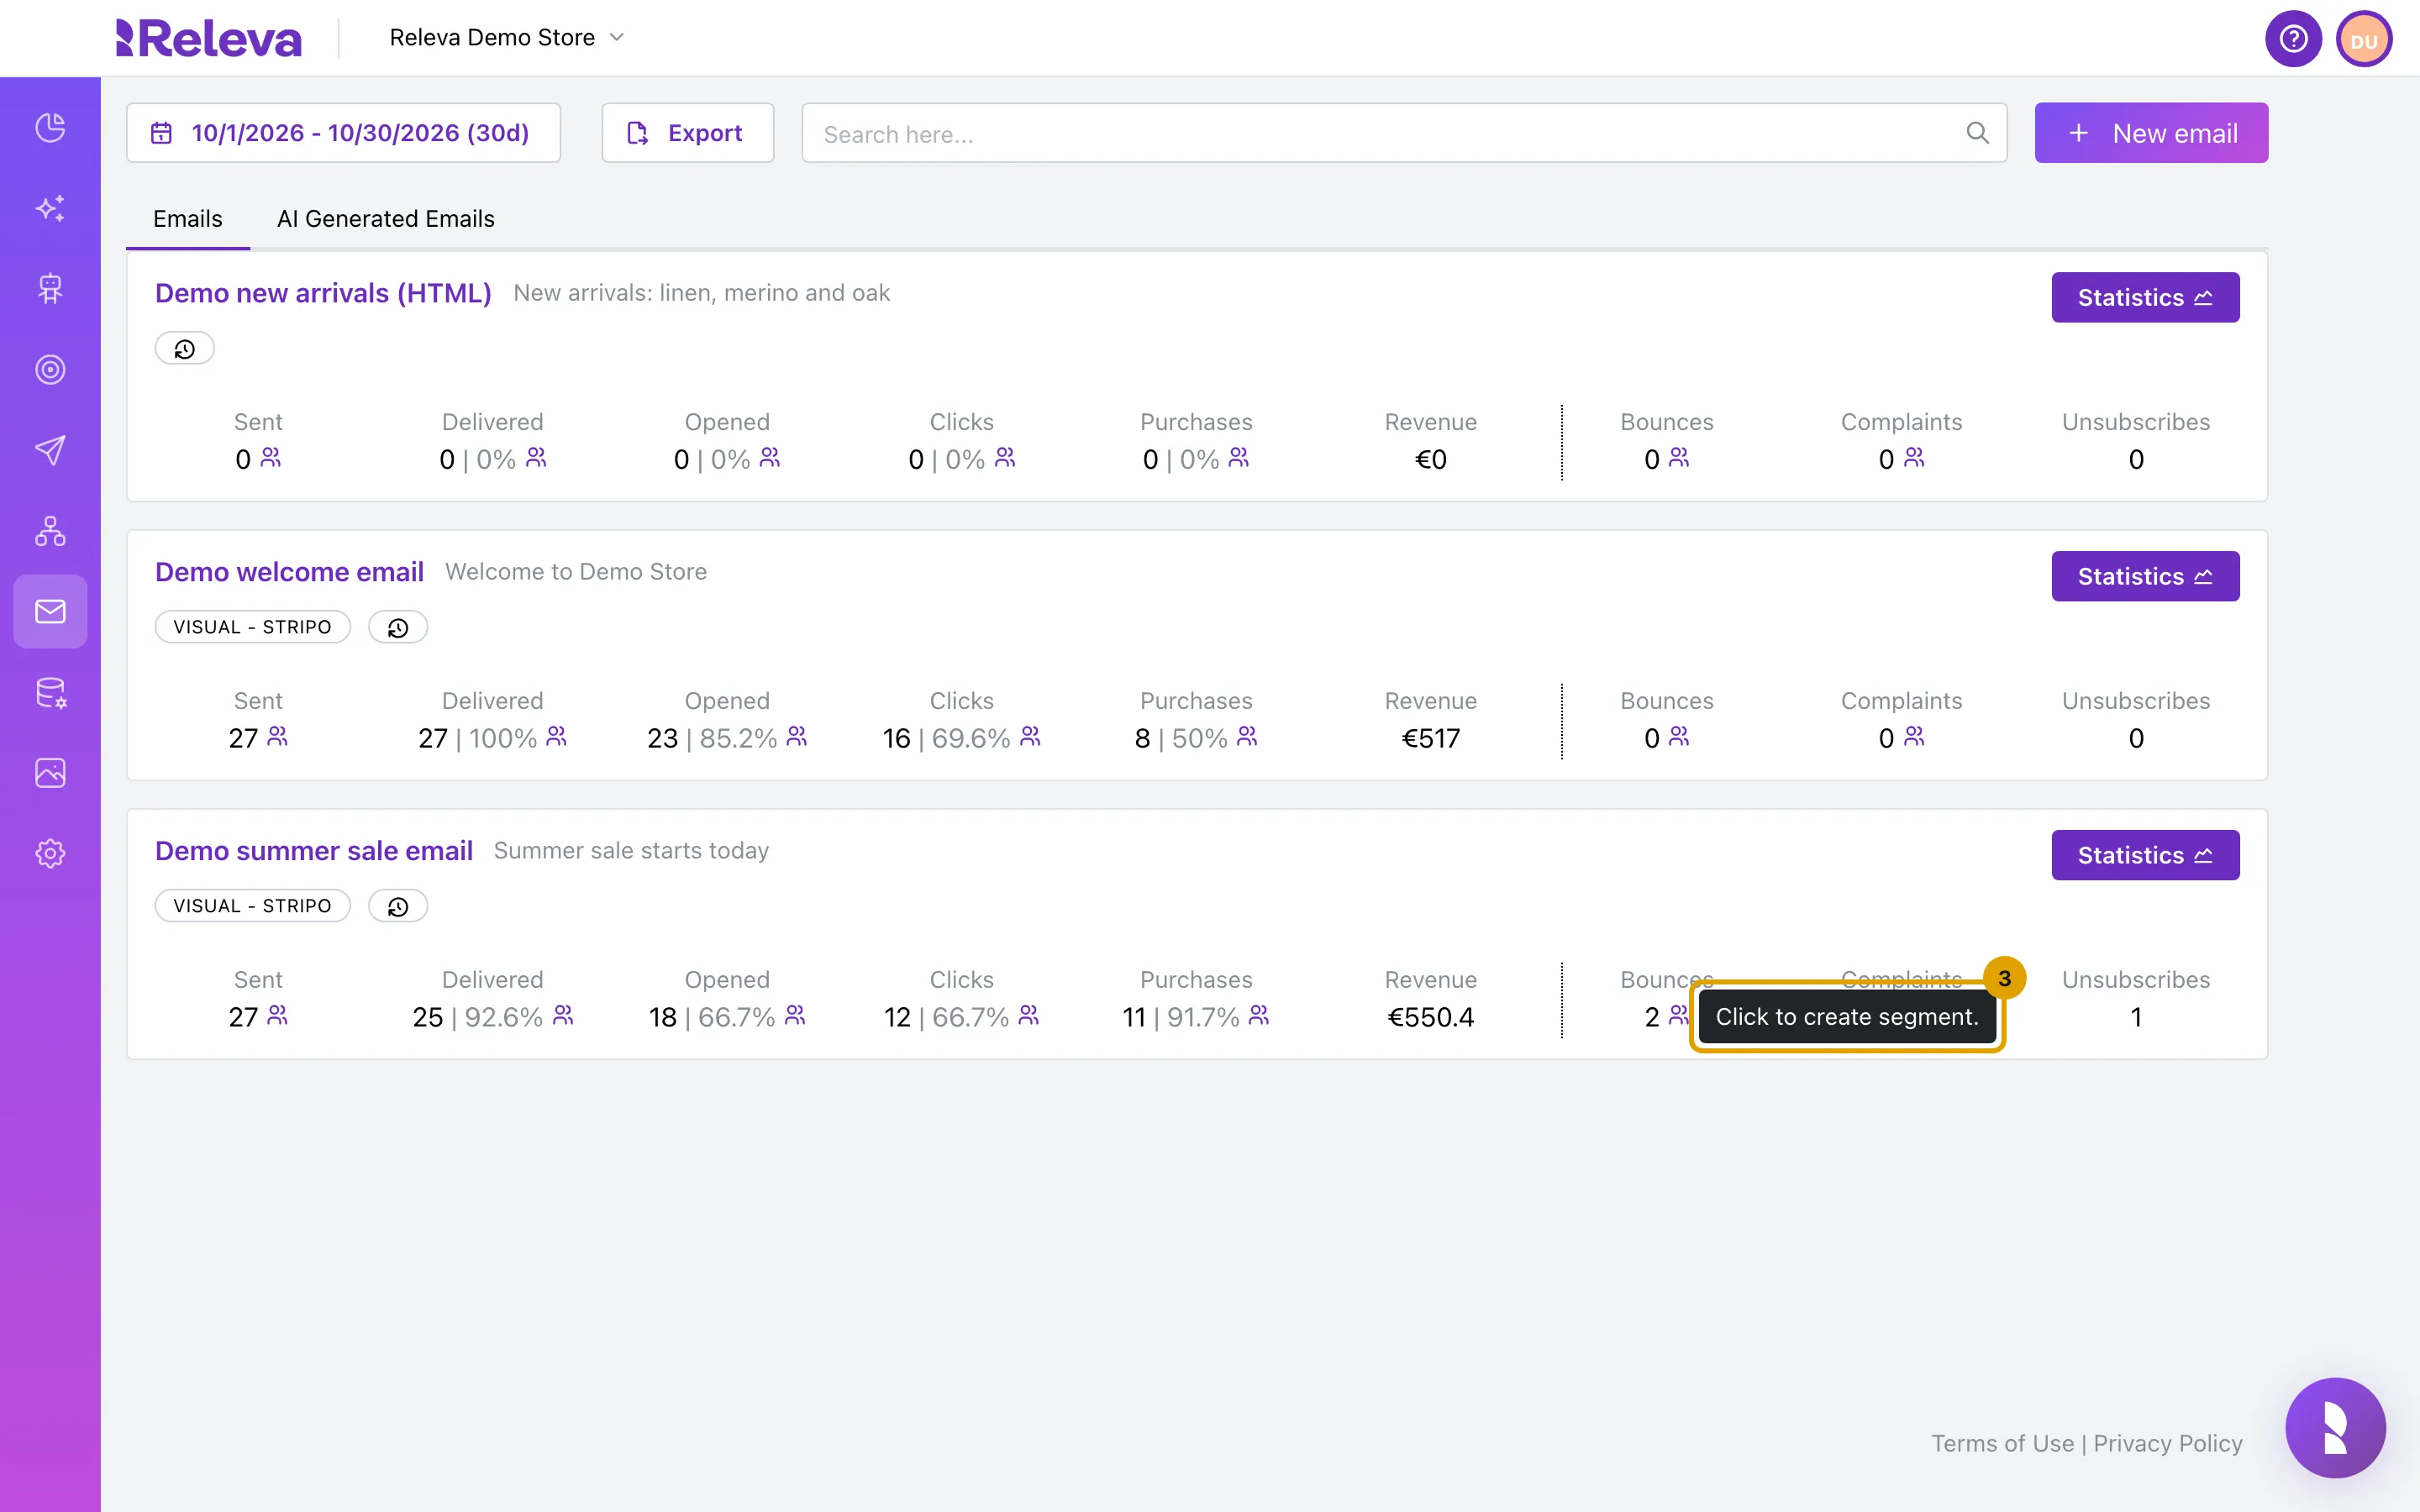
Optional: to reach the people behind a result, select the people icon next to the tile (“Click to create segment.”)
Every tile except Revenue and Unsubscribes has this icon. It opens a new segment draft with a rule for this email and the card’s period, for example everyone who bounced. Save it if you want to keep it. See Create a segment.
-
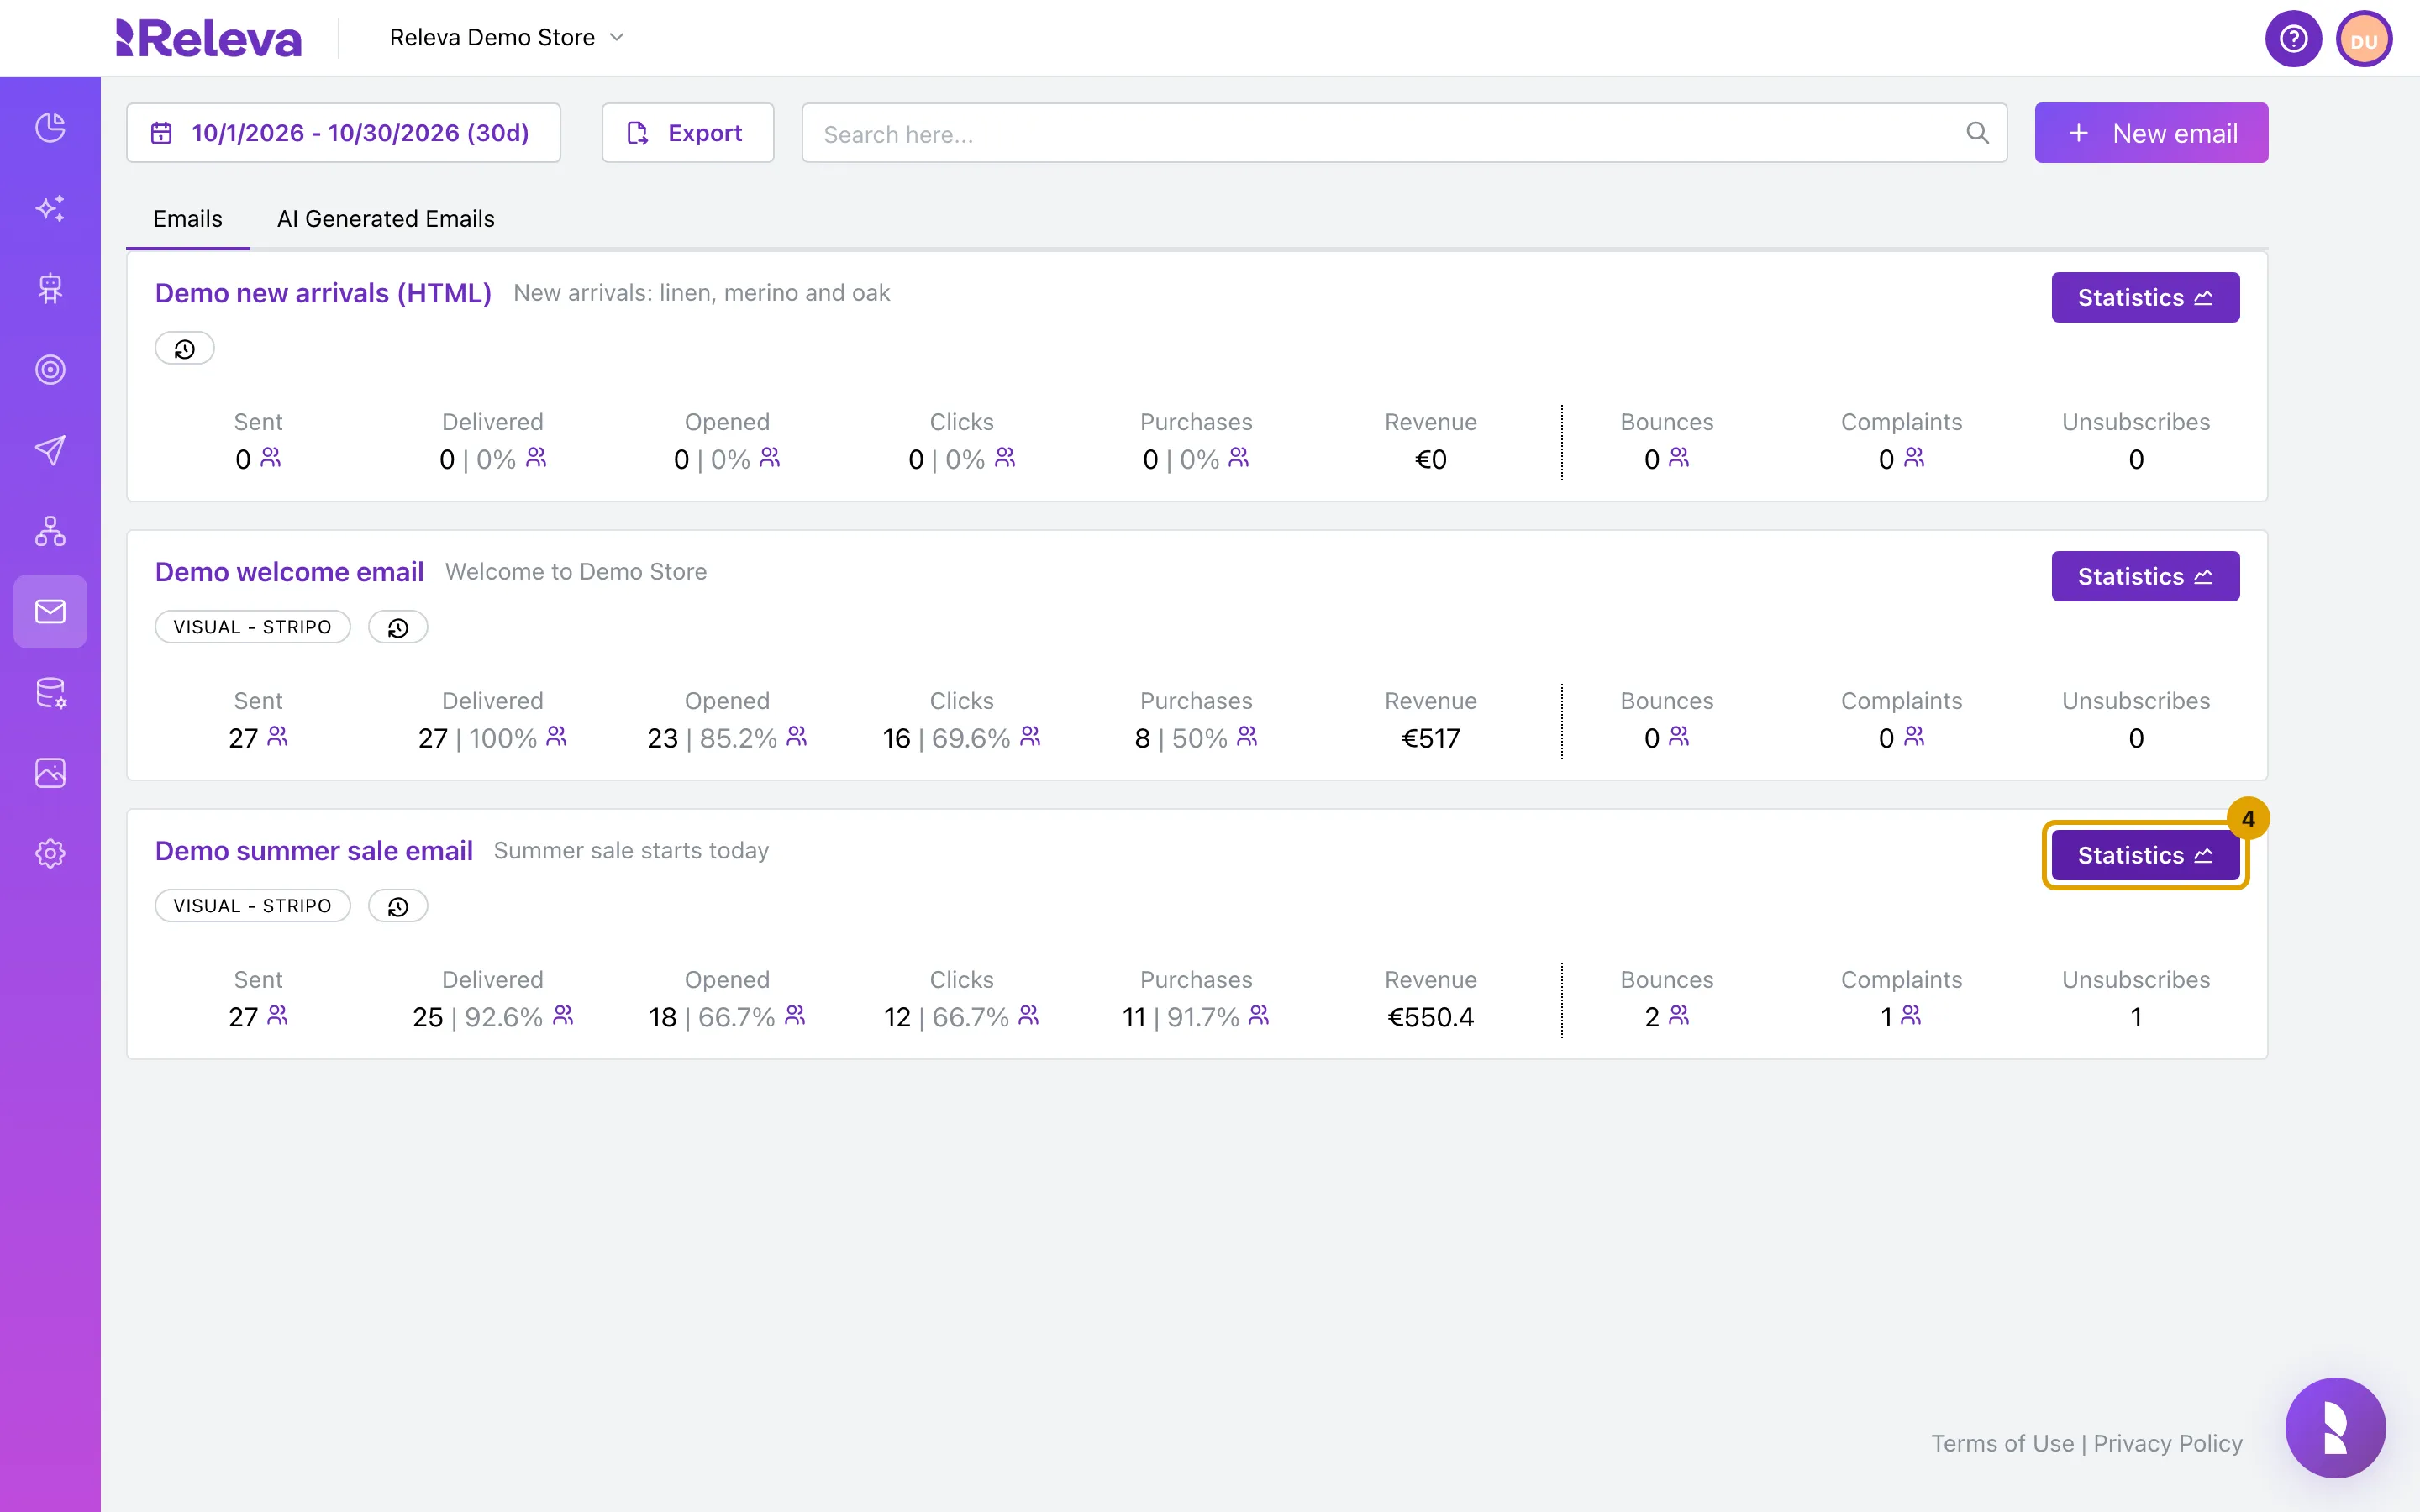
On the email’s card, select Statistics
-
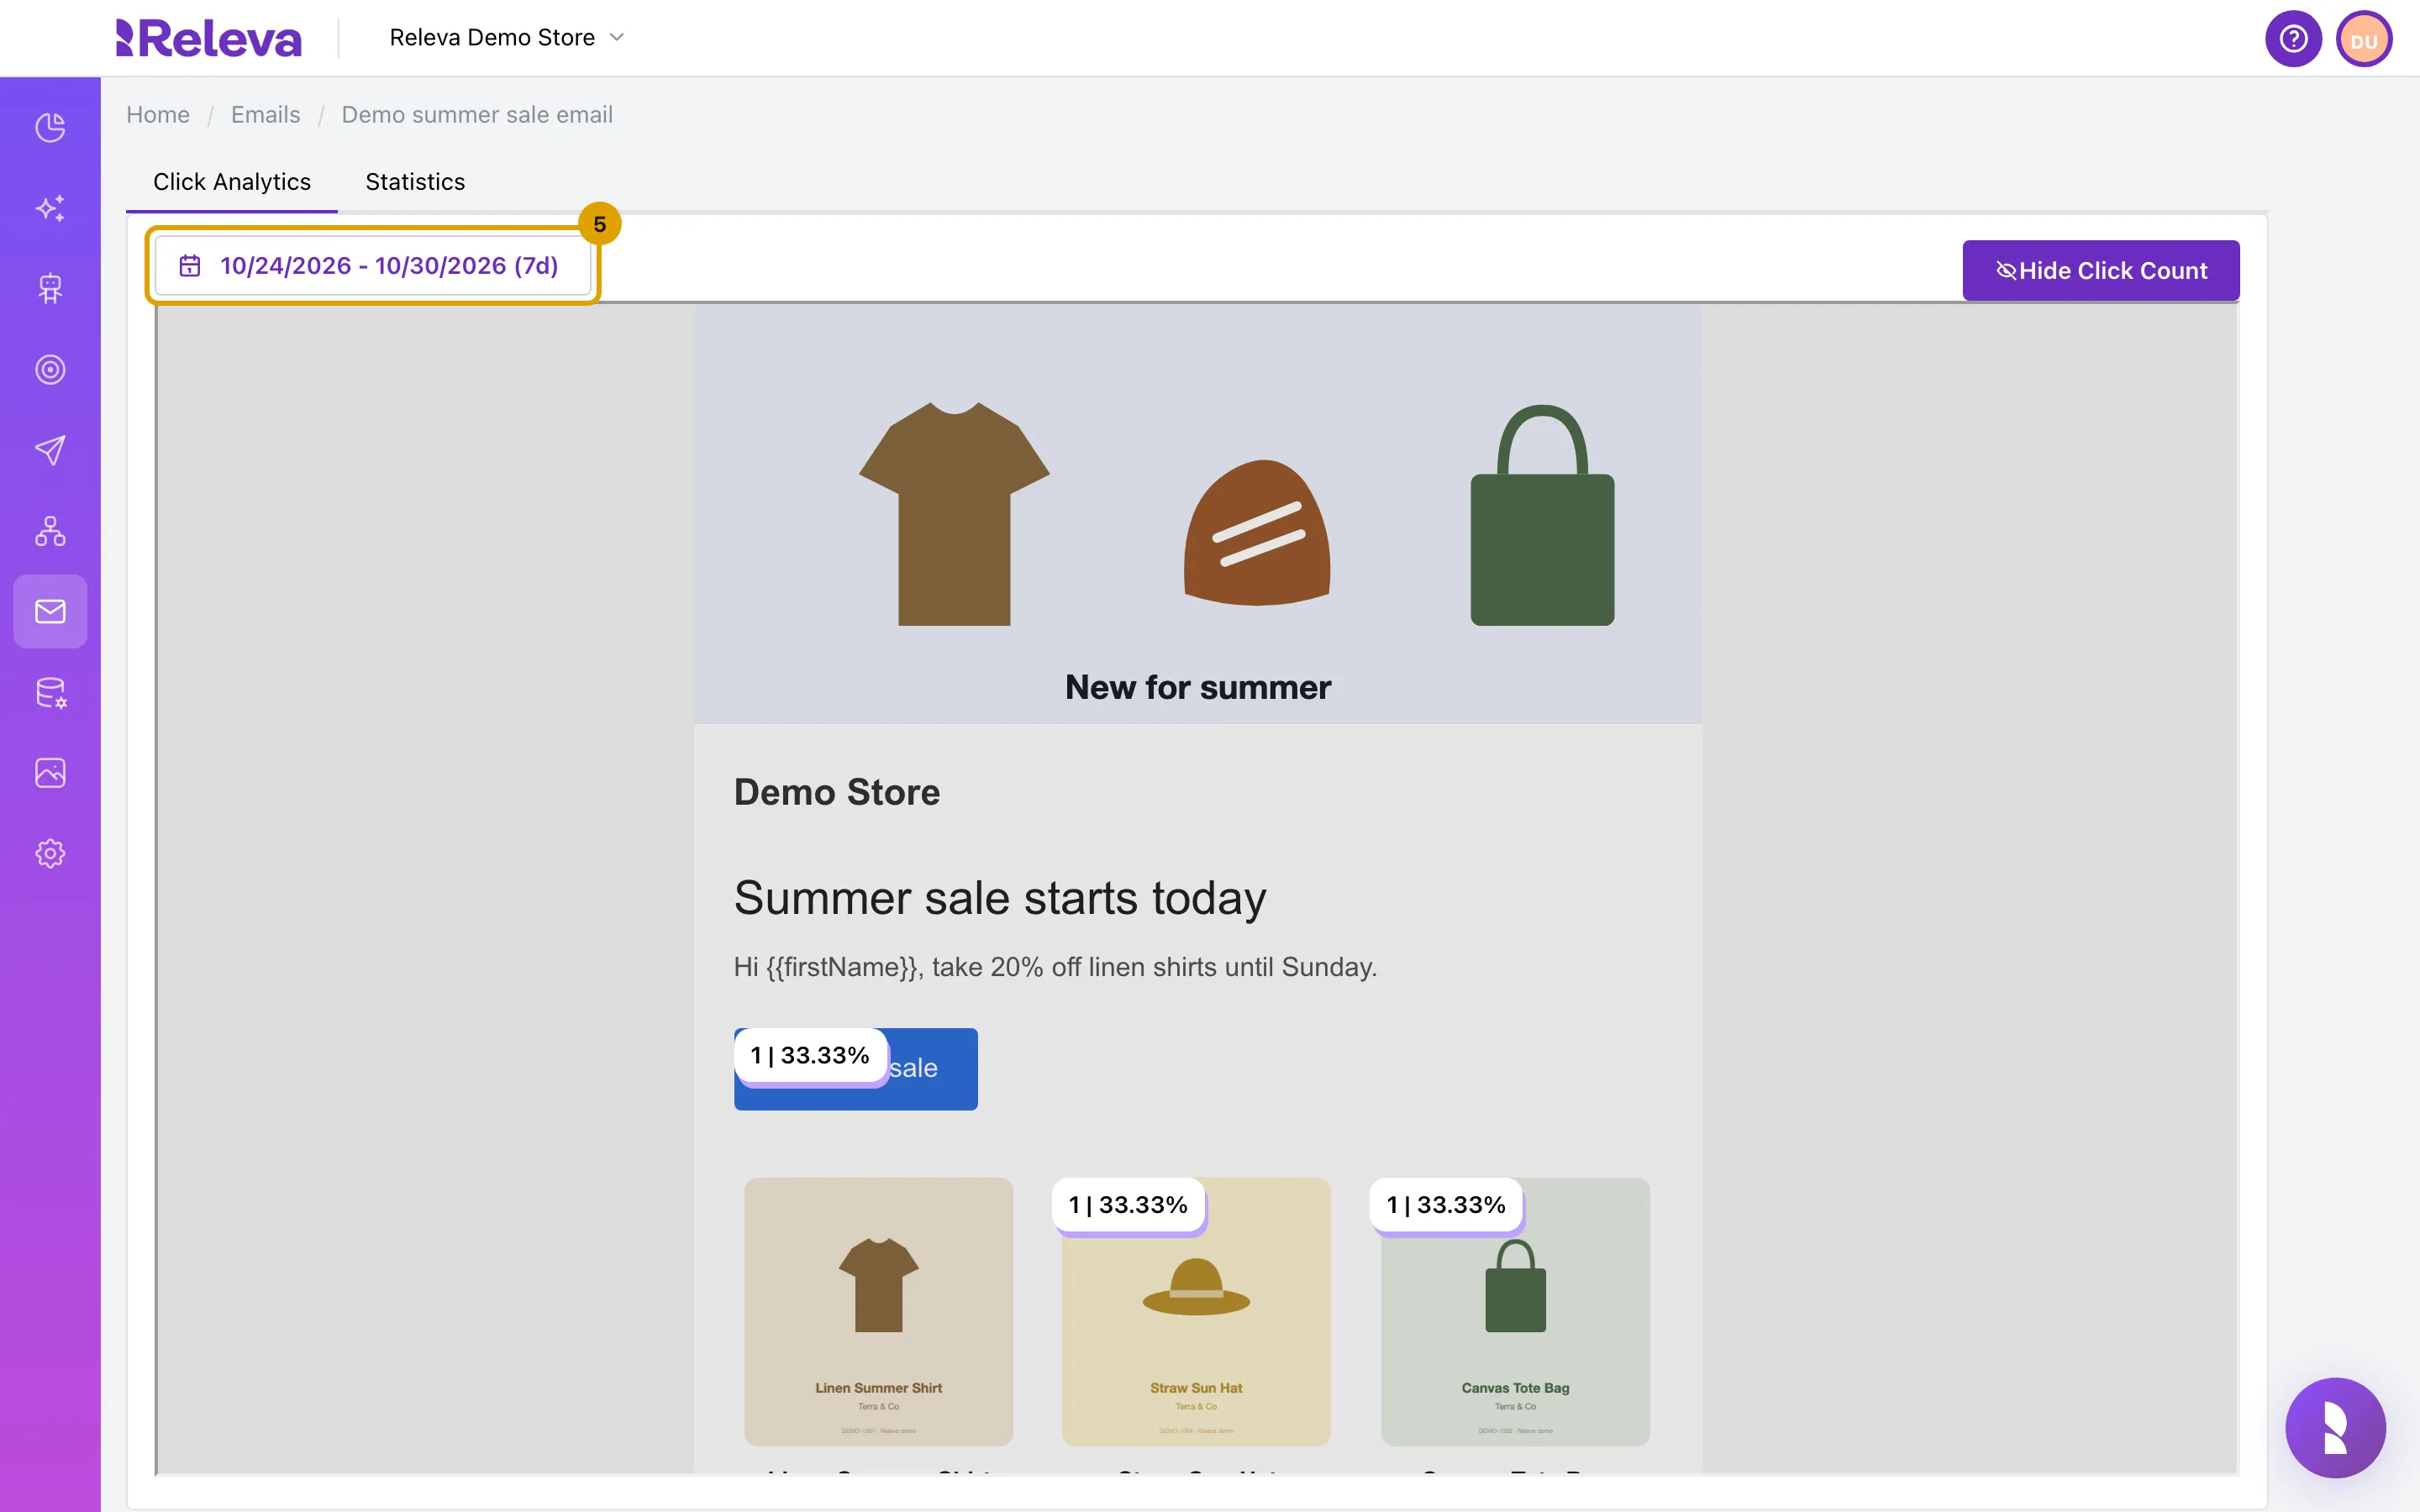
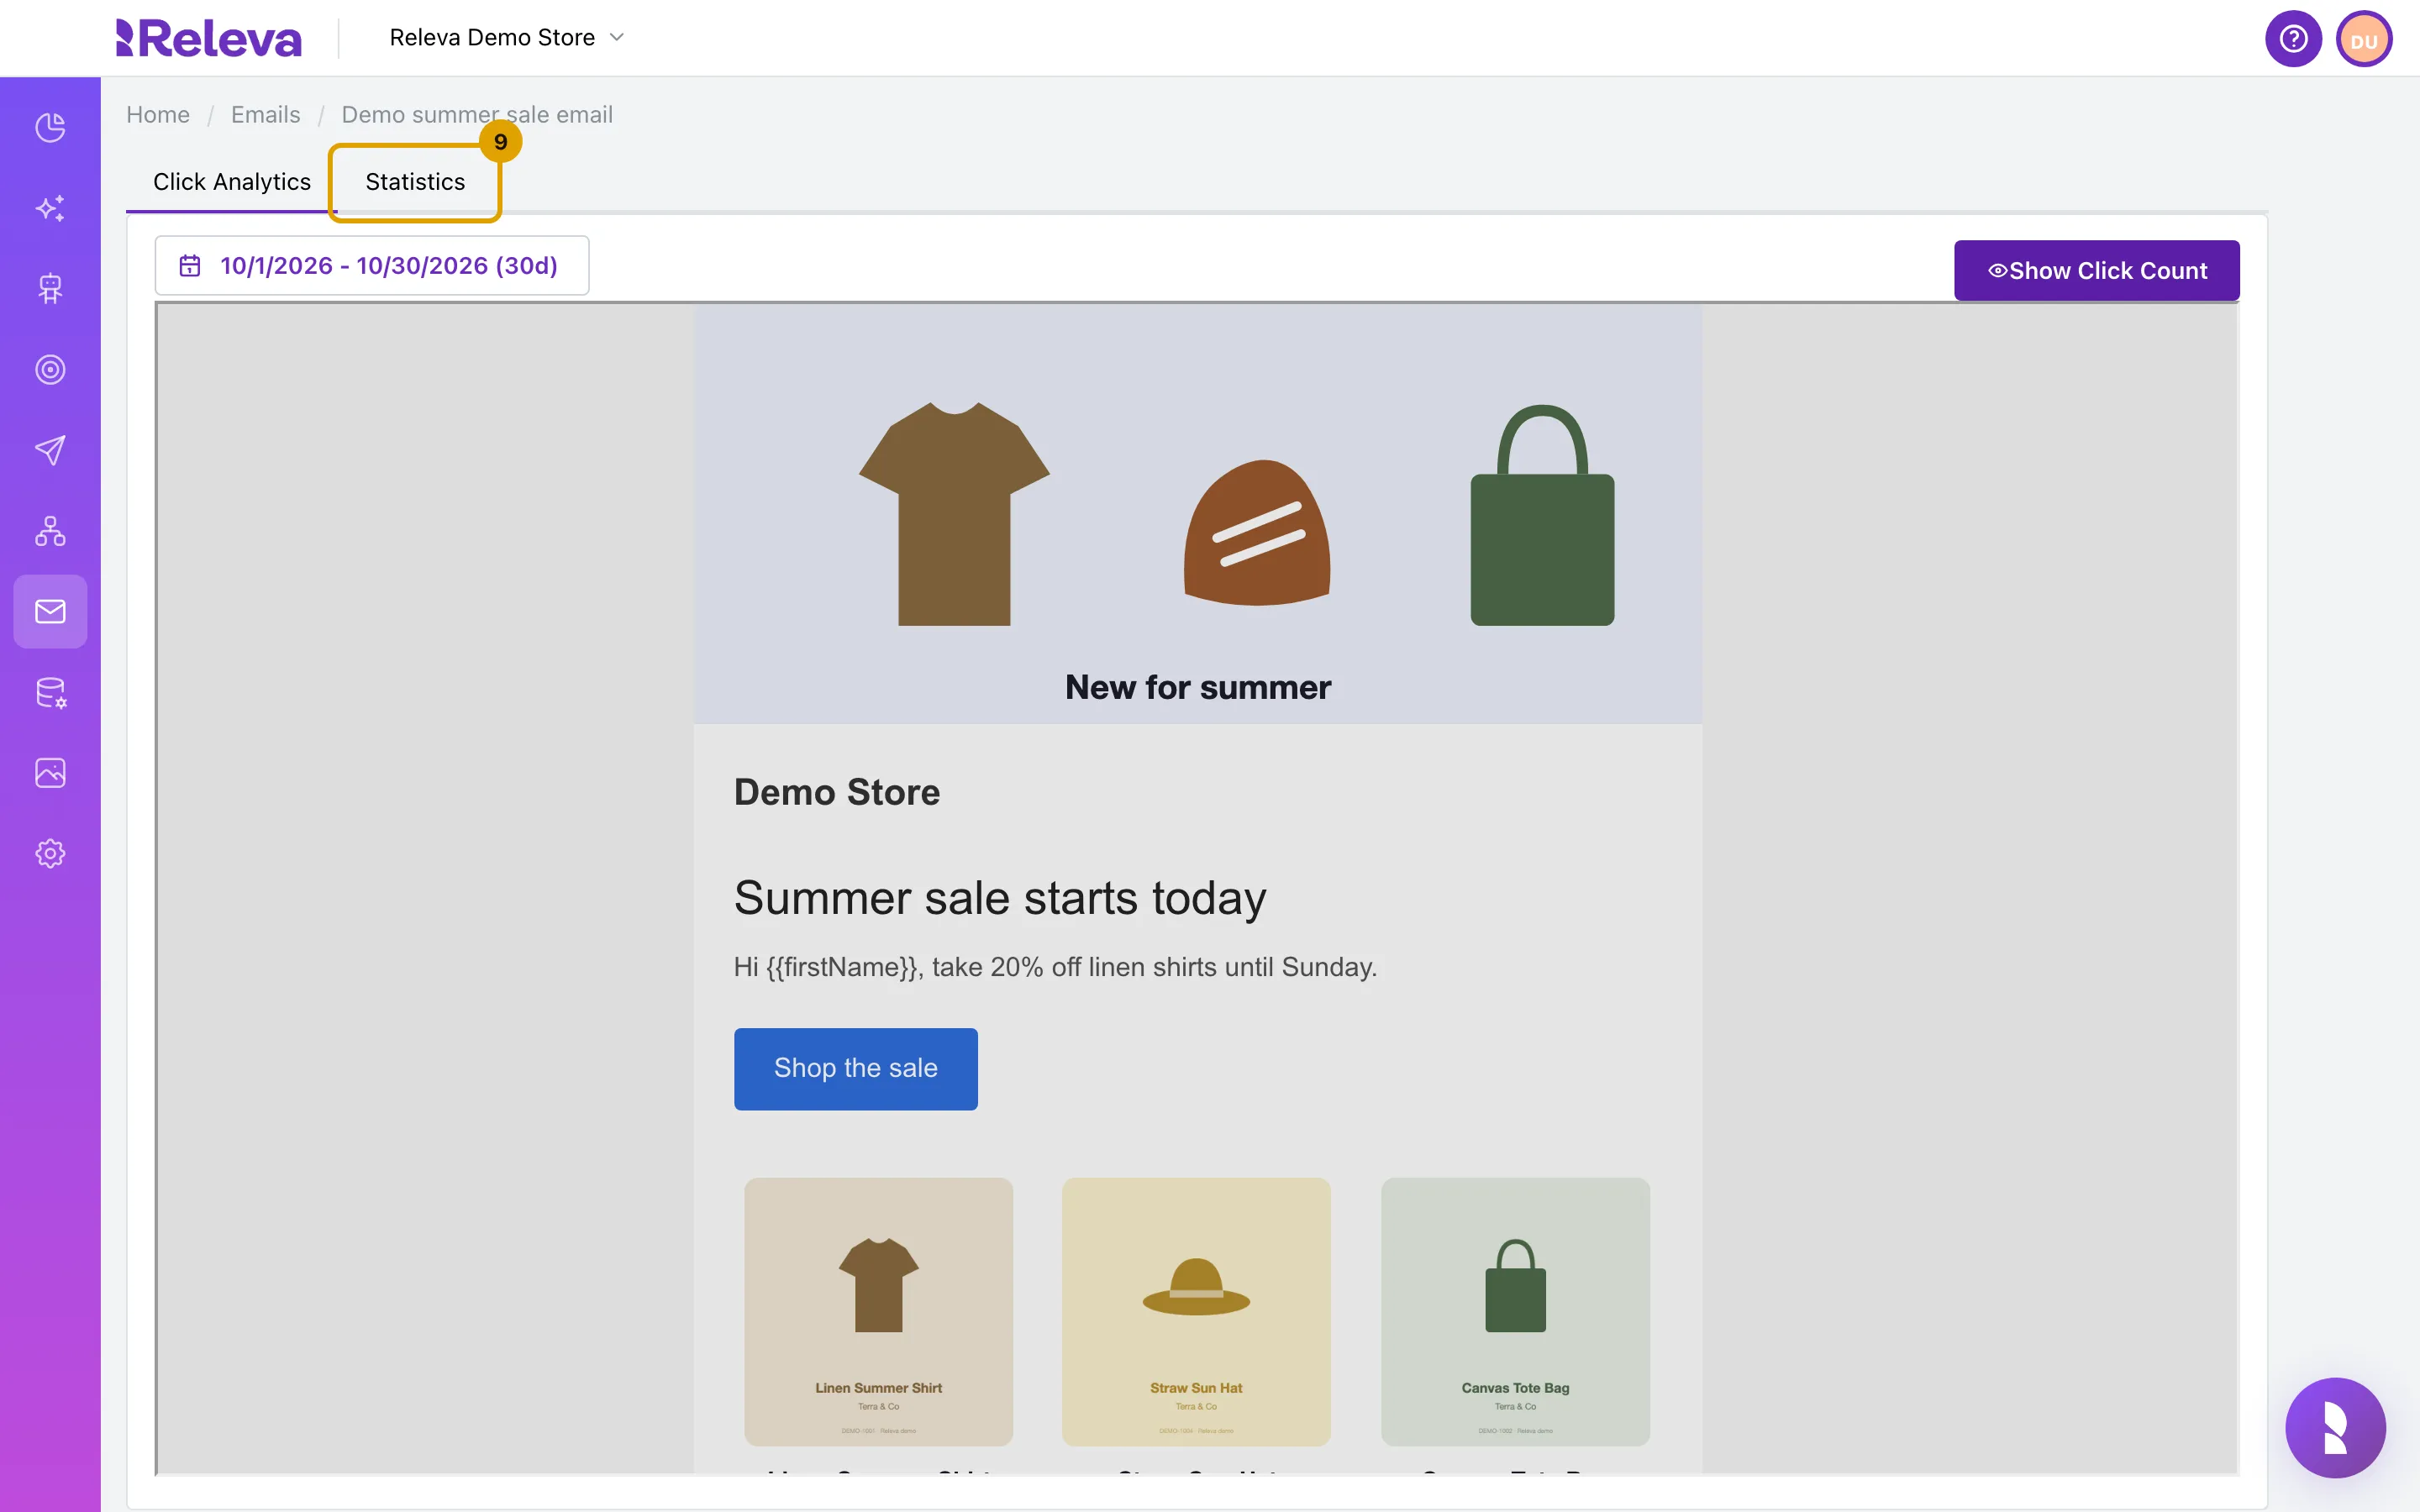
Click Analytics opens first, for the last 7 days. Select the date range to change the period
-
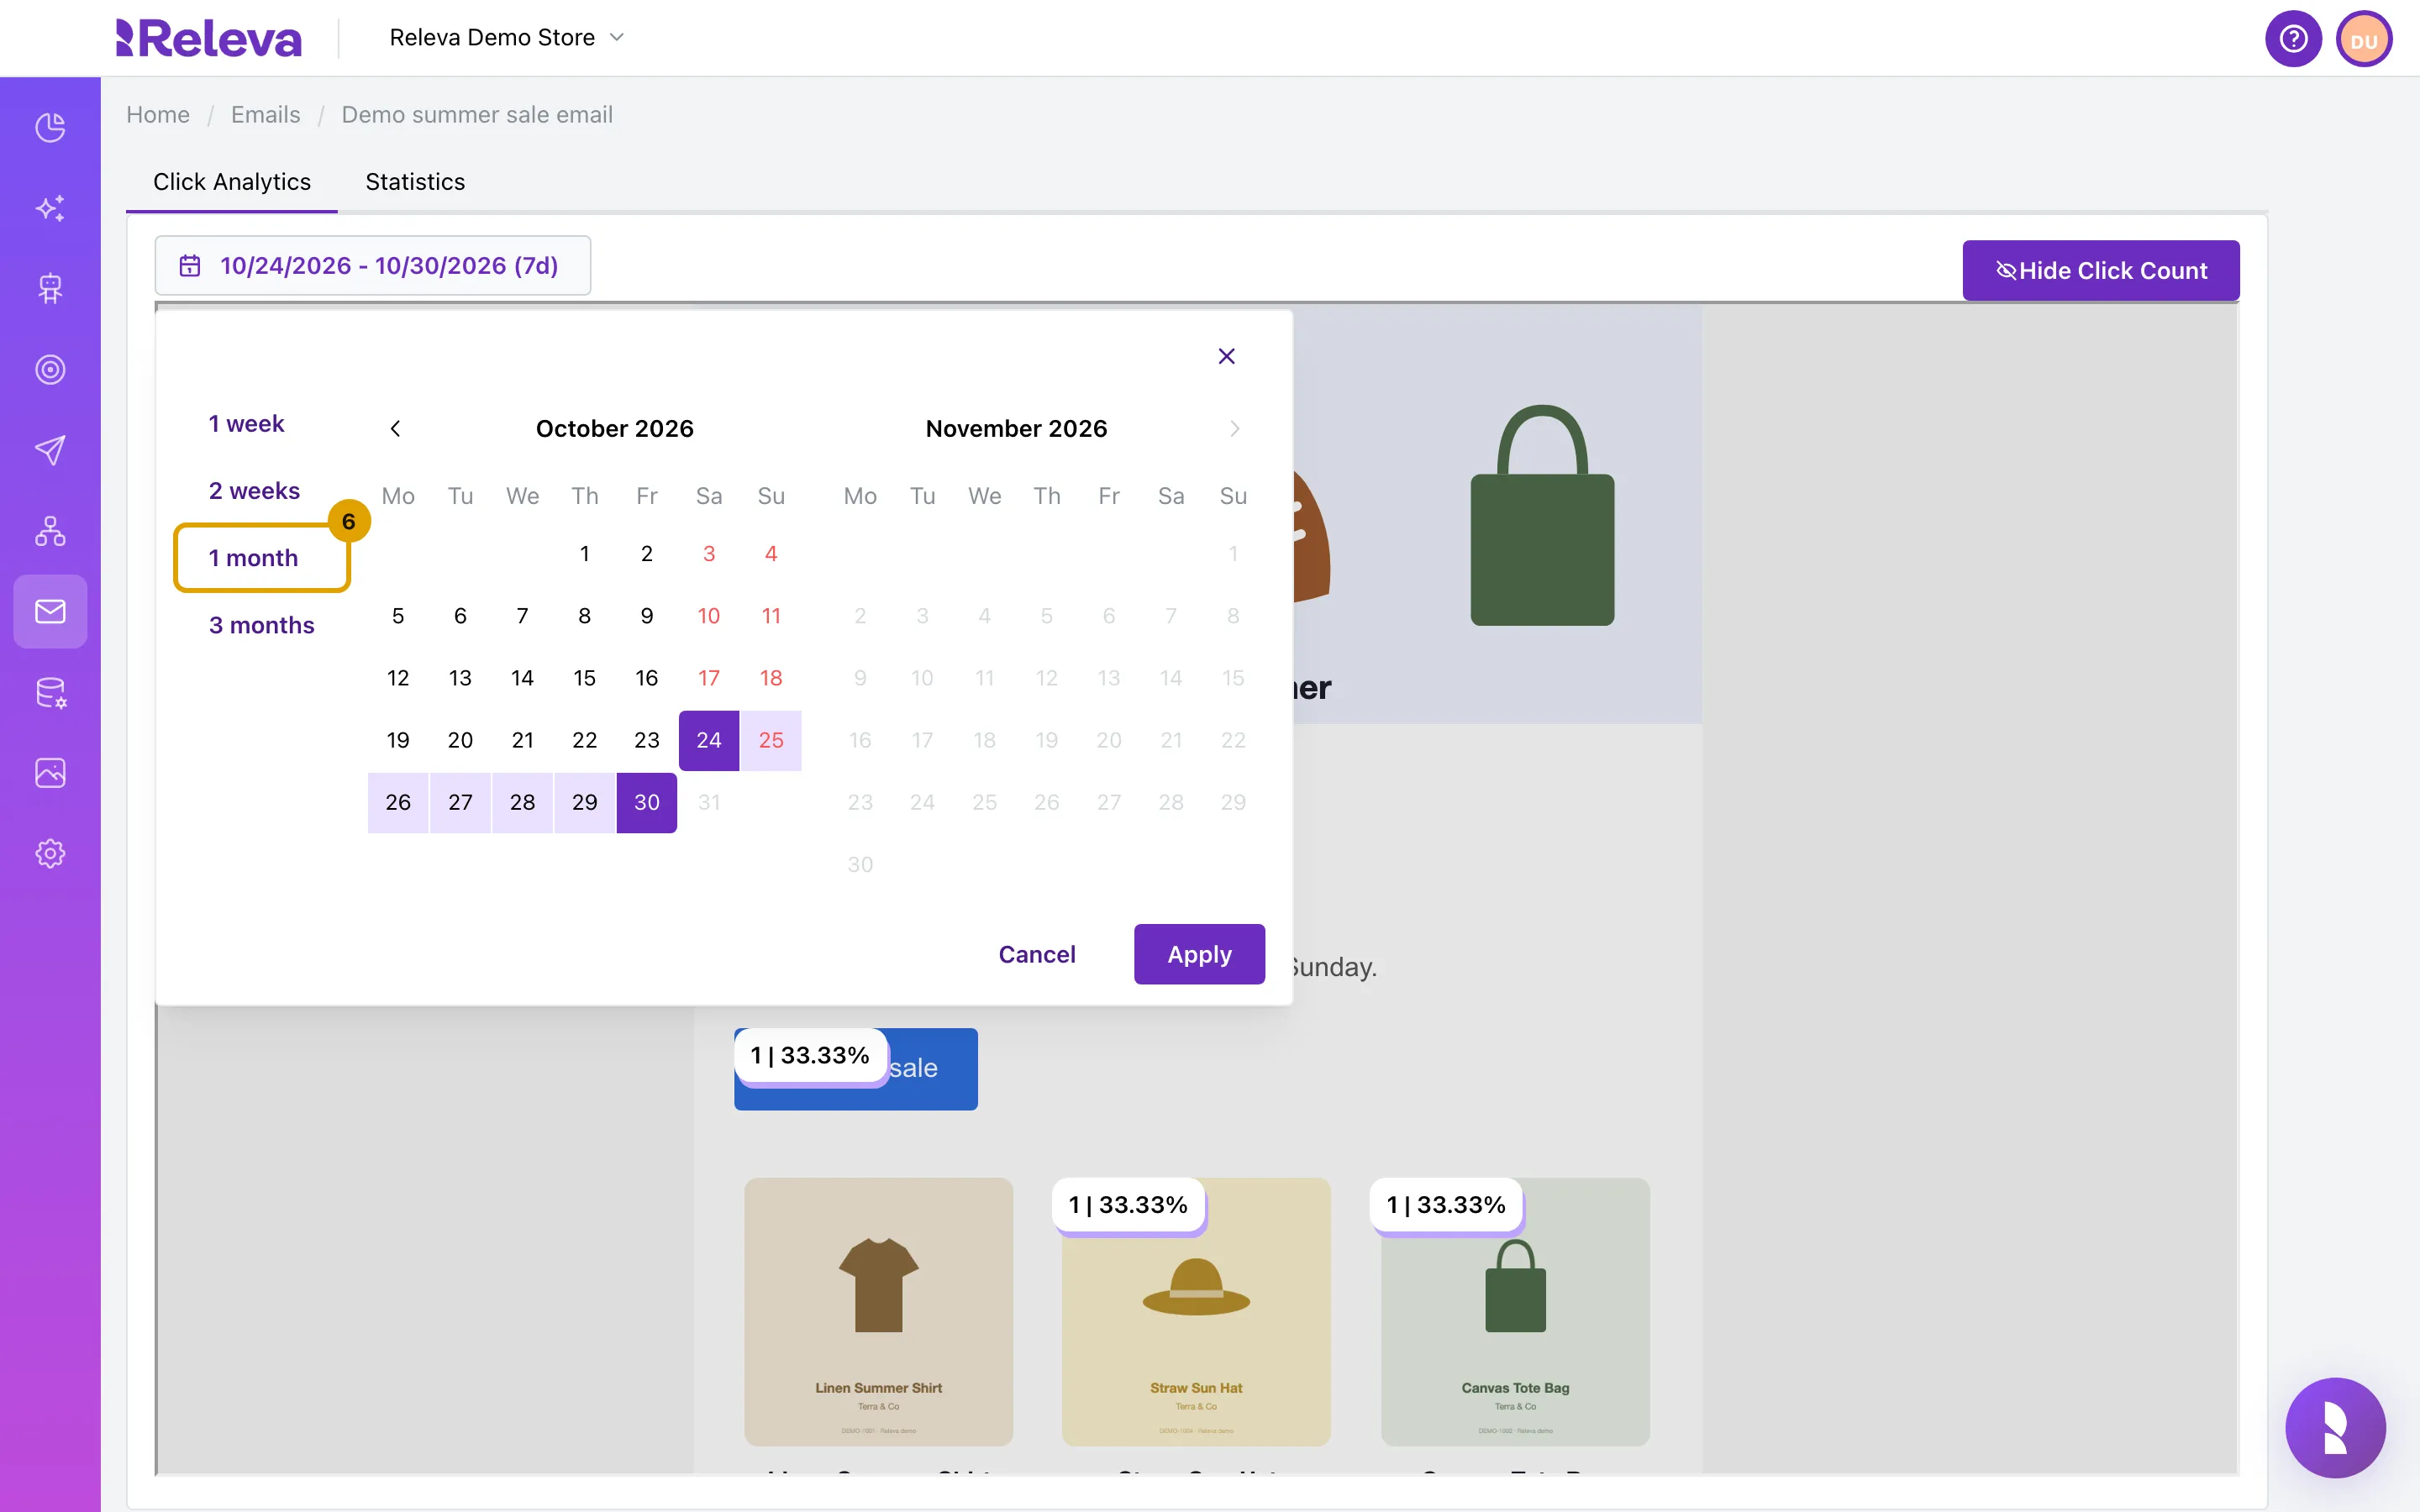
Pick a preset such as 1 month, or select a start and end day in the calendar and select Apply
A preset applies at once. Apply stays disabled until you have picked an end day.
-
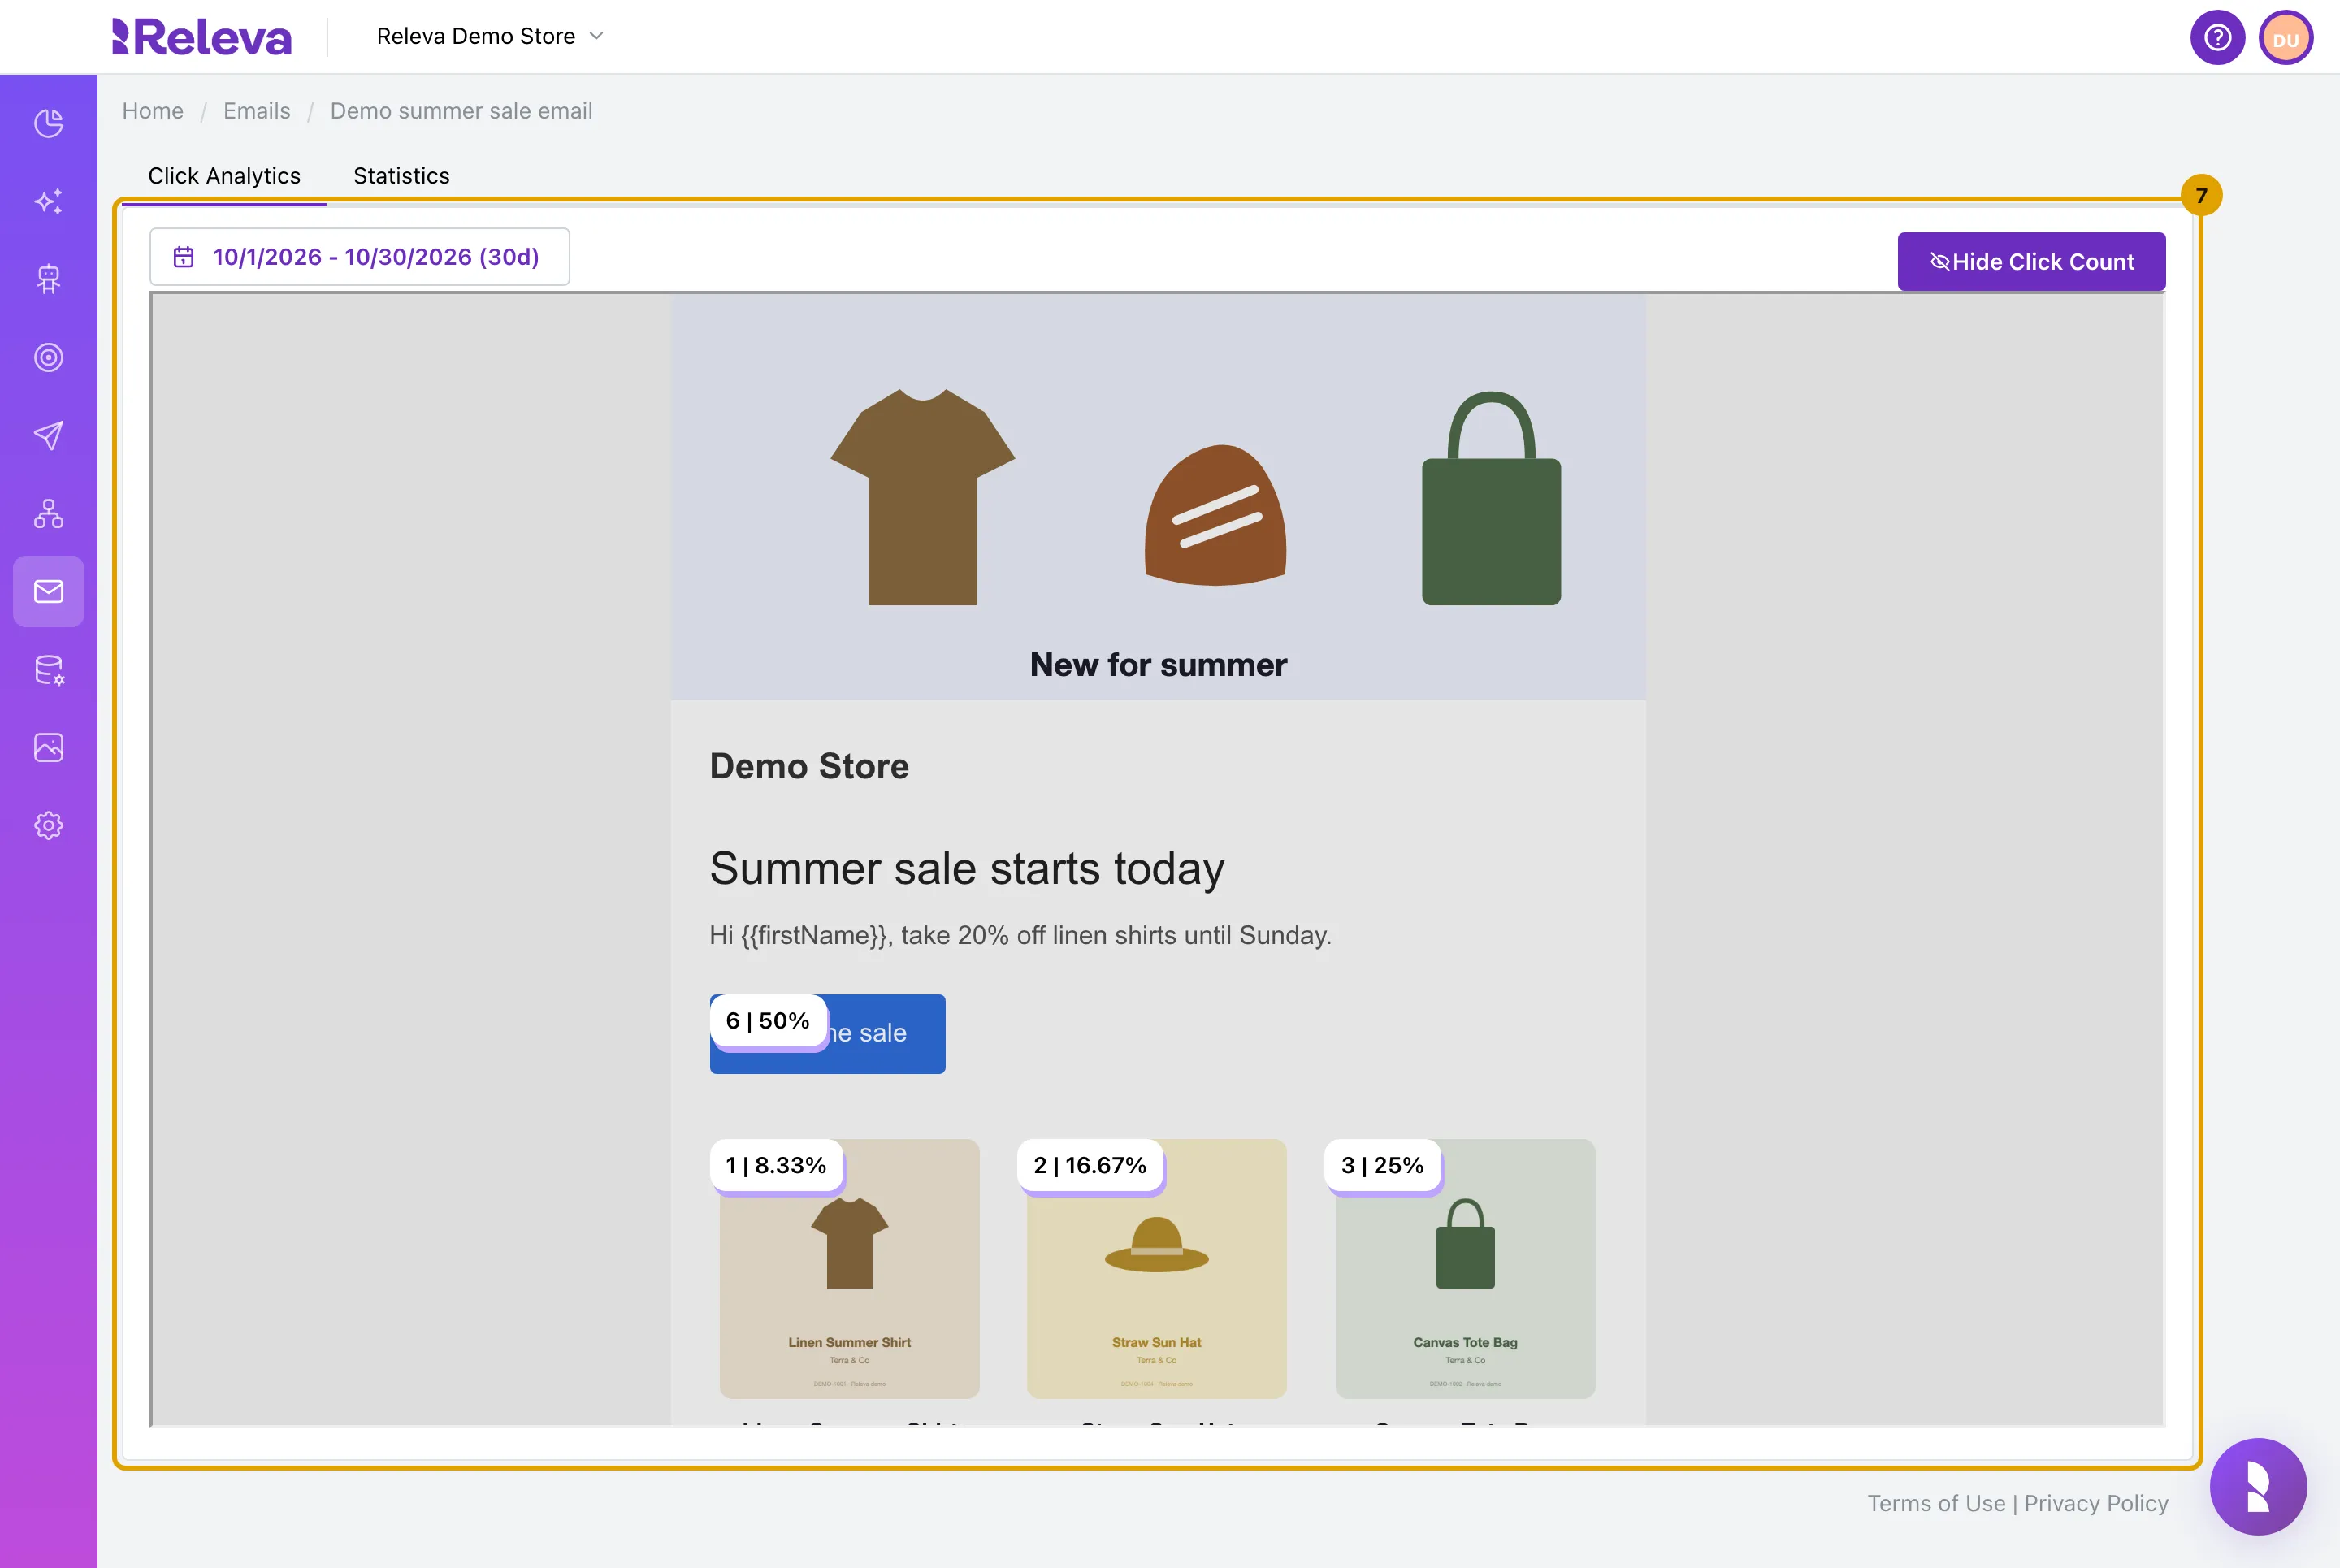
Read the labels on the email. Each tracked link shows its number of clicks and its share of all clicks in the period, for example 6 | 50%
Links nobody clicked have no label. In a product block, every product position gets its own label. When nobody clicked in the period, you see “No click analytics available for this email for the selected period.”
-
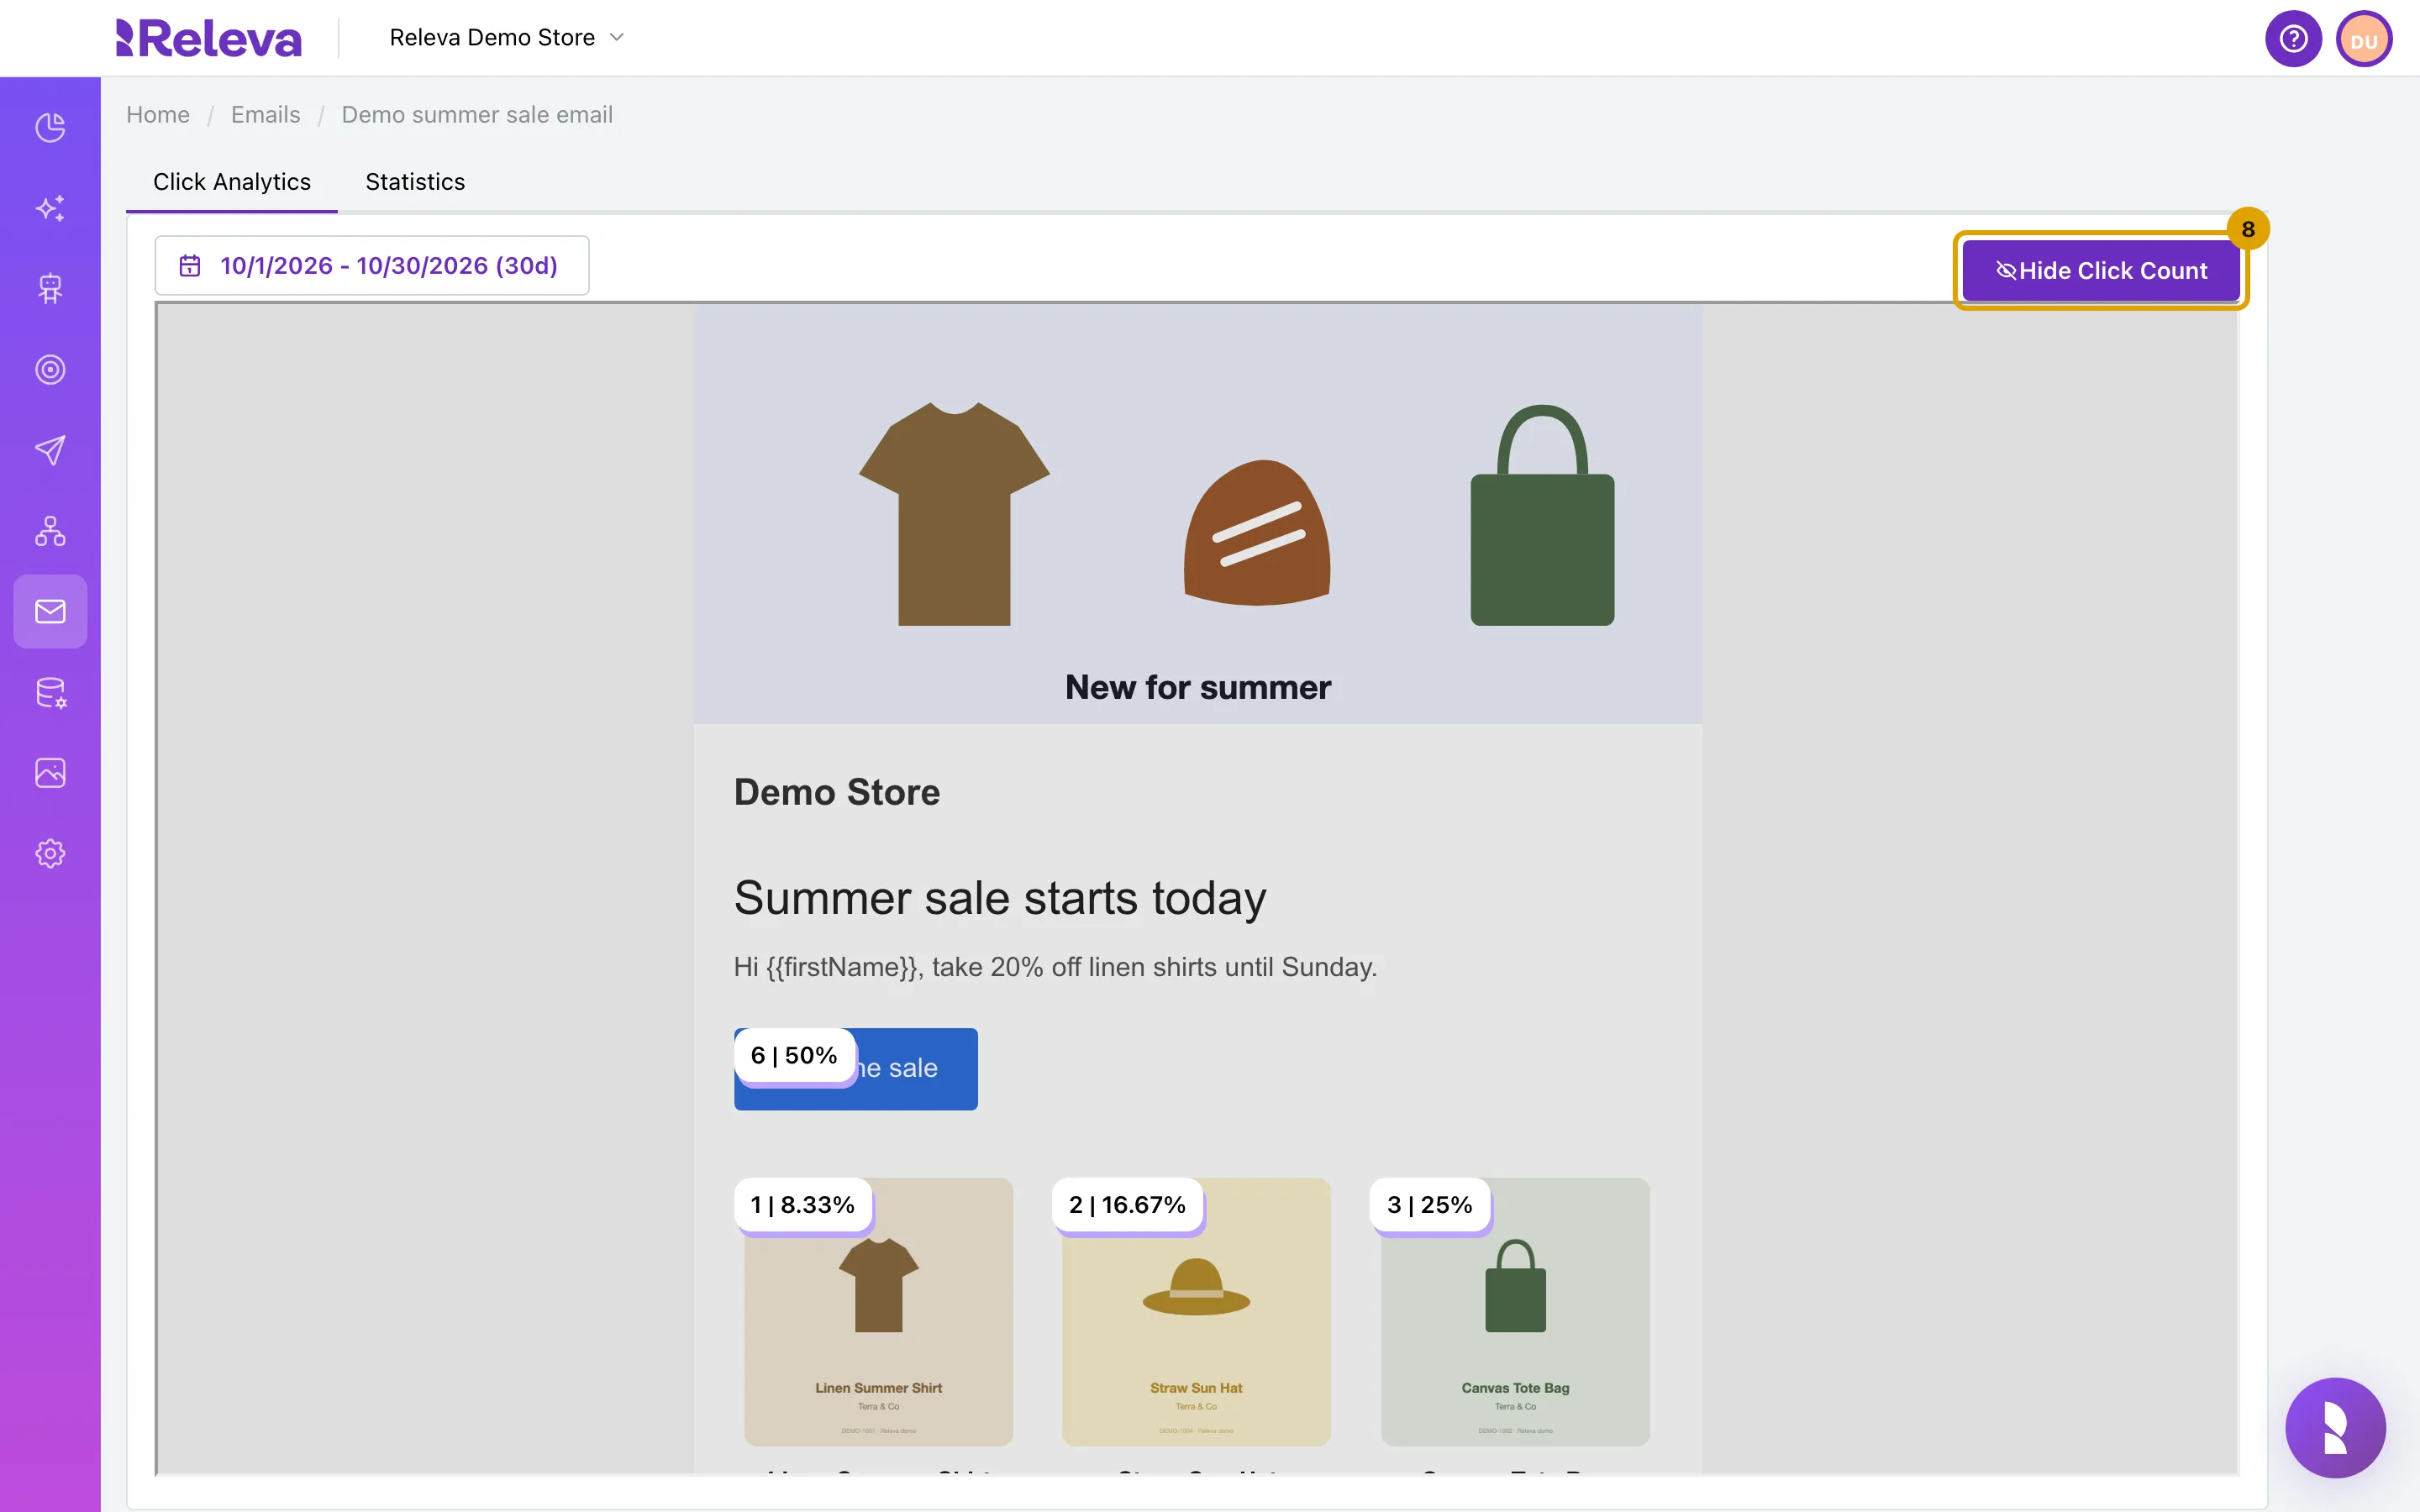
Select Hide Click Count to see the email without the labels
-
Select the Statistics tab
While the labels are hidden, the button reads Show Click Count. Select it to bring the labels back.
-
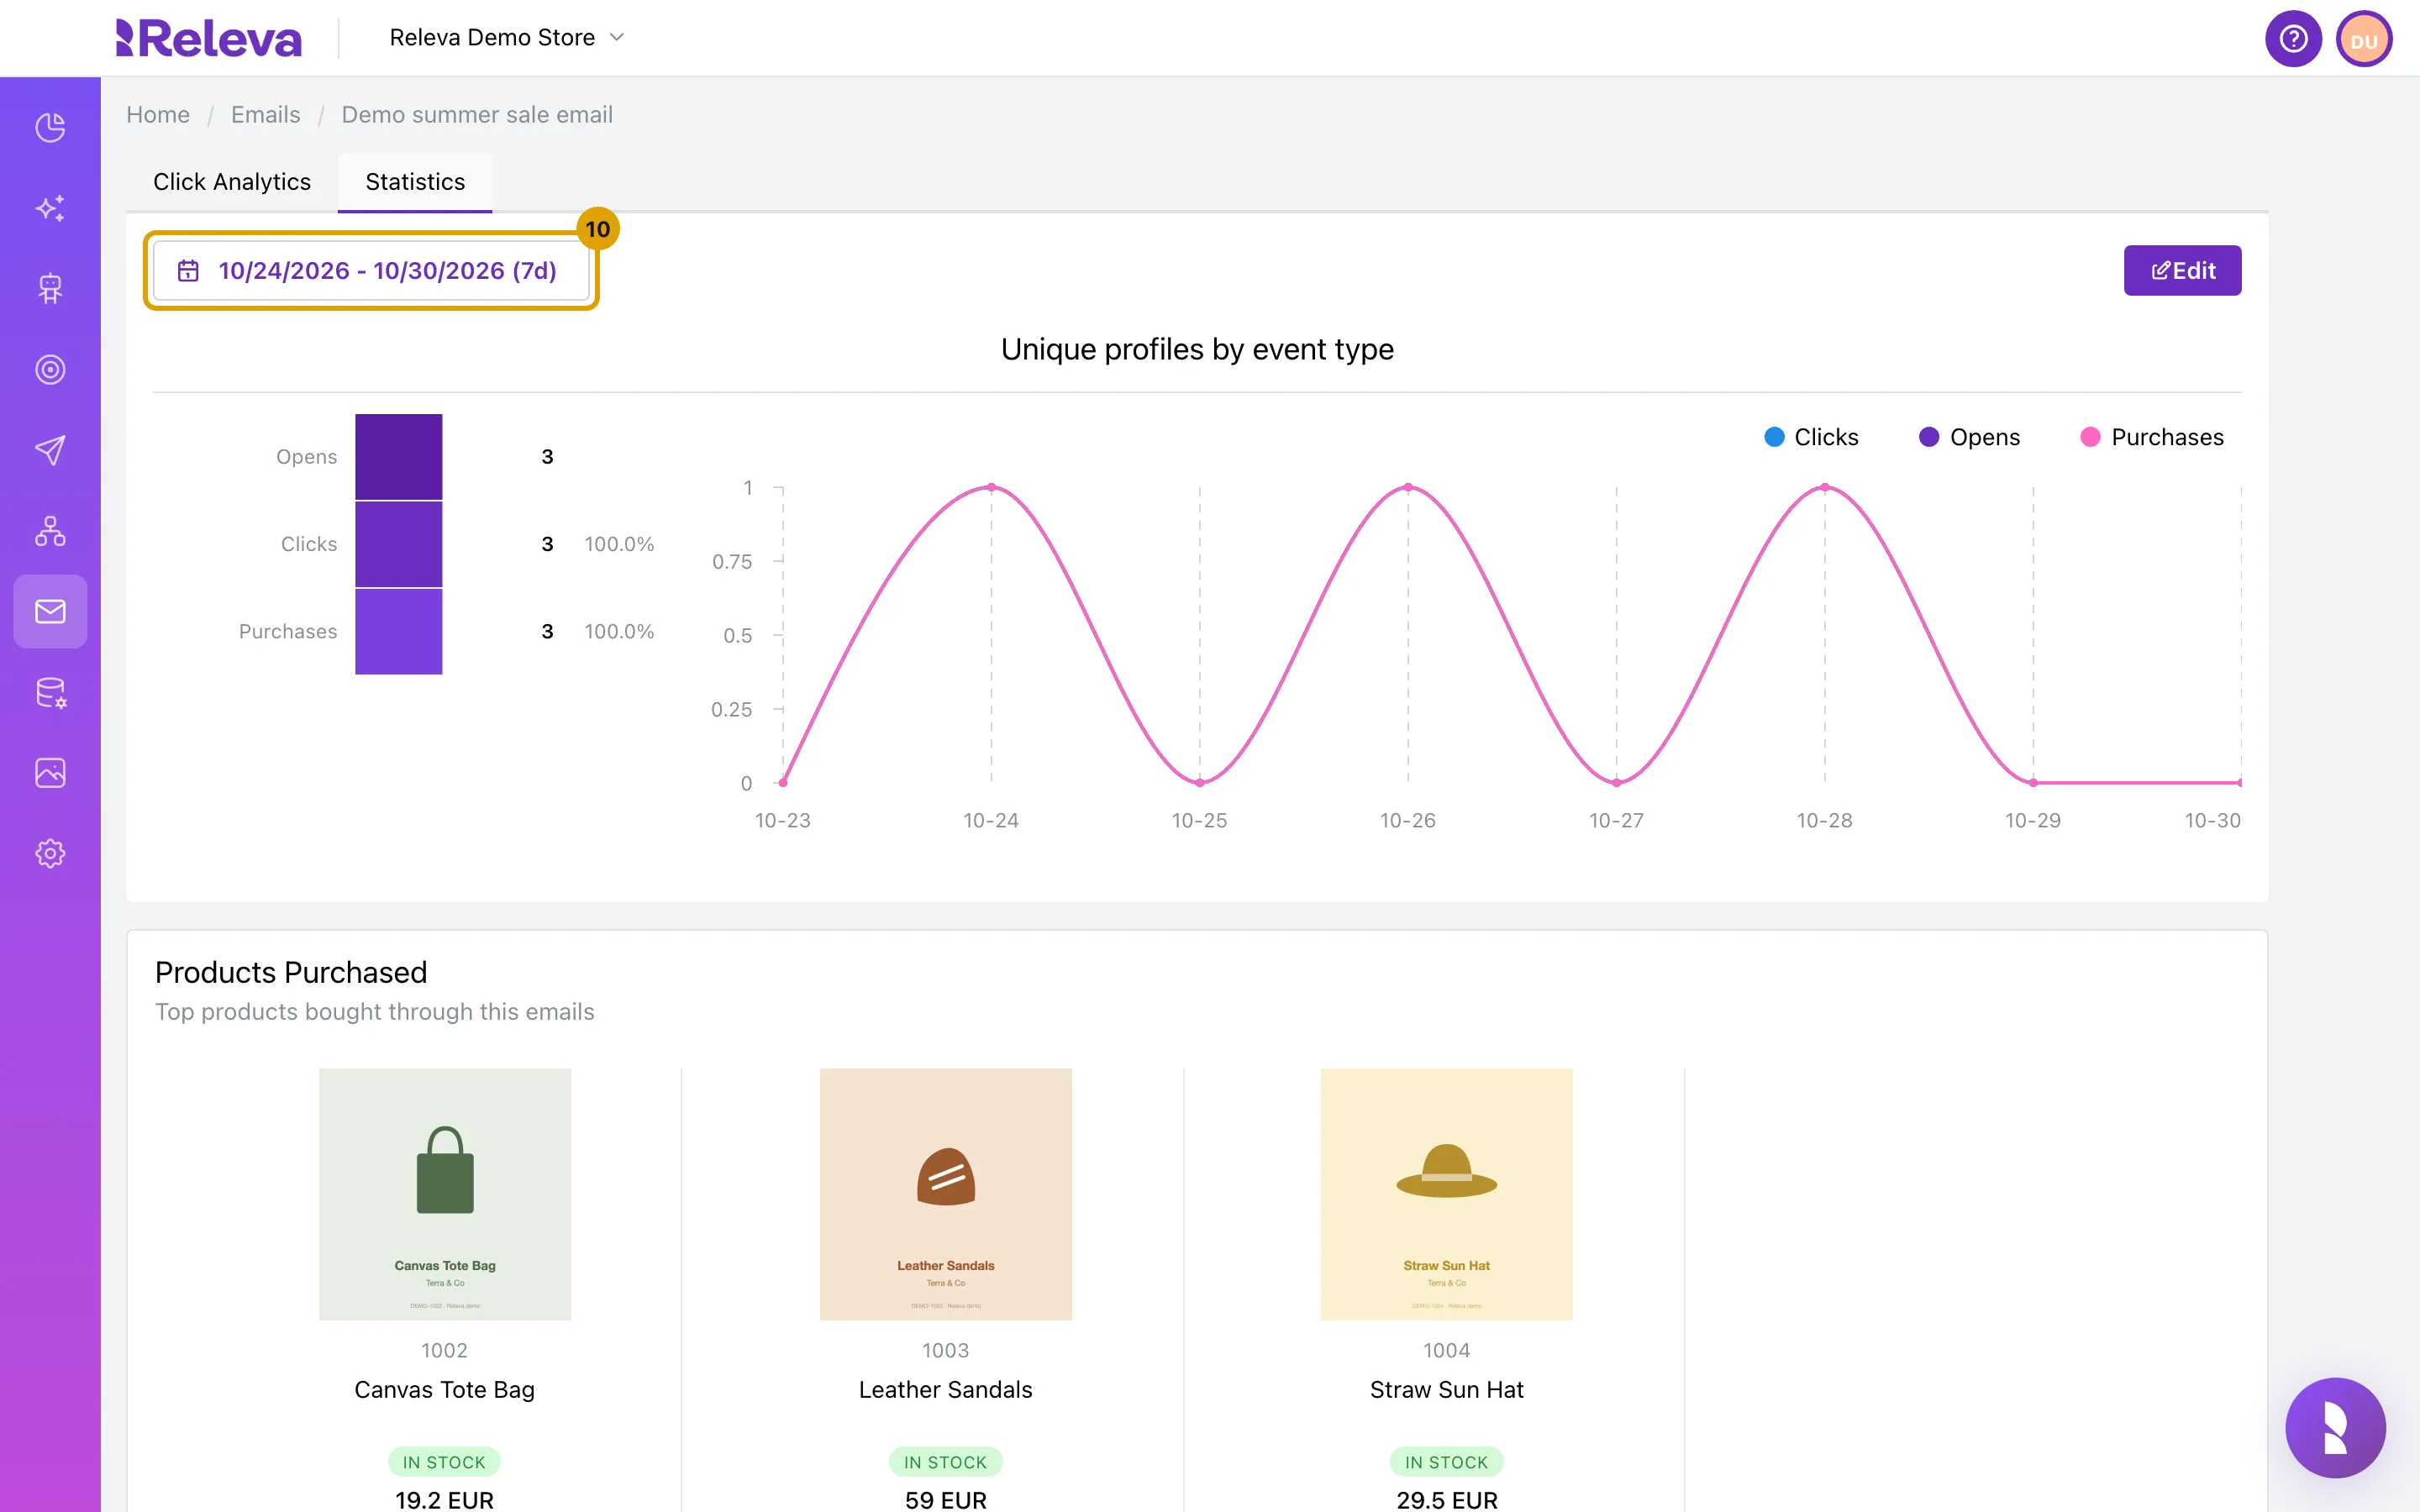
This tab has its own date range, which starts at the last 7 days again. Select the date range and set the period you want, for example 1 month
-
Read the results for the period
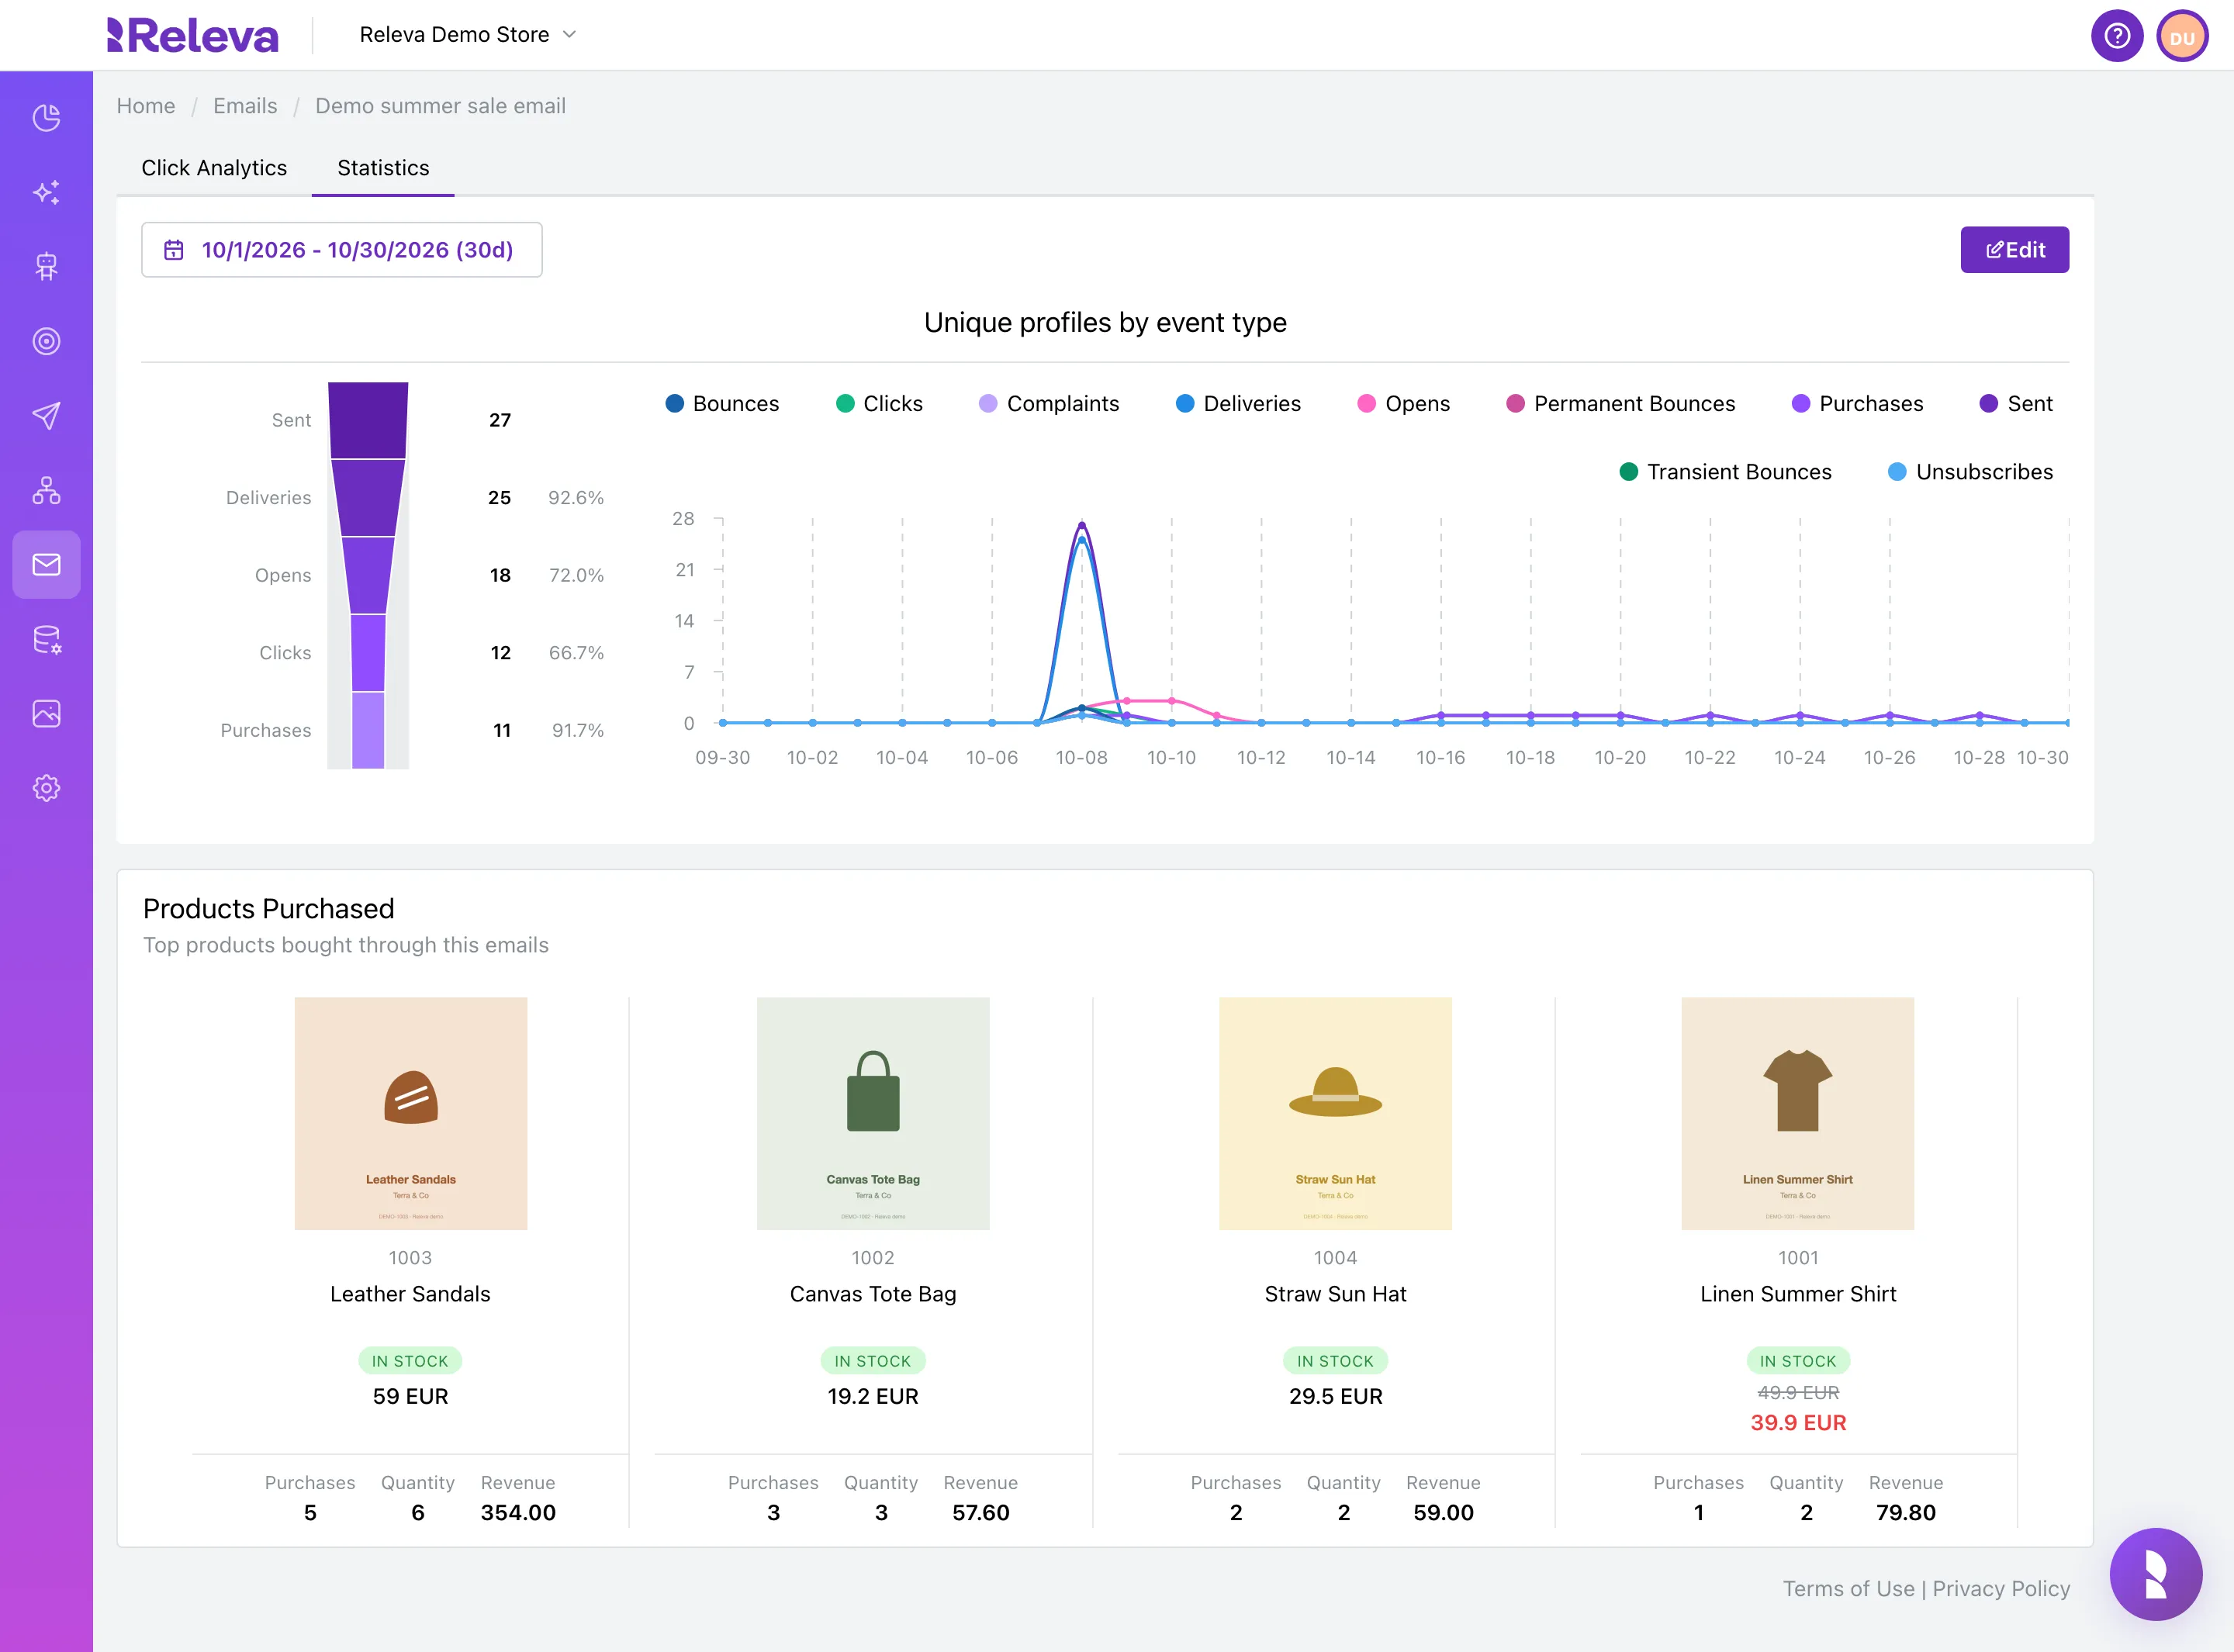
- The funnel on the left goes from Sent through Deliveries, Opens and Clicks to Purchases. Each percentage is of the stage before it, not of Sent. So Opens is a share of Deliveries here, while Opened on the card is a share of Sent.
- The chart Unique profiles by event type shows, per day, how many people had each event: sends, deliveries, opens, clicks, purchases, bounces (also split into permanent and transient), complaints and unsubscribes.
- Products Purchased lists the top products bought through this email, with Purchases, Quantity and Revenue for each.
- Edit opens the email in the editor.
With no sends in the period, the tab reads “No data available for the selected period”.
Check it worked
Section titled “Check it worked”- The breadcrumb reads Home / Emails / <email name> and the browser tab reads Releva | Emails | <email name>.
- The date range button shows the period you picked, for example (30d).
- On Statistics, the chart is titled Unique profiles by event type when the email has sends in the period.
Troubleshooting
Section titled “Troubleshooting”No click analytics available for this email for the selected period. Nobody clicked a tracked link in the period. Widen the period. If the email has had clicks for a long time and still shows nothing, it may have been saved before click tracking ids were added; open it, save it again, and clicks from the next send will be tracked.
No data available for the selected period. No sending events in the period on the Statistics tab. Note that this tab does not keep the period you set on Click Analytics: it starts at the last 7 days every time you open it. Set the period again here.
Error loading email content: An internal error occurred. The email id in the address bar does not belong to this shop, or the email was deleted. Go back to Marketing Channels › Emails and open the email from its card.
Breadcrumb reads Unnamed email. Same cause: the email could not be loaded for this shop.
The numbers here differ from the card on the list. Three things differ:
- Period: the list card uses the period set on the list (30 days by default); each tab on the Statistics page has its own period (7 days by default). Set the same period in each place to compare.
- Percentages: on the card, Delivered and Opened are shares of Sent, Clicks of Opened and Purchases of Clicks. In the funnel, each percentage is of the stage before it. The same email can show Opened 66.7% on the card and Opens 72.0% in the funnel.
- What is counted: the Statistics tab counts unique profiles, so a person who opened the email three times counts once.
Bounces or Complaints are high. Many bounces usually mean outdated or invalid addresses on your list; complaints mean recipients marked the email as spam. Clean your list and send only to people who agreed to receive marketing. If bounces keep growing, Releva may pause sending: see Alerts on the Emails list. To see who bounced or complained, use the people icon on the tile (step 3).