

Check how a product feed performs
Every product feed collects the clicks and purchases that came through the Product Blocks and messages that use it. Use this page to see which feeds bring revenue, which products people buy through them, and to find the feed’s edit form.
Before you start
Section titled “Before you start”- The feed is used by at least one Product Block, email or other channel, and that element has been live for some days. A feed that nothing uses shows zeros.
-
In the left menu, select Data Platform › Product Feeds
-
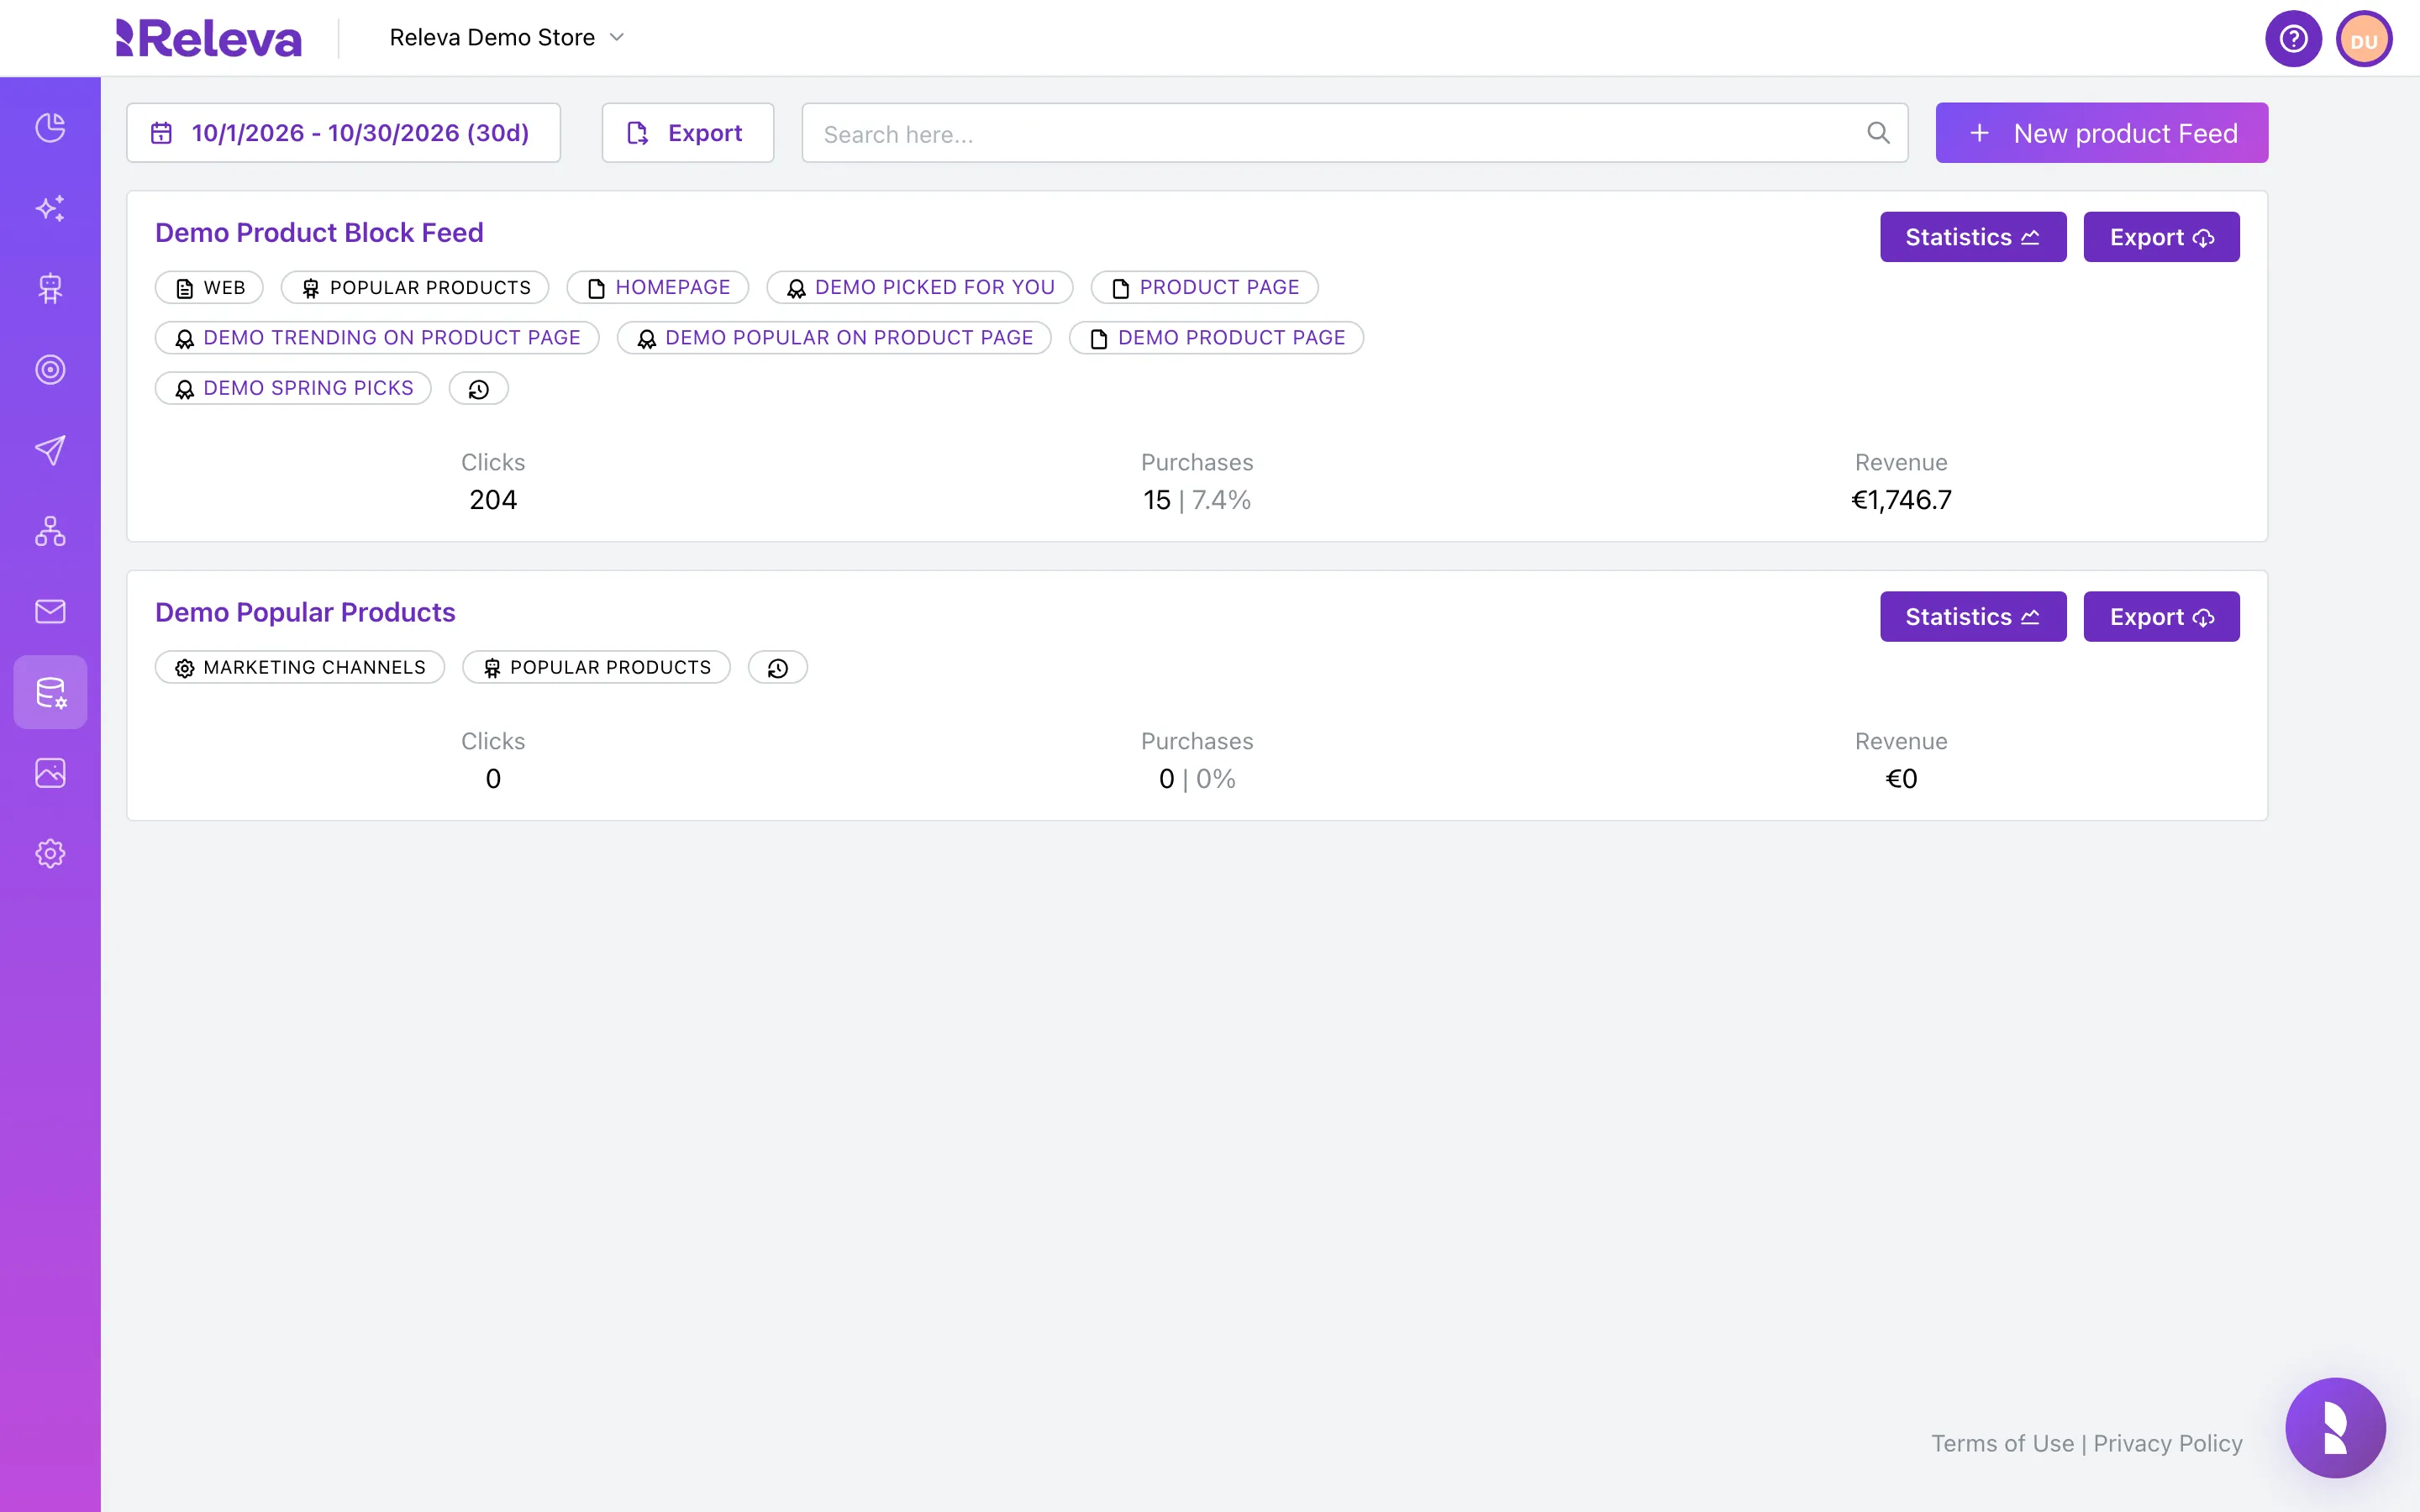
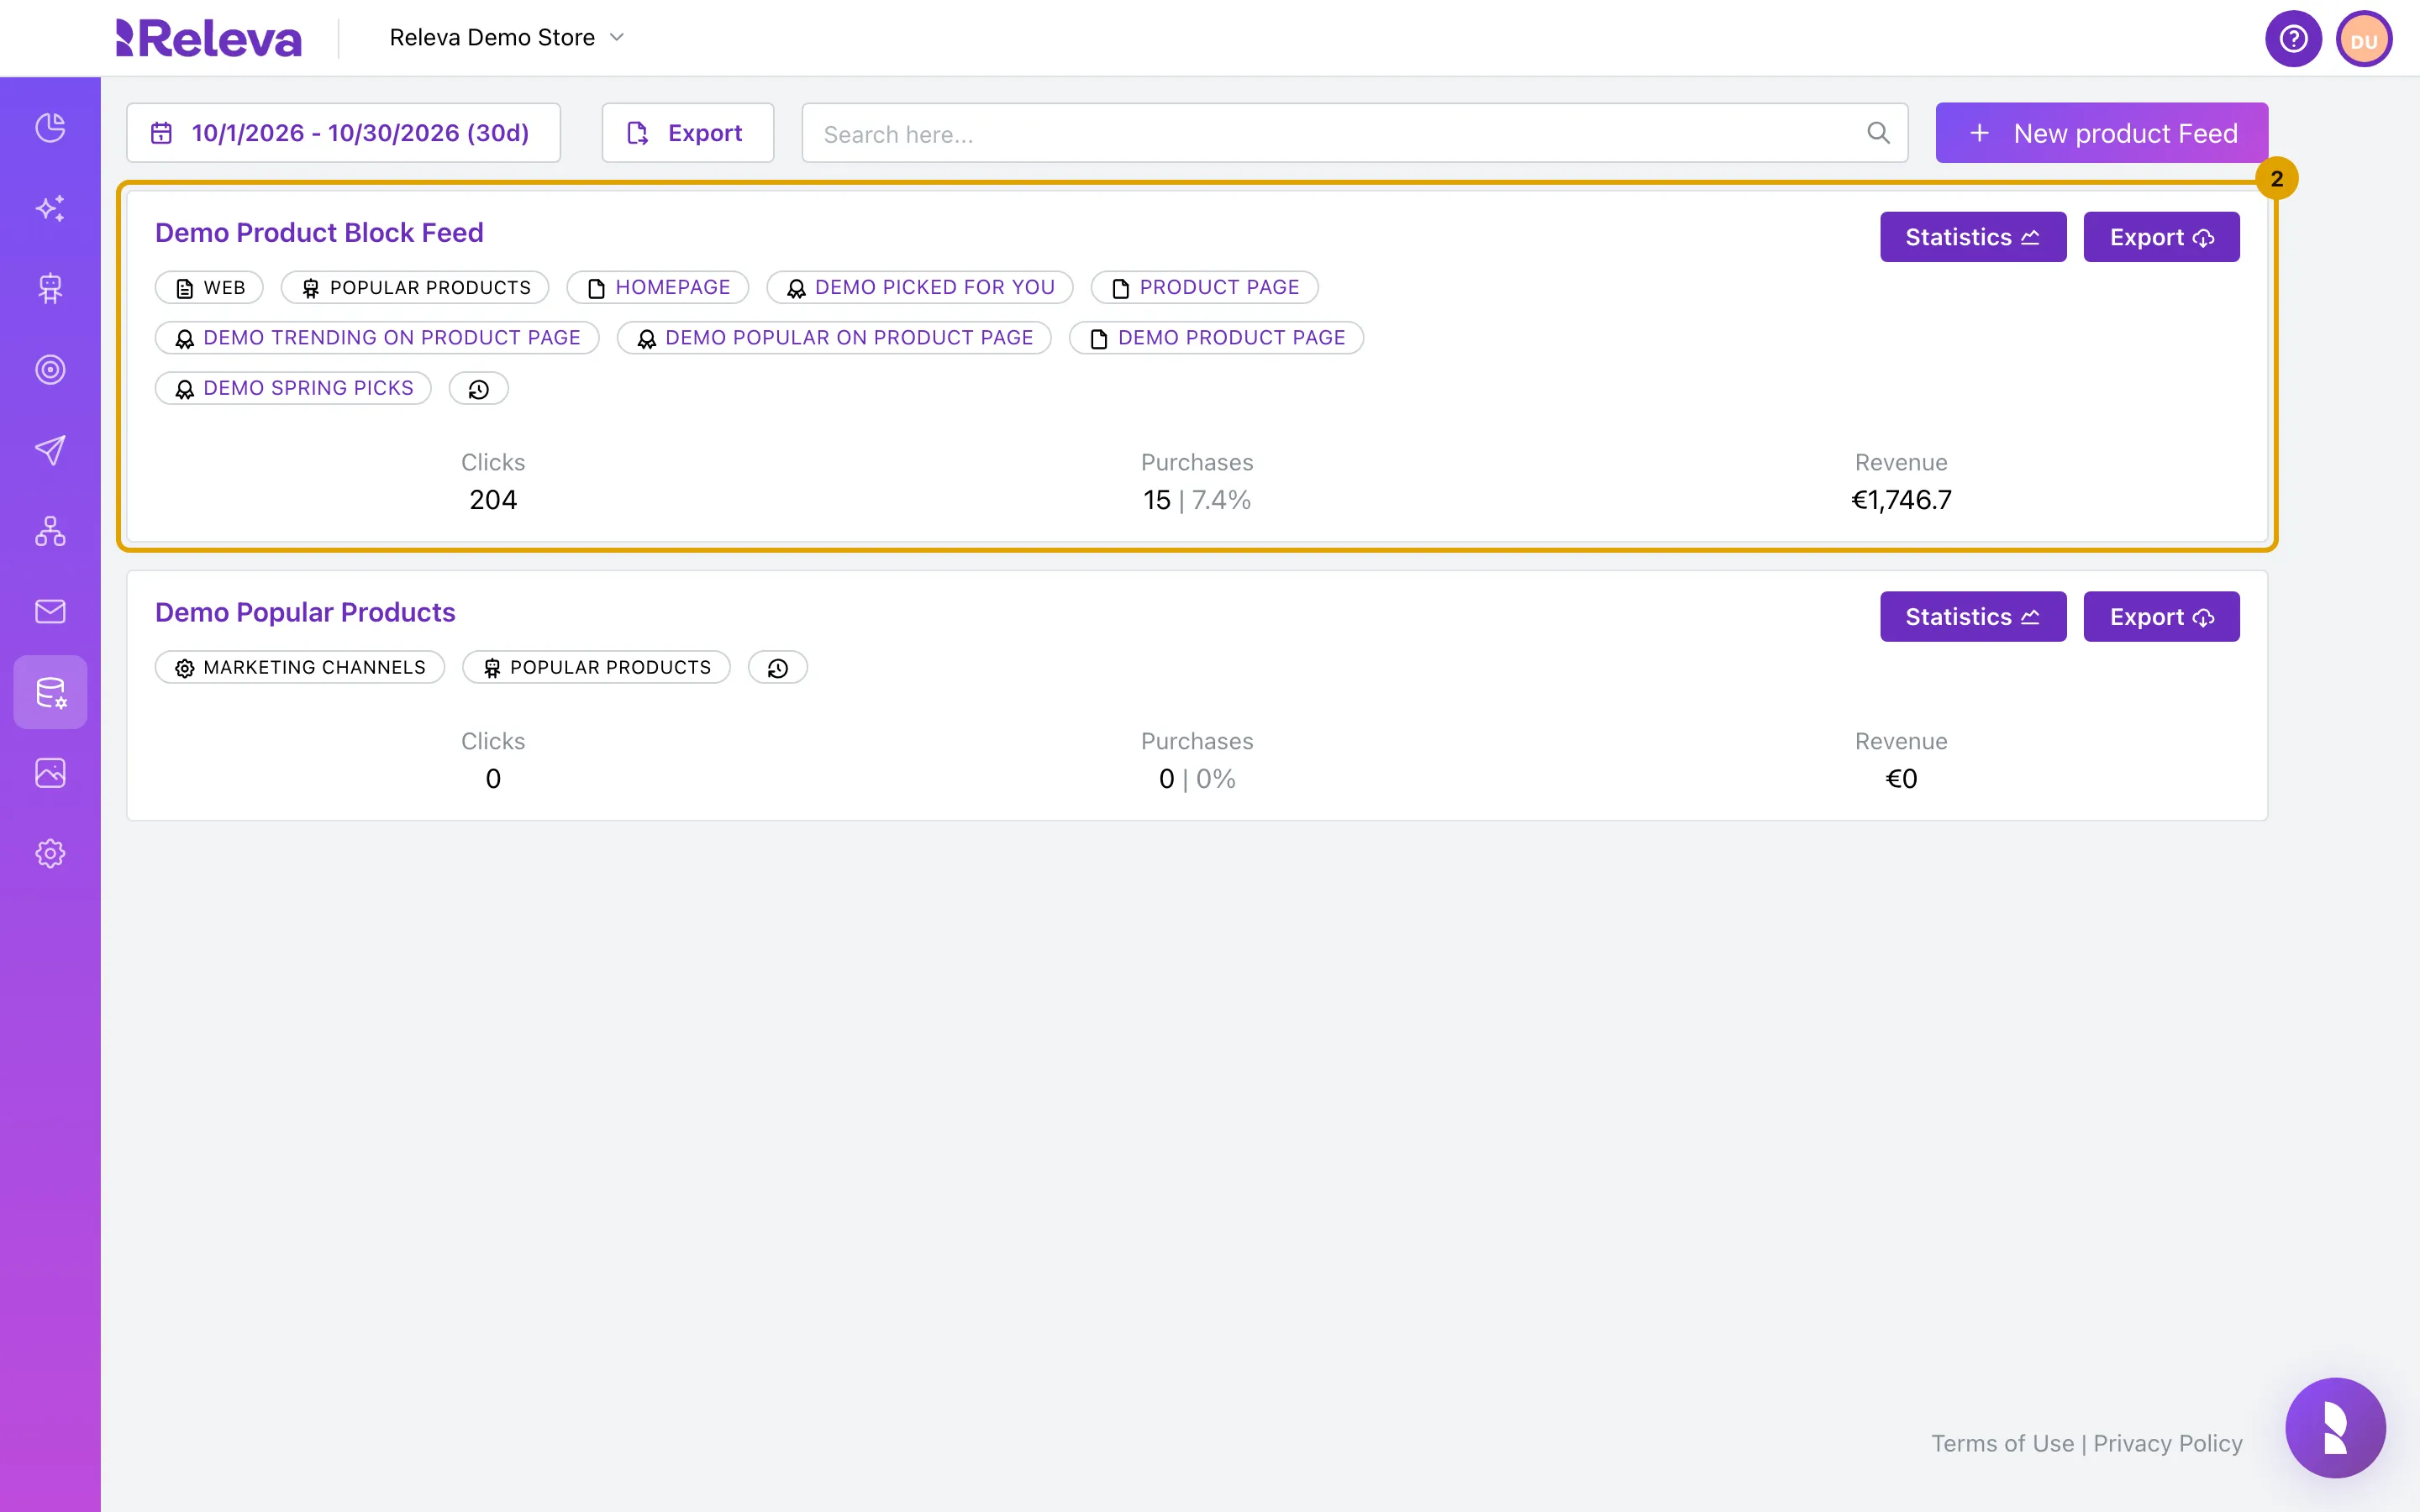
Each feed card shows Clicks, Purchases and Revenue for the period in the date picker at the top (the last 30 days by default)
Purchases also shows the purchases as a percentage of clicks. Revenue is in your shop’s currency. Badges on the card list the pages, Product Blocks, emails, Viber messages and push notifications that use the feed. Change the date range to compare periods; Export next to the date picker starts a report with the numbers of all feeds.
-
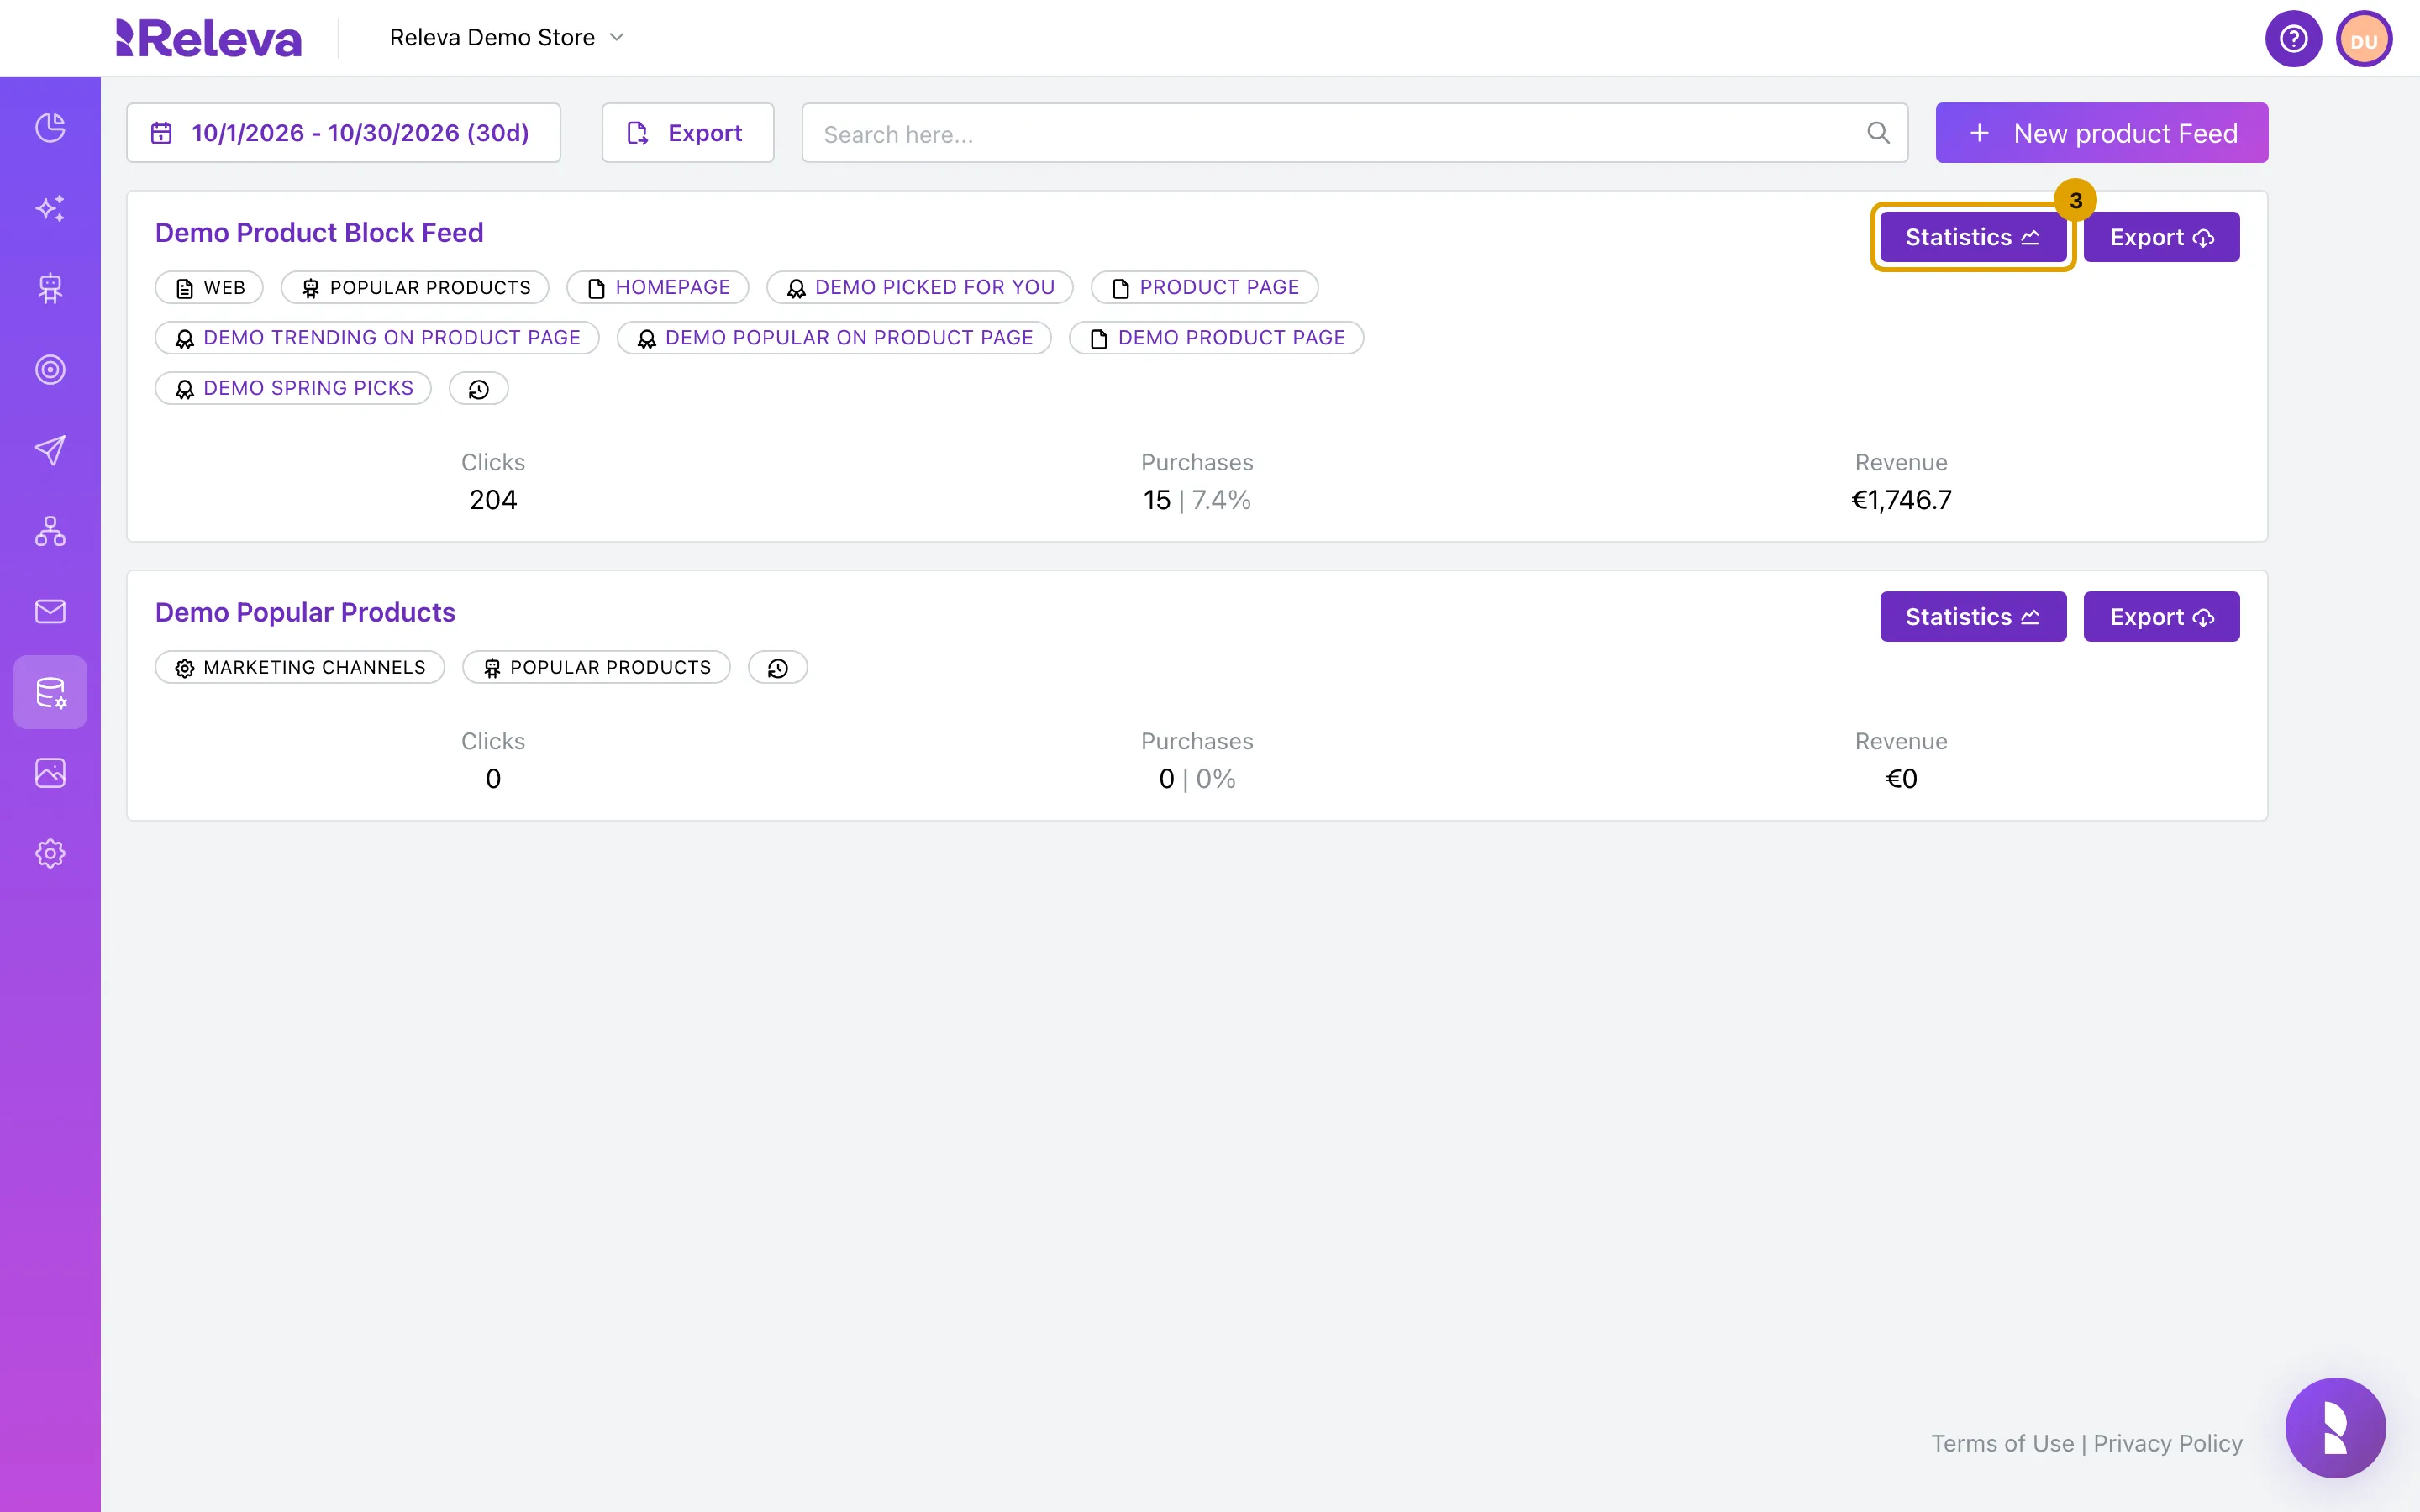
Select Statistics on the feed’s card
-
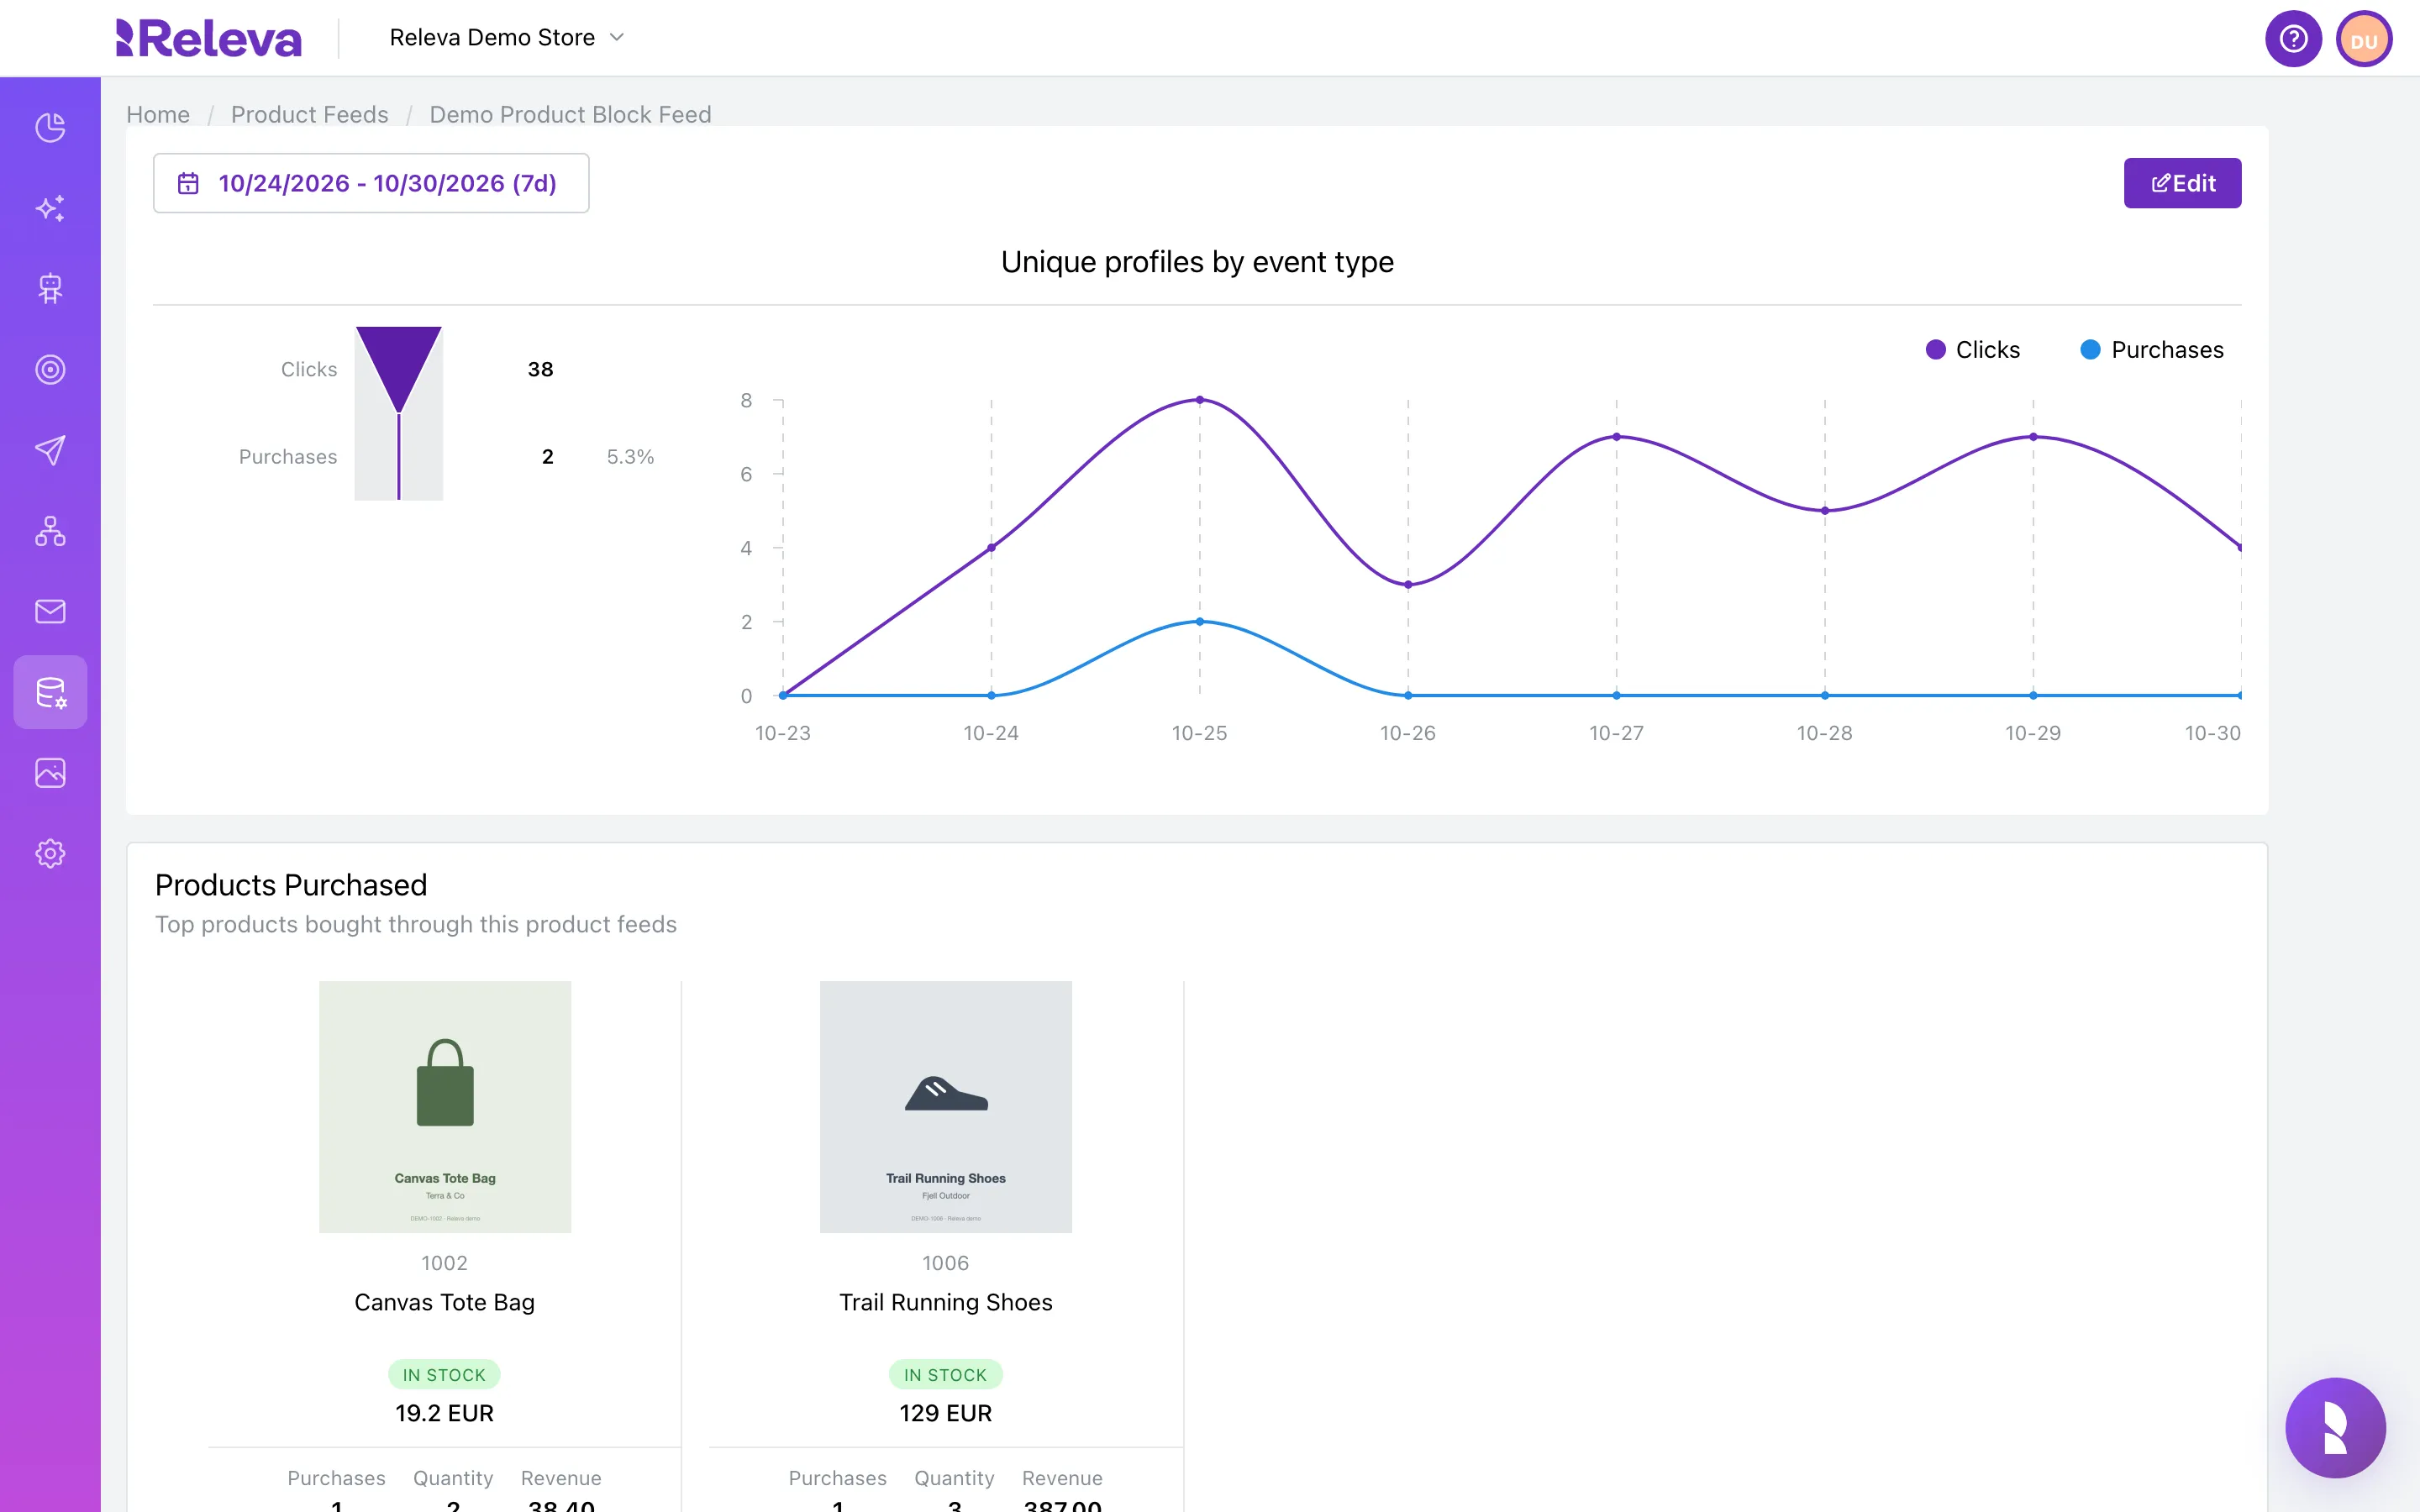
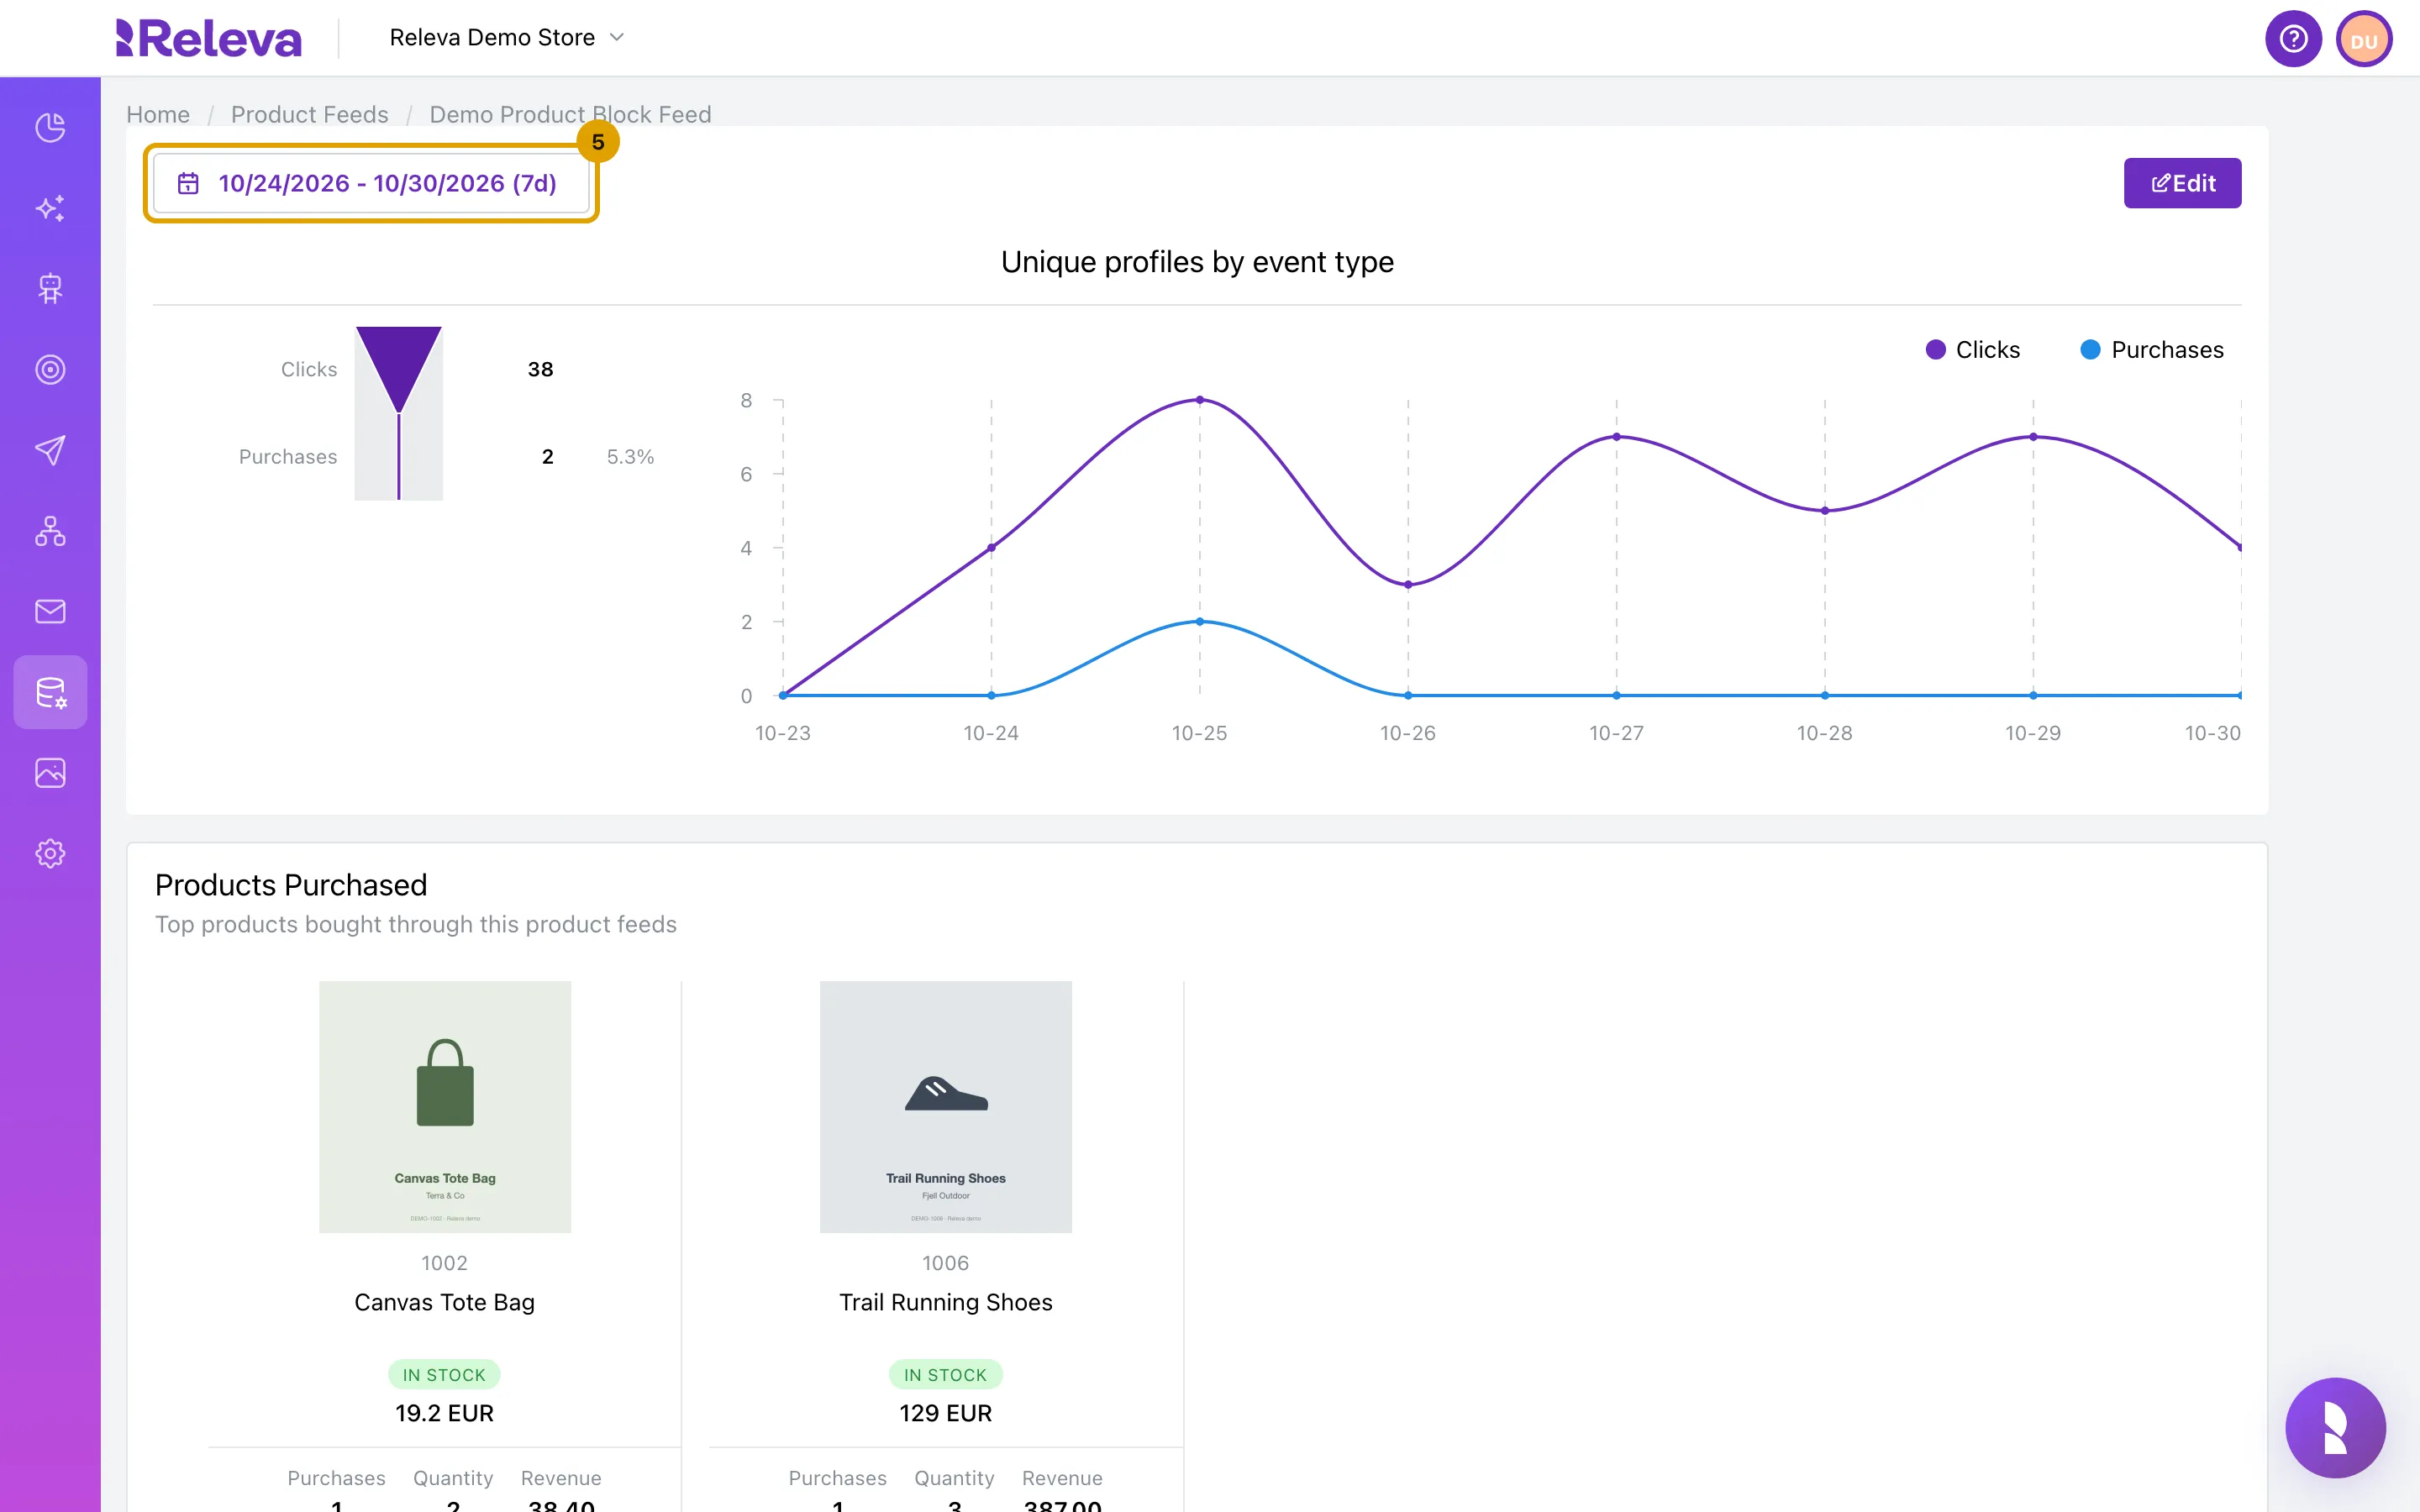
Read the Unique profiles by event type chart for the last 7 days
On the left, the funnel shows how many people clicked a product from the feed (Clicks) and how many bought one (Purchases), with the share that bought. On the right, one line per event shows the same numbers per day. The chart counts people, not events: a person who clicks three times counts once.
-
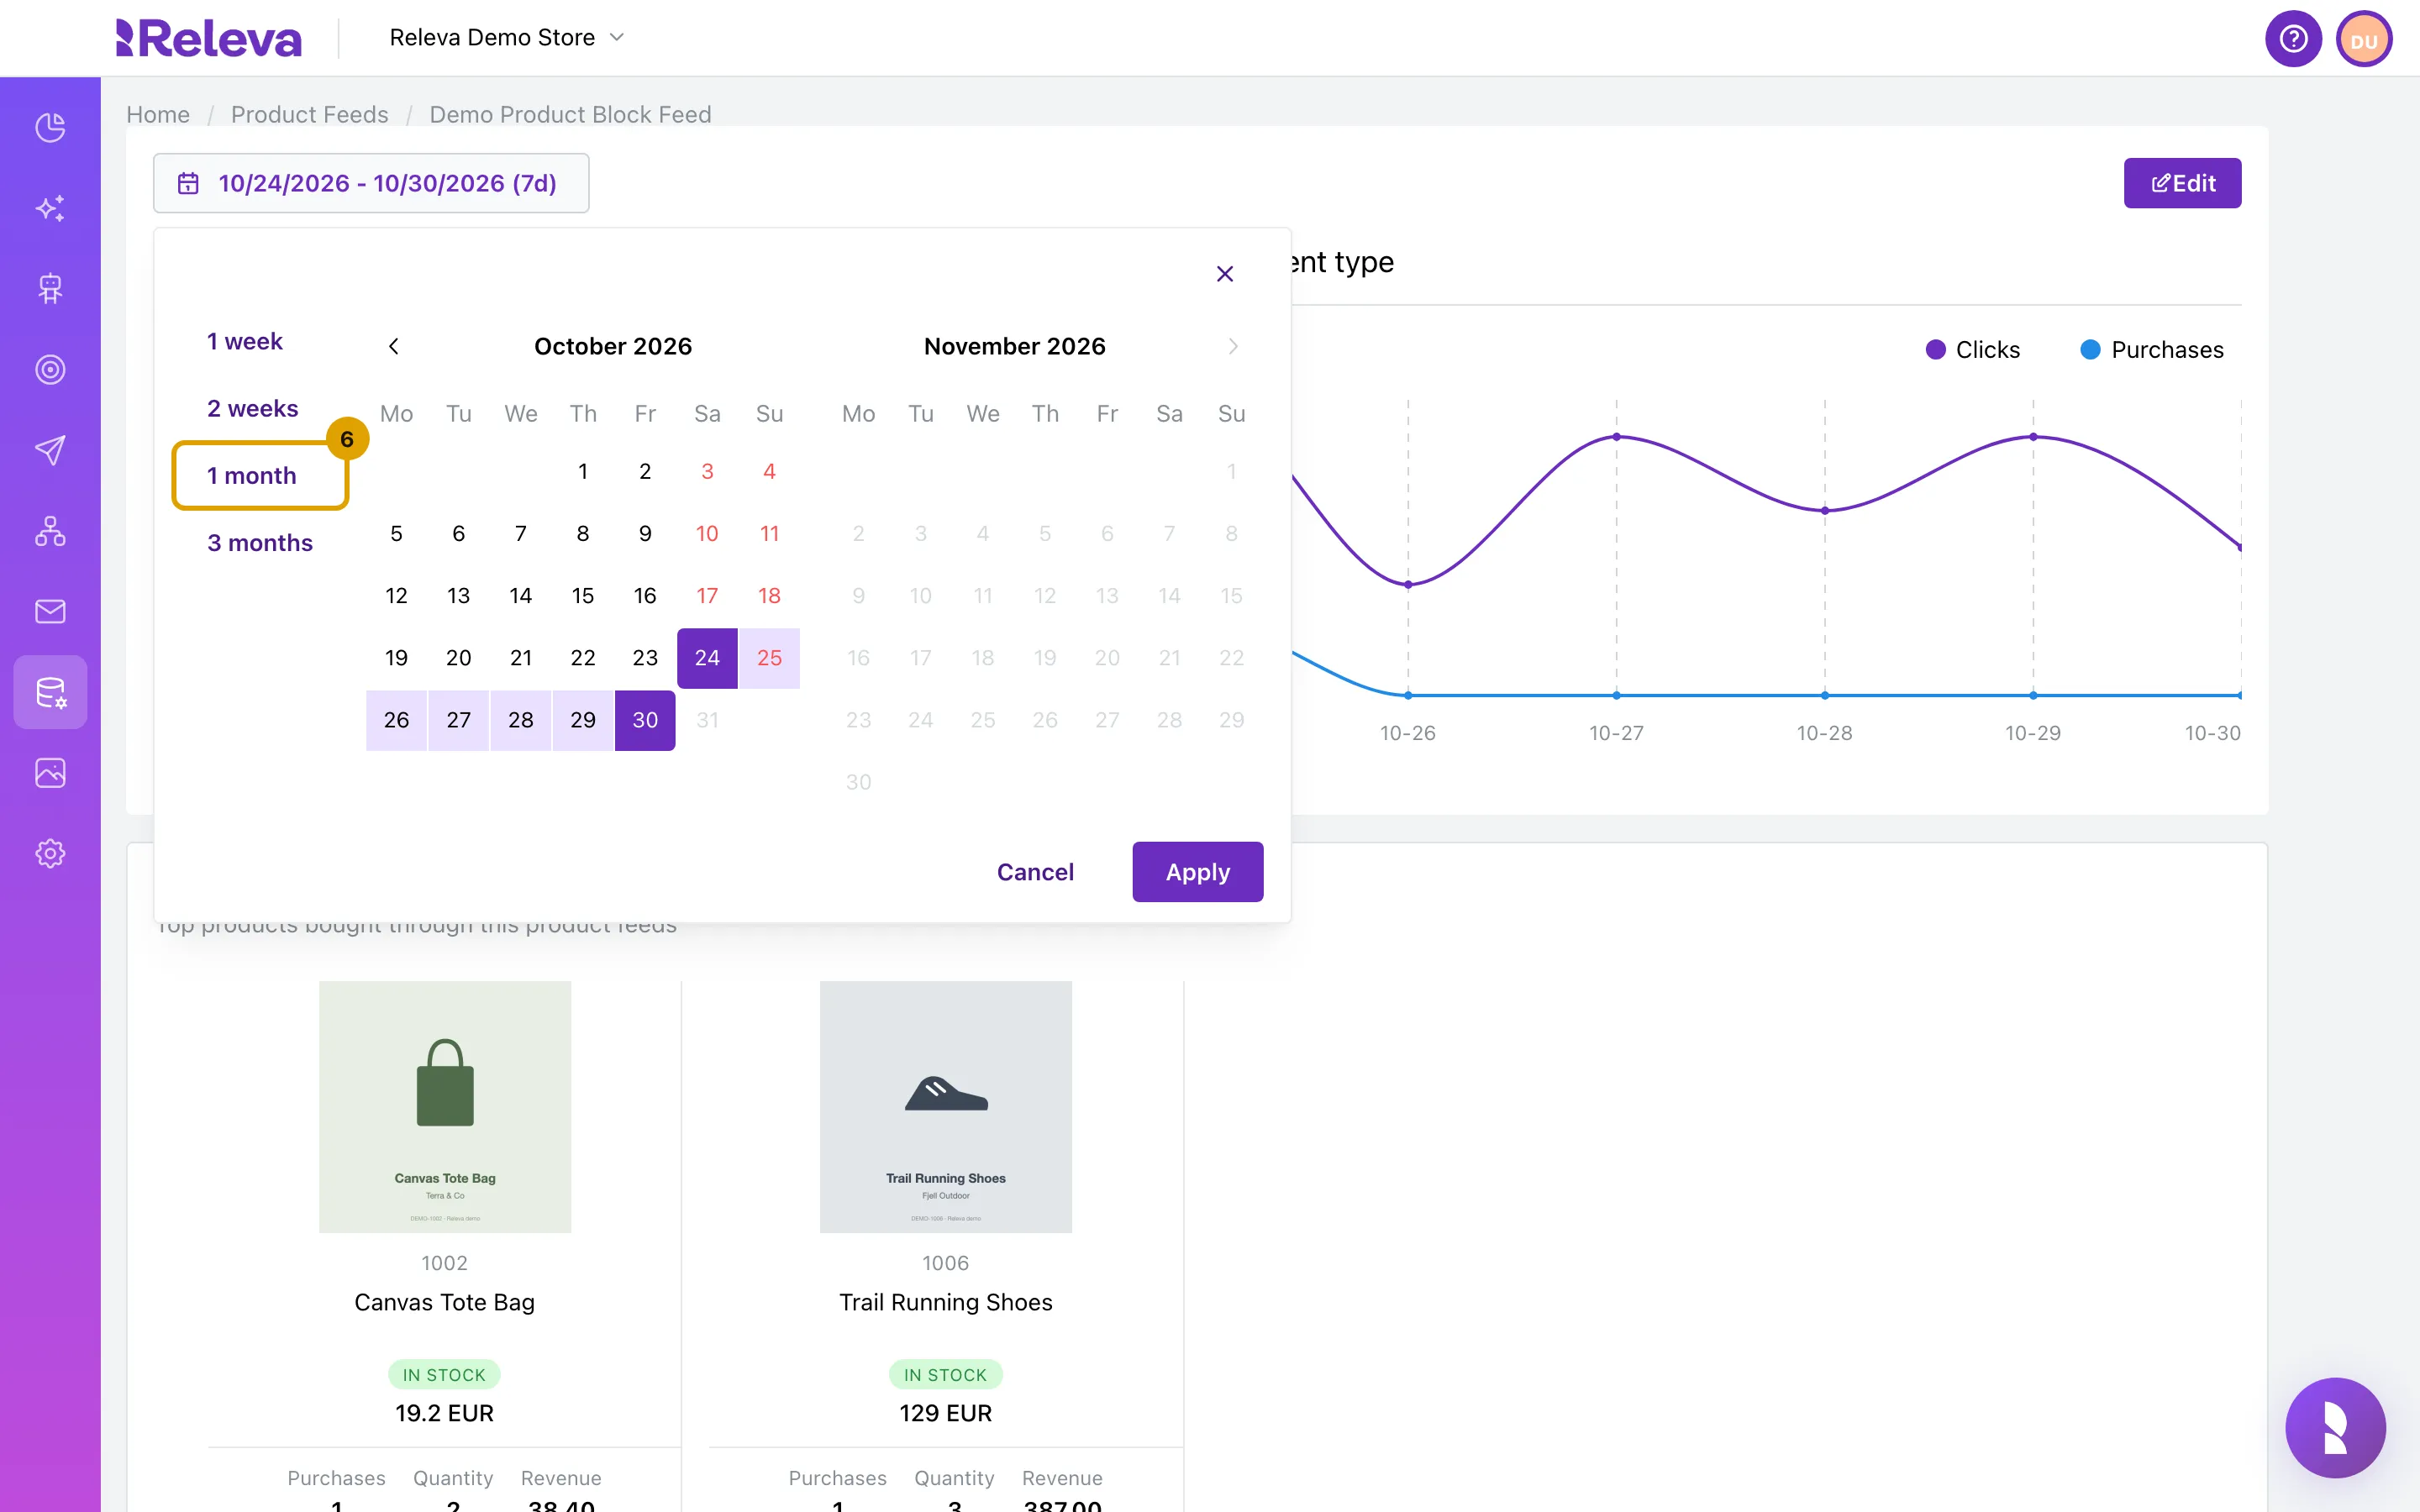
Select the date range to change the period
-
Select a preset such as 1 month, or select a start day and an end day in the calendar and select Apply
A preset applies at once.
-
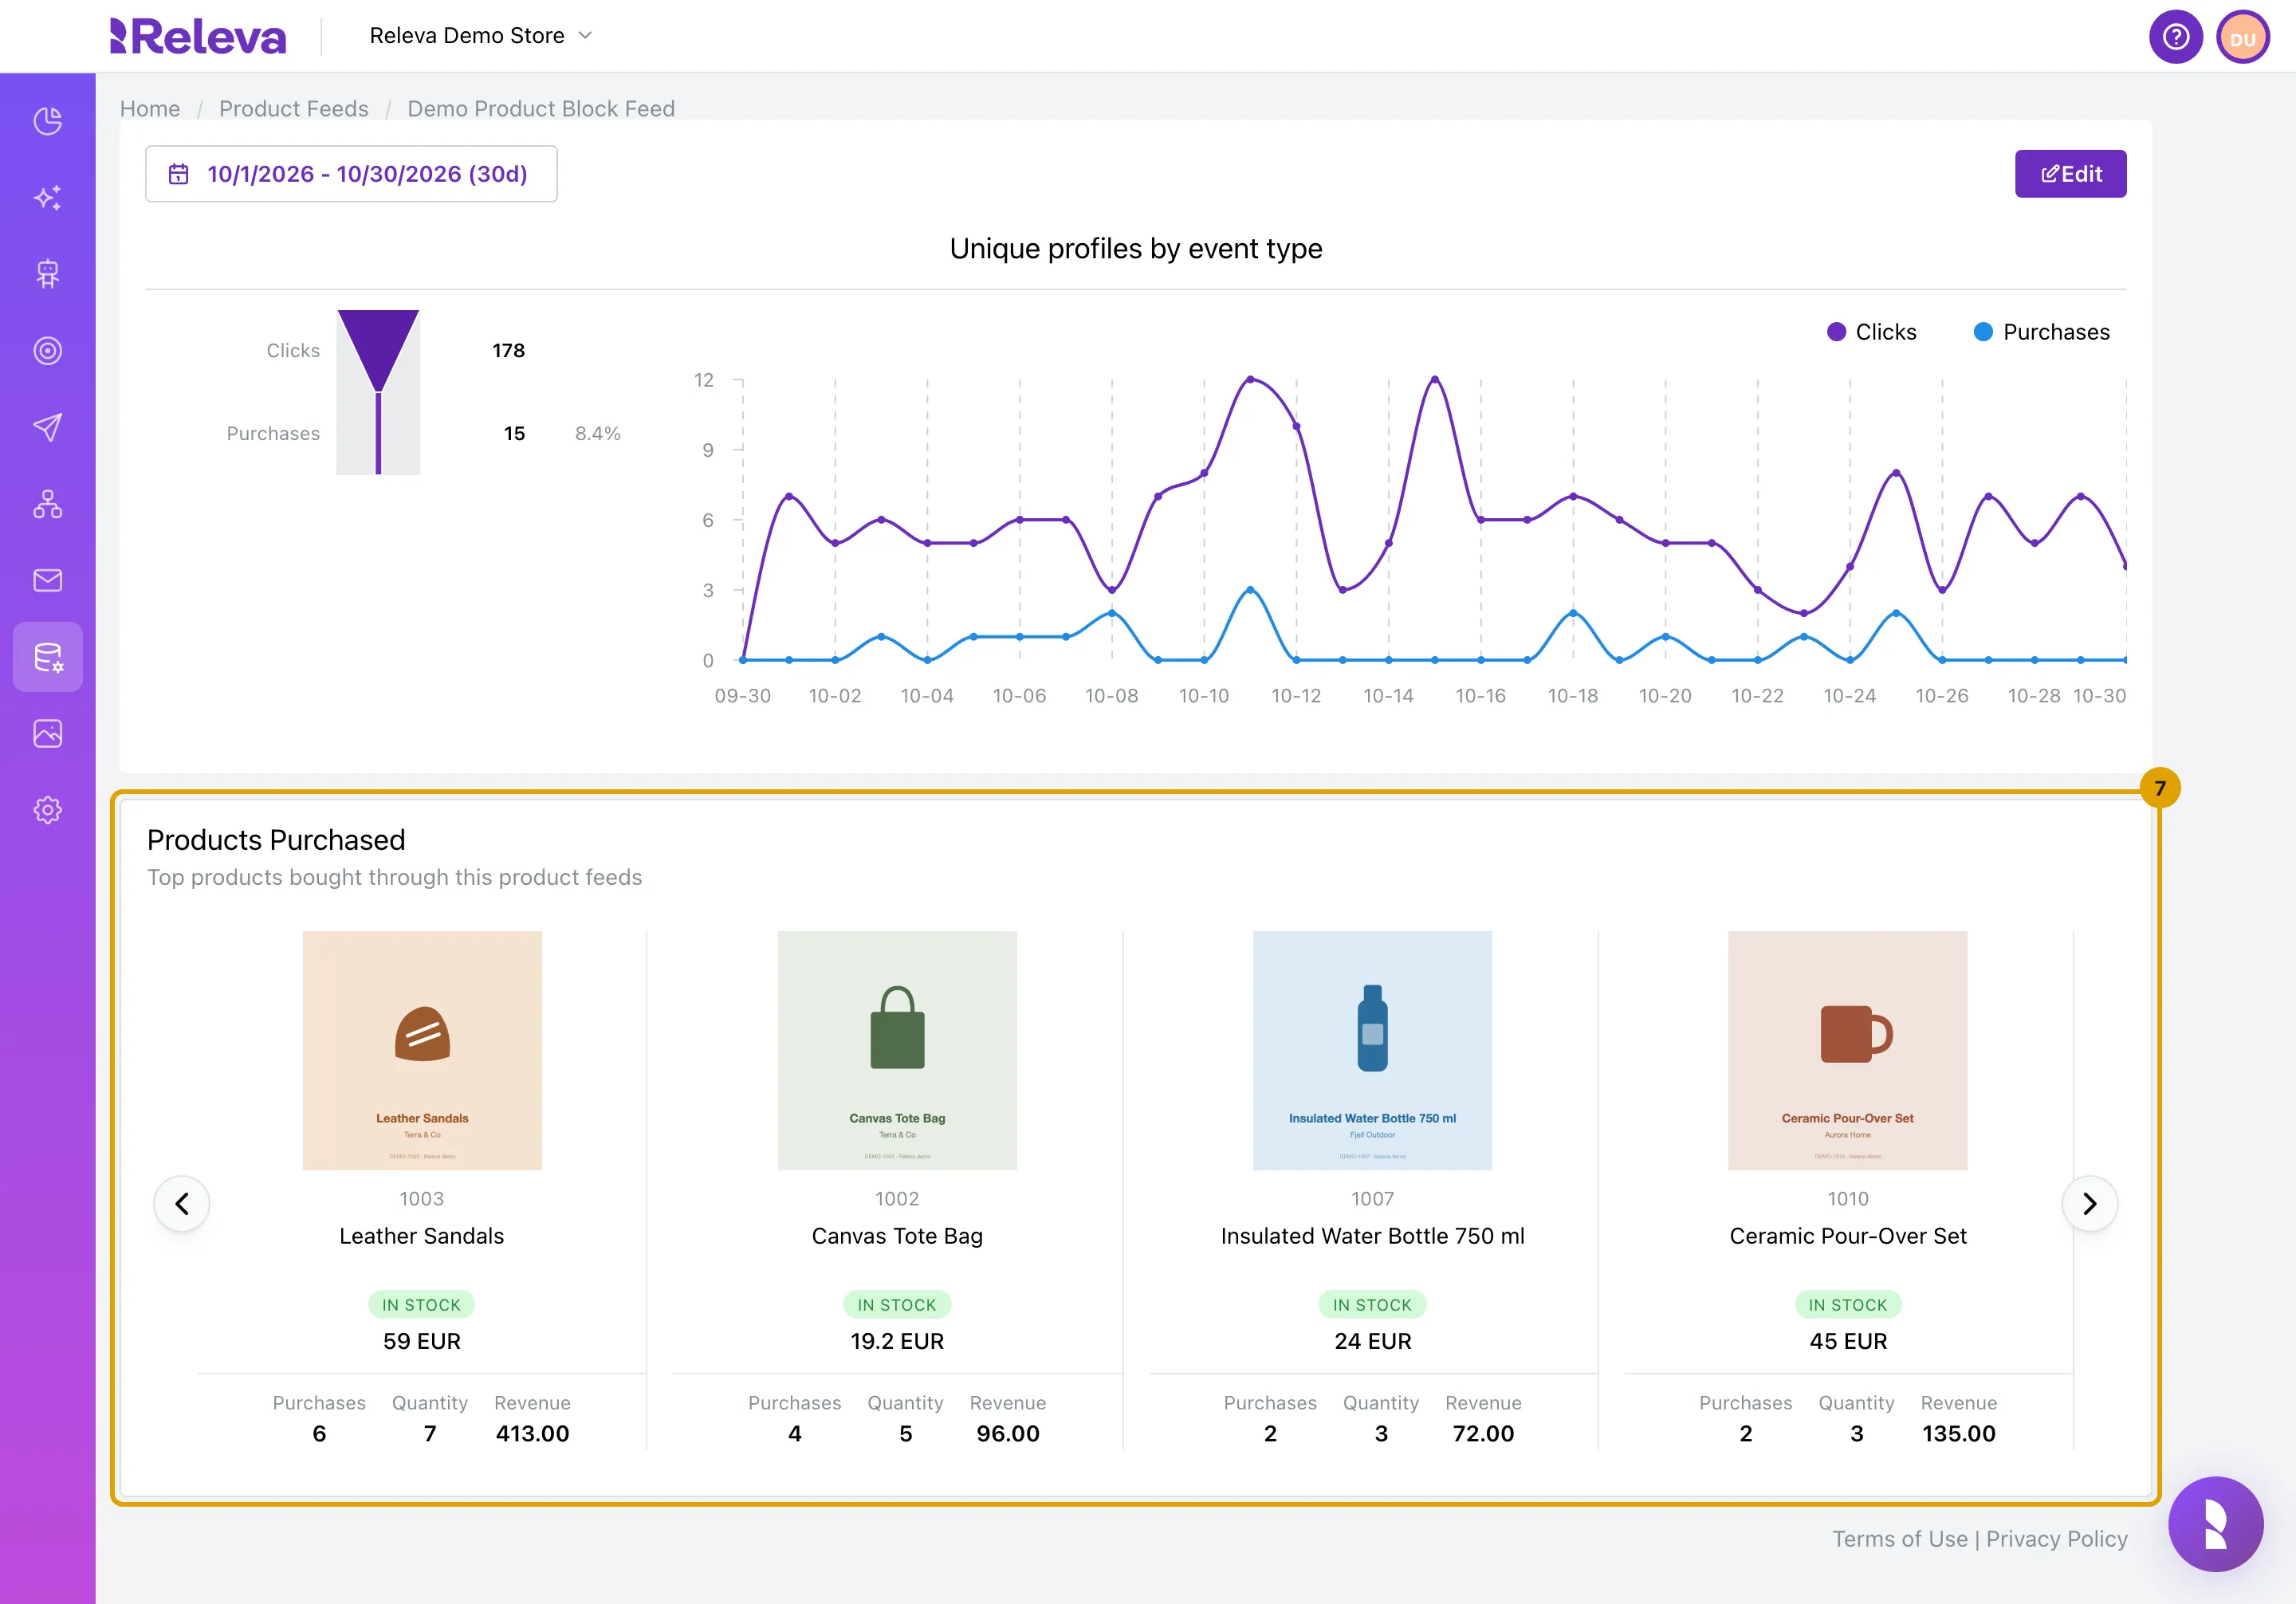
Under Products Purchased, see the products people bought through the feed
Each product shows Purchases, Quantity and Revenue for the period. Use the arrows on the sides to see more products. The card appears only when at least one product was bought through the feed in the period.
-
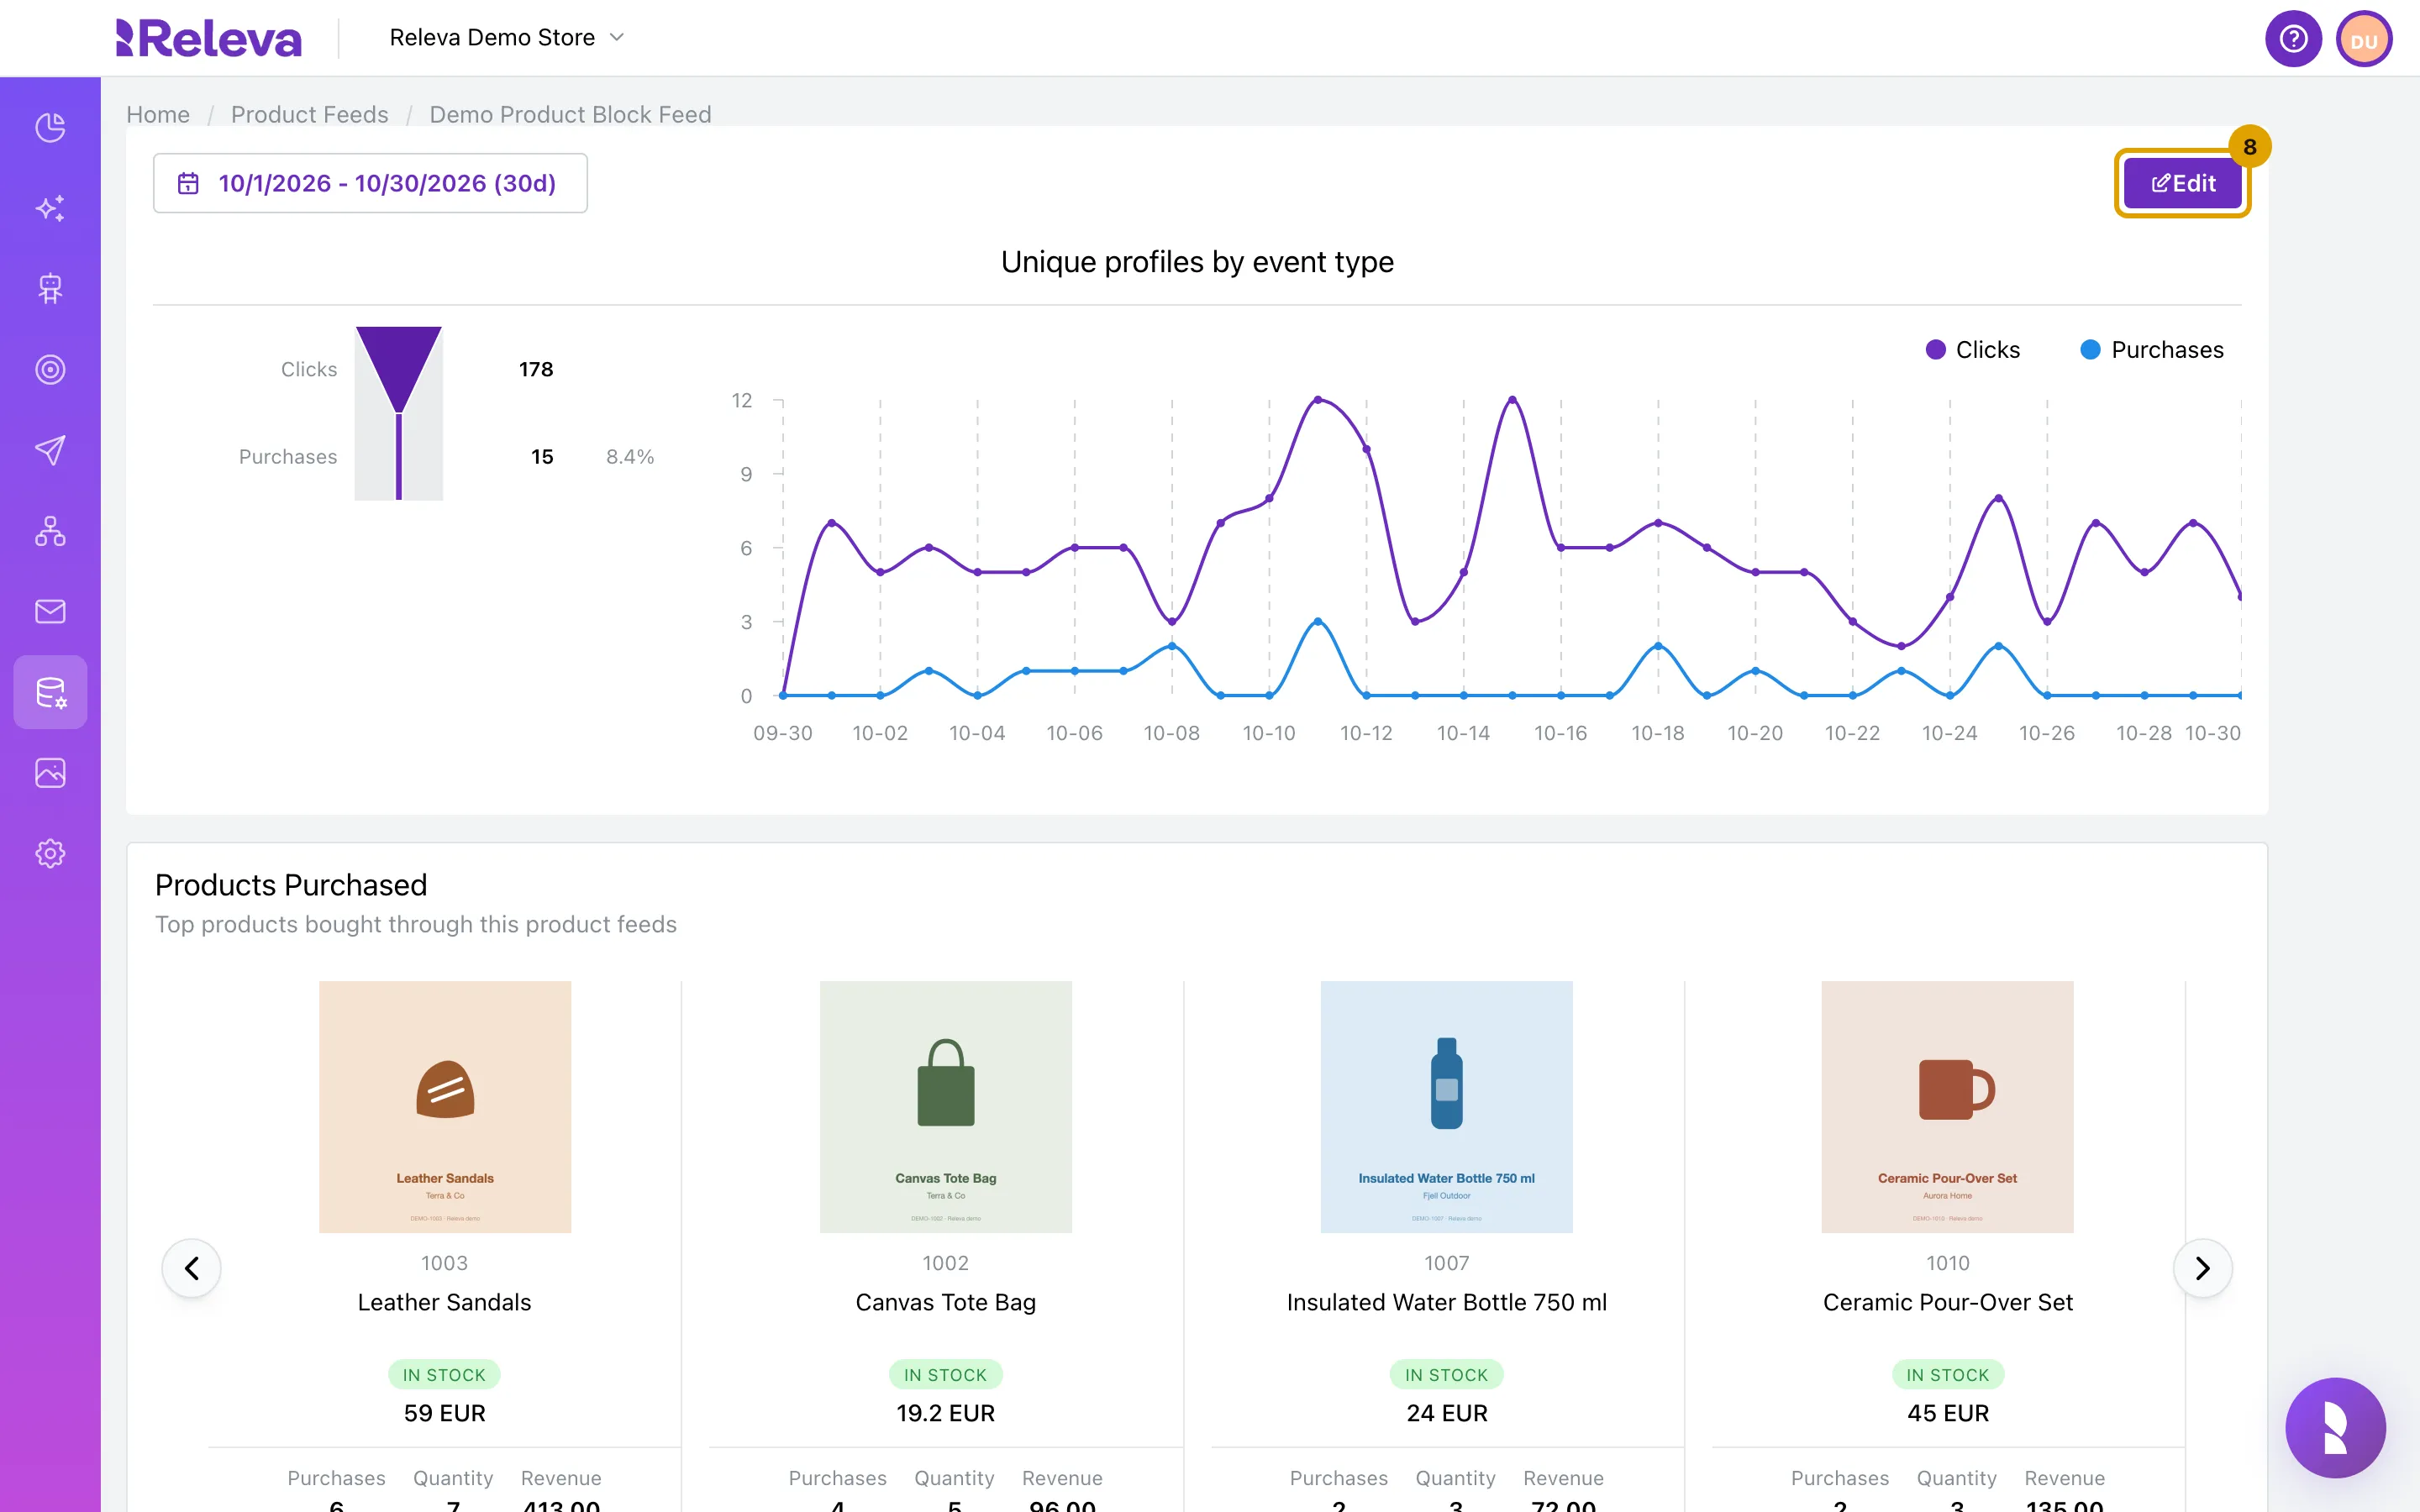
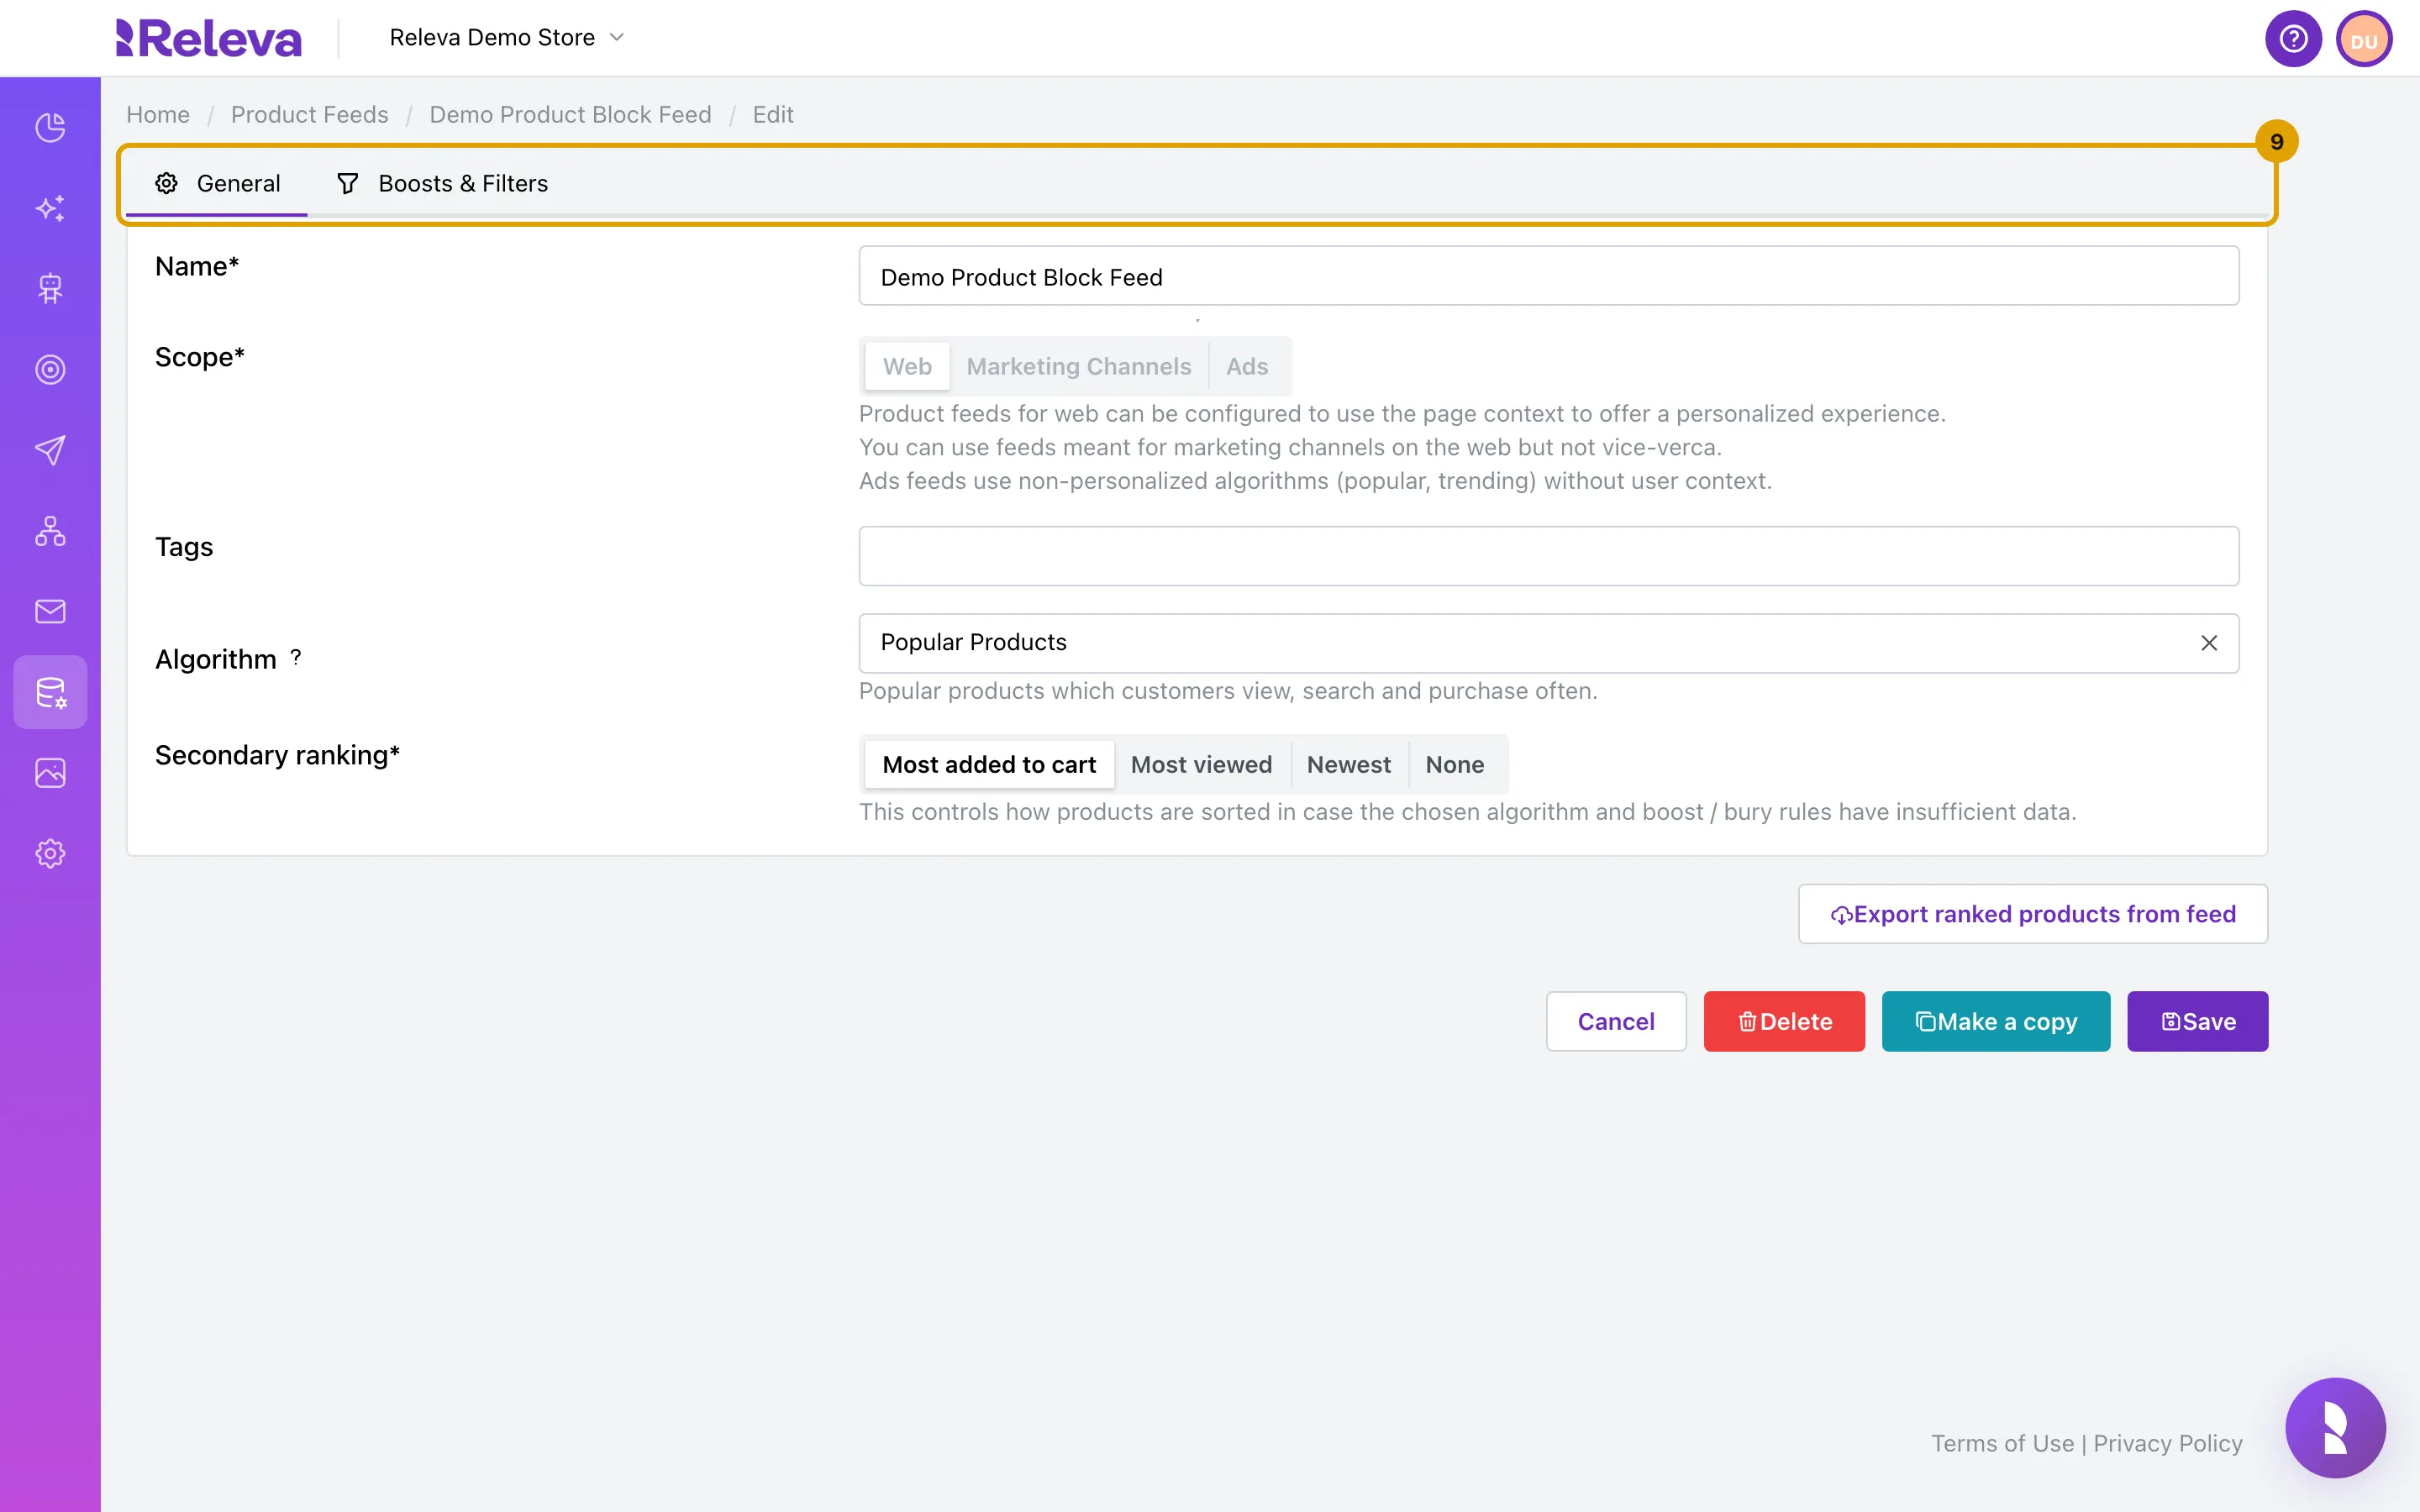
Select Edit to change the feed’s settings
-
The feed opens on the General tab; its rules are on the Boosts & Filters tab. Select Save when you are done
To leave without changes, select Cancel.
Check it worked
Section titled “Check it worked”- The breadcrumb reads Home / Product Feeds / <feed name> on the statistics page.
- The card counts every click and purchase, while the Statistics page counts unique people. For the same date range, Clicks on the Statistics page can be lower than on the card.
- After Edit, the breadcrumb ends in Edit and the General tab shows the feed.
Troubleshooting
Section titled “Troubleshooting”Everything is 0 and the page reads “No data available for the selected period”. No click was attributed to the feed in that period. Check that a Product Block or message uses the feed (the badges on the card), that it is live, and widen the date range.
The Products Purchased card is missing. Nobody bought a product through the feed in the selected period. Widen the date range.
“There was an error loading the resource: …” The statistics request failed. Reload the page; if it persists, contact support with the feed name and the message.
I need the ranked products, not the statistics. Select Export on the feed’s card. In Export Ranked Products from Feed, pick a Ranking Segment, set Max products to export (30 to 1000) and select Export. The file is e-mailed to you.